


Introduction
Mitochondrial disease (MD) arises from mutations within nuclear and mitochondrial genes, which control mitochondrial respiratory chain proteins1). These mutations may cause defects in oxidative phosphorylation. The brain, skeletal, and heart muscle are particularly vulnerable to defects in energy metabolism. Thus, mitochondrial encephalomyopathies and cardiomyopathies are commonly found in MD2). MD can develop at any age from infancy to adulthood. Childhood-onset MD is usually more aggressive than adult-onset MD3).
Duchenne muscular dystrophy (DMD) is the most common X-linked recessive hereditary neuromuscular disease. It is caused by a defect in the dystrophin gene product4). Dystrophin is expressed in the extracellular membrane of skeletal, cardiac and smooth muscle where it prevents injury to muscle fibers. A defect in dystrophin weakens muscle cells and results in atrophic change depending on the amount of stresses5). DMD mainly affects boys and usually begins in early childhood, causing progressive weakness in proximal muscles and cardiac dysfunction by the teen years6).
Despite differences in pathologic processes, these two diseases exhibit similar features in children, such as progressive muscular weakness, growth failure and cardiac dysfunction. According to many researchers, cardiac involvement occurs in 20% of patients with MD and up to 90% of patients with DMD during childhood. Once a cardiomyopathy develops, it results in significant mortality in both groups of patients7,8). For these reasons, cardiologists have focused on the pathologic transformation of myocardium in affected patients. However, some researchers suggested a loss of myocardium in the progression of DMD or paralyzed patients9,10). Thus, it is still worthy to investigate if myocardium has the variability within a specific characteristic, as skeletal muscle is worn down gradually. This process might result in either hypertrophy or reduction in patients with MD and DMD.
We can evaluate changes in myocardial structure by estimating left ventricular (LV) mass on a preferential basis with time-motion mode (M-mode) echocardiography. In adults, various indices have been introduced to normalize LV mass to body size with easy calculations such as dividing LV mass by height or body surface area (BSA). However, normalization of LV mass has not been achieved with the old methods in young children. This is pro bably because of the complex variables that influence ventricular mass during normal development11). Our study introduces a latest method that scores LV mass and eliminates the impact of body size. We have investigated the transformation of LV structure and its influence on cardiac function using M-mode and Doppler echocardiography in patients with MD and DMD.
Materials and methods
The data for the present study were collected at the Department of Pediatrics of Yonsei University College of Medicine, Gangnam Severence Hospital (Seoul, Korea). All of the research protocols were approved by the Institutional Review Board of Yonsei University Severance Hospital (IRB No. 3-2013-0201). All of the subjects or guardians provided written informed consent, if required.
1. Subjects
One hundred and thirty-two pediatric patients who were diagnosed with MD and DMD between January 2010 and March 2013 were included in this study. There were 90 cases of MD and 42 patients with DMD. The ages of the patients ranged from 2.5 to 18.5 years. All of the patients were referred from the Division of Pediatric Neurology or Rehabilitation Medicine for routine cardiac evaluation upon admission. We excluded clinically unstable patients who had fever, severe pain, shock, hypoxemia, sepsis, or intractable seizures, because these conditions can alter hemodynamic status. All the subjects were within normal blood pressure at the time of echocardiography.
Patients with MD were diagnosed by pediatric neurology specialists. Along with MD score12), muscle biopsies were obtained from all of the patients to diagnose light and electron microscopic changes and enzyme activity assessments or mitochondrial gene assays were performed13).
The diagnosis of DMD was also confirmed by specialized neurologists. Patients were required to meet the European Neuromuscular Center criteria. Eligibility also required an absence of dystrophin in the muscle biopsy6). Mutation of the dystrophin gene was detected by genetic analysis of dystrophin14).
All of the basic demographic characteristics and additional specific data were listed for the subjects, including age at echocardiography, the age of onset for the first symptom (prominent weakness of motor function or delay of neurological development), family history (any type of myopathies within second-degree relatives), assisted respiratory status with mechanical ventilator, wheelchair-bound, mental retardation, moderate degree scoliosis (Cobb angle over 25 degrees, before surgery if operated), previously diagnosed cardiopathy, or cardiac medication. Patient's height was measured on the examination table and weight on the bed scale or the wheelchair scale if needed. Laboratory tests included levels of aspartate aminotransferase (AST), alanine aminotransferase (ALT), creatine kinase (CK), and creatine kinase-MB (CK-MB). Arterial blood gas (pH and partial CO2) was examined around the time that echocardiography was performed.
2. Echocardiographic parameters
All the transthoracic echocardiographic measurements were performed by experienced operators. Two echocardiographic systems were used: the Siemens ultrasound system ACUSON SC1000 and the GE echocardiography system Vivid 7. All of the patients were examined from the parasternal long axis, the parasternal short axis and the apical 4-chamber views. M-mode measurements were performed in parasternal short axis view at papillary muscle level, and the mitral inflow velocities were detected at the tips of the mitral leaflets with pulsed wave Doppler. Tissue Doppler velocities were measured at the level of the mitral septal annulus. All measurements were performed over 3 times and averaged values were used. Pulse rate (PR) was checked with electrocardiograph (ECG) at the same time. In M-mode measurement, the following structural values were assessed: interventricular septal thickness (IVSd) and LV posterior wall thickness at diastolic phase (LVPWd), interventricular septal thickness (IVSs) and LV posterior wall thickness at systolic phase (LVPWs), LV end diastolic dimension (LVEDD) and end systolic dimension (LVESD). The mitral deceleration times, early (E) to late (A) ventricular filling velocities were checked by pulsed wave Doppler. The mitral annulus early diastolic velocity (Ea), late diastolic velocity and systolic peak velocity were gained through tissue Doppler signals from the medial side of the mitral annulus. E/A ratio and E/Ea ratio were derived from these Doppler findings.
3. Various equations in this study
Body weight and height were used to calculate body mass index (BMI).
The calculated BMI were converted to BMI-for-age z scores using a growth chart that included the lambda-mu-sigma (LMS) parameters of the Centers for Disease Control and Prevention.
Lean body mass (LBM) was deduced by validated sex-specific predictive equations that excluded race15).
In male: ln (LBM)=-2.8990+(0.8064×ln [height])+(0.5674×ln [weight])+(0.0000185×[weight]2)-(0.0153×[BMIz]2)+(0.0132×age)
In female: ln (LBM)=-3.8345+(0.954×ln [height])+(0.6515×ln [weight]) - (0.0102×[BMIz]2)
BSA was calculated by the Mosteller method.
LV end-diastolic volume (LVEDV) and LV end-systolic volume (LVESV) were calculated by the Teichholz correction of the cube formula16).
LVEDV (mL)=7/(2.4+LVEDD)×(LVEDD)3
LVESV (mL)=7/(2.4+LVESD)×(LVESD)3
Ejection fraction (EF) was calculated from the Teichholz formula.
EF (%)=100×(LVEDV-LVESV)/LVEDV
The relative wall thickness (RWT) was calculated as a ratio of wall thickness to inner cavity size.
RWT=2×LVPWd/LVEDD
LV mass was calculated by the Devereux equation17).
LV mass (g)=0.8×1.04×([LVEDD+IVSd+LVPWd]3-[LVEDD]3)+0.6
Stroke volume (SV) was derived from the Teichholz methods and cardiac output (CO) was deduced from SV.
SV (mL/beat)=LVEDV-LVESV CO (L/min)=SV×PR/1000
The allometric equations of SV and CO, established for children and adolescents by the same Teichholz method, were applied for comparison18). The equations were:
SV (mL/beat)=28.11×(height)1.45
CO (L/min)=2.629×(height)0.92.
To normalize SV and CO for variation in body size, stroke volume index (SVI) and cardiac index (CI) were introduced, dividing SV and CO by BSA respectively.
4. Normalizing LV mass for variation in body size
LV mass index (LVMI) is commonly used to normalize LV mass to body size in adult. In this study, LVMI was defined as:
LVMI (g/m2.7) = LV mass / (height)2.7.
Previous studies demonstrated that old methods for normalizing LV mass, such as LVMI, have some limitations, especially for children or adolescents, because of a residual correlation with body size11). To resolve this problem, we introduced the lambda mu sigma (LMS) method. LV mass-for-height z score and LV mass-for-LBM z score were generated from the L, M, and S values. These scores correspond to the individual's height and LBM, respectively11,19).
The reference data for the LMS tables were obtained from a prior research study conducted at Boston Children's Hospital20). LV mass-for-LBM z score could not be calculated for all subjects, because LBM could not be estimated for children younger than five years old15). Thus, the LMS data corresponding to LBM were unavailable for LBM values less than 13 kg19).
5. Statistical analysis
We analyzed the data with the SAS ver. 9.2 (SAS Institute Inc., Cary, NC, USA). We compared the parameters of two groups by Student t-test or Chi-square test. We used paired t-test for comparing two scores in a group. Pearson correlation coefficient was applied to analyze relations between two values. Statistical significance was determined as P<0.05.
Results
1. Subject characteristics
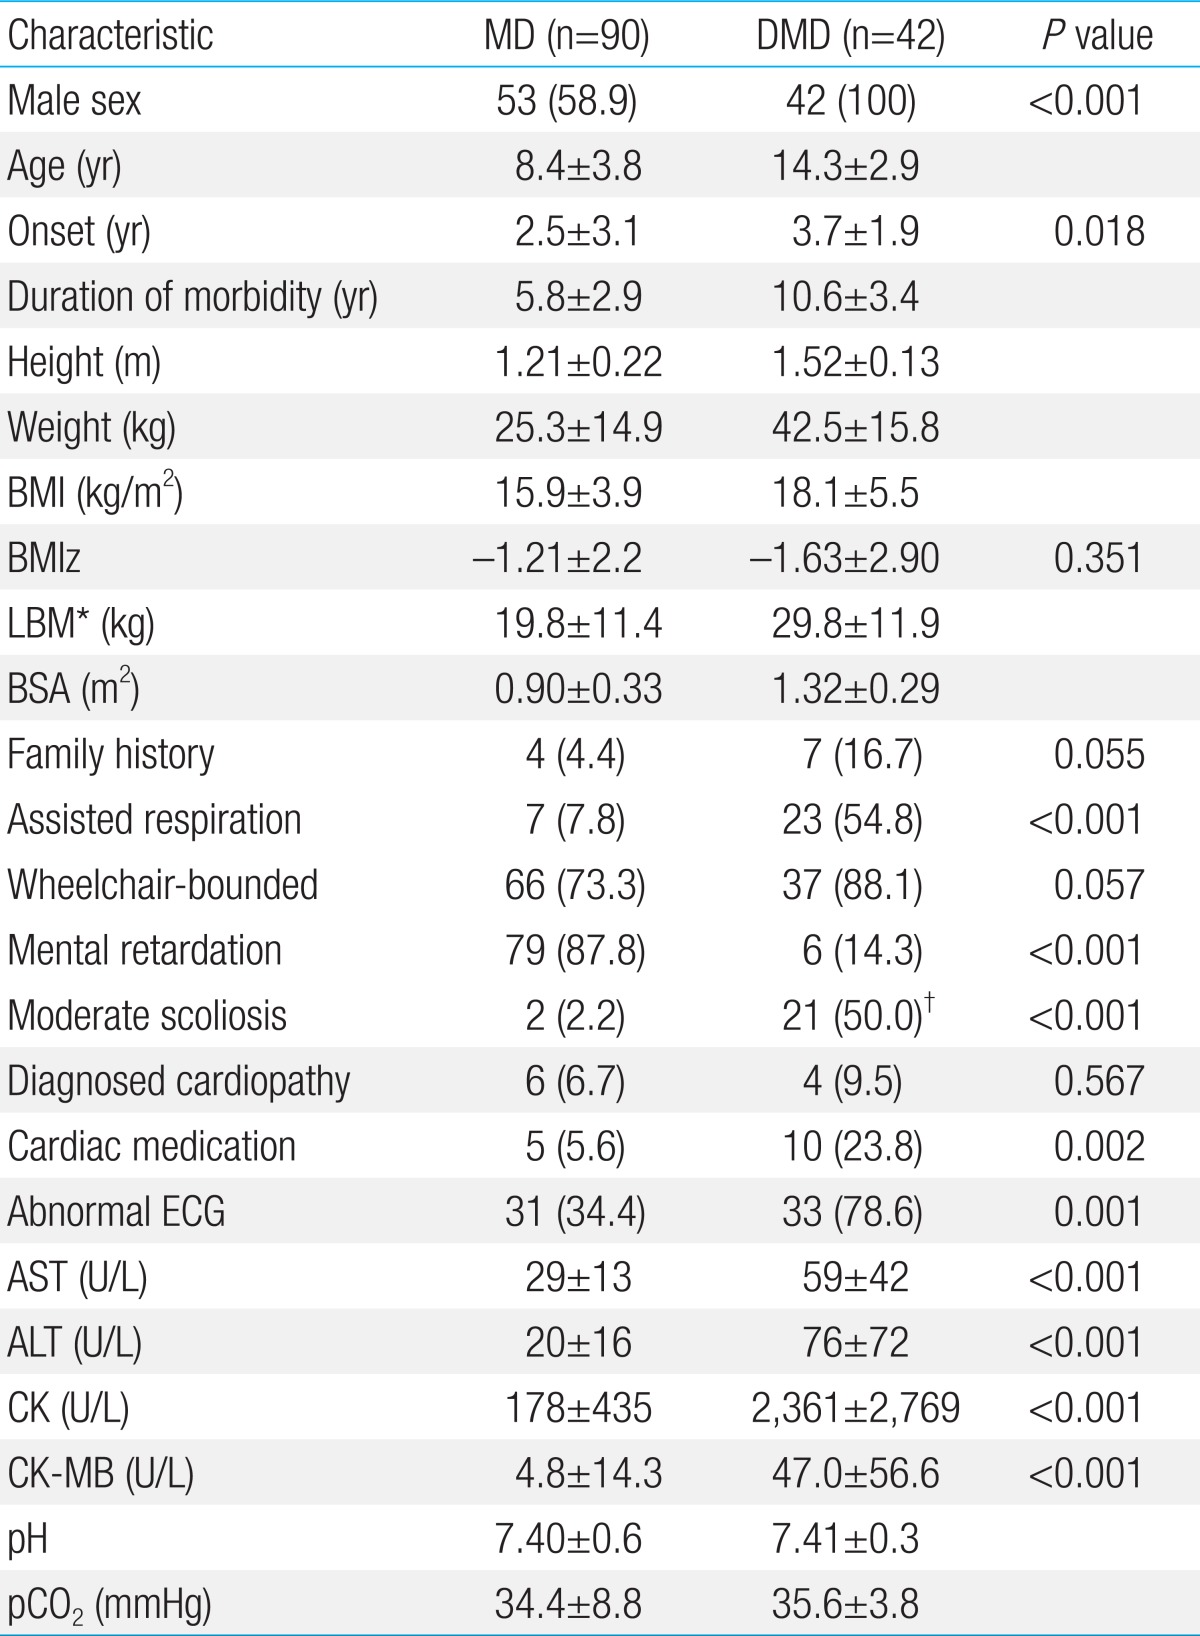
The clinical characteristics and laboratory findings are presented in Table 1. The ages of the 90 MD and 42 DMD patients were differently distributed, and the average ages were 8.4 and 14.3 years, respectively (P<0.001). The percentages of male patients were 58.9% and 100%, respectively (P<0.001). Patients with MD showed an earlier onset for symptoms than those with DMD (2.5 years vs. 3.7 years; P=0.018). The BMIz of the two groups were evenly dropped far below zero. A relatively larger percentage of DMD patients received assistance from mechanical ventilators (54.8%), and mental retardation was prominent in MD (87.8%). The percentages of patients who were wheelchair-bound were high for those with MD (73.3%) and DMD (88.1%). Moderate scoliosis was obvious in DMD group (50.0%) and most of them had corrected by previous operations (81.0%).
The enzyme activity assessments revealed mitochondrial respiratory complex (MRC) deficiency in 74 patients with MD (82.2%). Sixty-one patients were MRC I deficiency, one was MRC II and 10 were MRC IV. Several cardiac diseases were previously confirmed in patients with MD, including two hypertrophic cardiomyopathies (HCMP), one premature ventricular complex, one Wolff-Parkinson-White syndrome, and one atrial septal defect with patch repair status. Among the patients with DMD, one dilated cardiomyopathy, two hypokinesias of the left ventricle, one dextrocardia, and one severe bradycardia were found. Cardiac medications, such as digoxin, beta blockers, dopamine, angiotensin converting enzyme inhibitors, or diuretics were frequently prescribed for DMD patients (23.8%). Abnormal ECG findings were found in patients with DMD (78.6%). Laboratory values for AST, ALT, CK, and CK-MB were prominently elevated in DMD compared to MD. Arterial blood gas analysis showed reasonable levels of pH and pCO2, confirming the absence of systemic hypoxemia or acidosis in both groups.
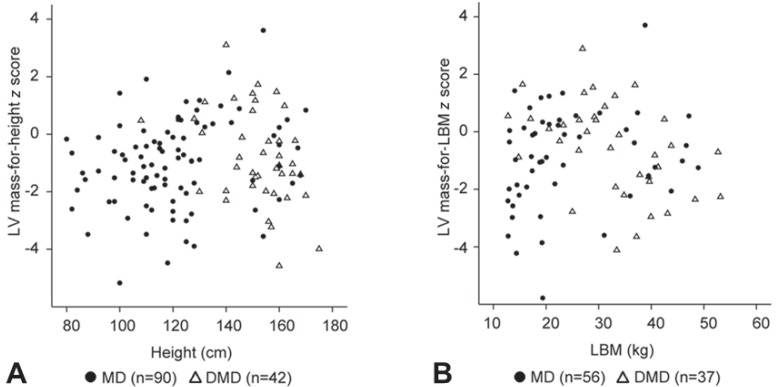
2. LV mass-for-height z score and LV mass-for-LBM z score
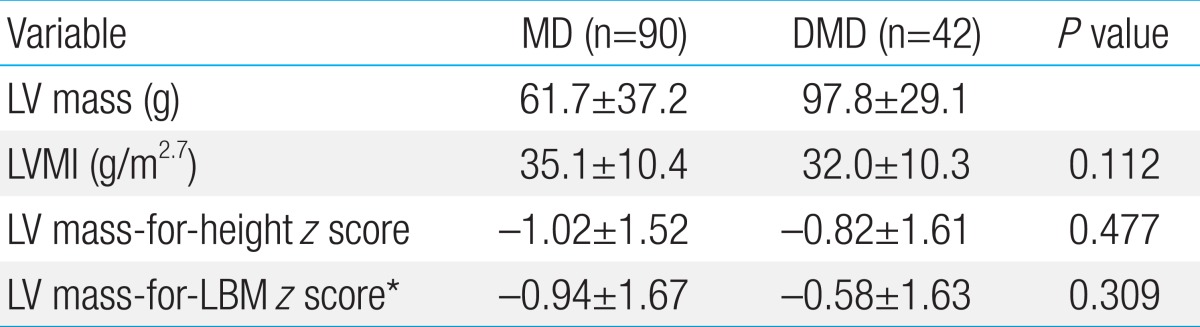
Echocardiographic findings are shown in Table 2, and calculated LV masses and transformed z scores are presented in Table 3. The average LV mass-for-height z scores were decreased below zero, suggesting atrophic changes in LV mass in patients with MD (-1.02±1.52, P<0.001) or DMD (-0.82±1.61, P=0.002). LV mass-for-LBM z scores were also decreased in MD (-0.94±1.67, P<0.001) and DMD (-0.58±1.63, P=0.038). The distributions of these z scores are presented in Fig. 1. There were no significant differences between LV mass-for-height z scores and LV mass-for-LBM z scores (-0.72 vs. -0.79, P=0.448) with a highly significant correlation (R=0.813, P<0.001).
3. Functional evaluation from echocardiographic data
The functional parameters derived from echocardiographic data are shown in Table 2. The pulse rates were mostly in reference ranges21), but the majority of them was above the median levels (72.0%). The EF in patients with MD were adequate22), whereas those of DMD were around the lower limit (68% vs. 57%, P<0.001). The abnormal EF below 50% were observed in 11 DMD patients (26.2%) and one MD patient (1.1%). RWT were slightly higher in MD compared with DMD (0.38 vs. 0.35, P=0.025), although RWT values were within the normal range23). E/A and E/Ea ratios were within normal limits24) and no differences were found between MD and DMD. The estimated SV values were relatively decreased from allometric SV in MD (35.1 mL/beat vs. 37.3 mL/beat, P=0.048) and DMD (46.6 mL/beat vs. 51.7 mL/beat, P=0.016). On the contrary, there were lack of significant differences between estimated CO and allometric CO in MD (3.3 L/min vs. 3.1 L/min, P=0.118) and DMD (4.2 L/min vs. 3.9 L/min, P=0.092).
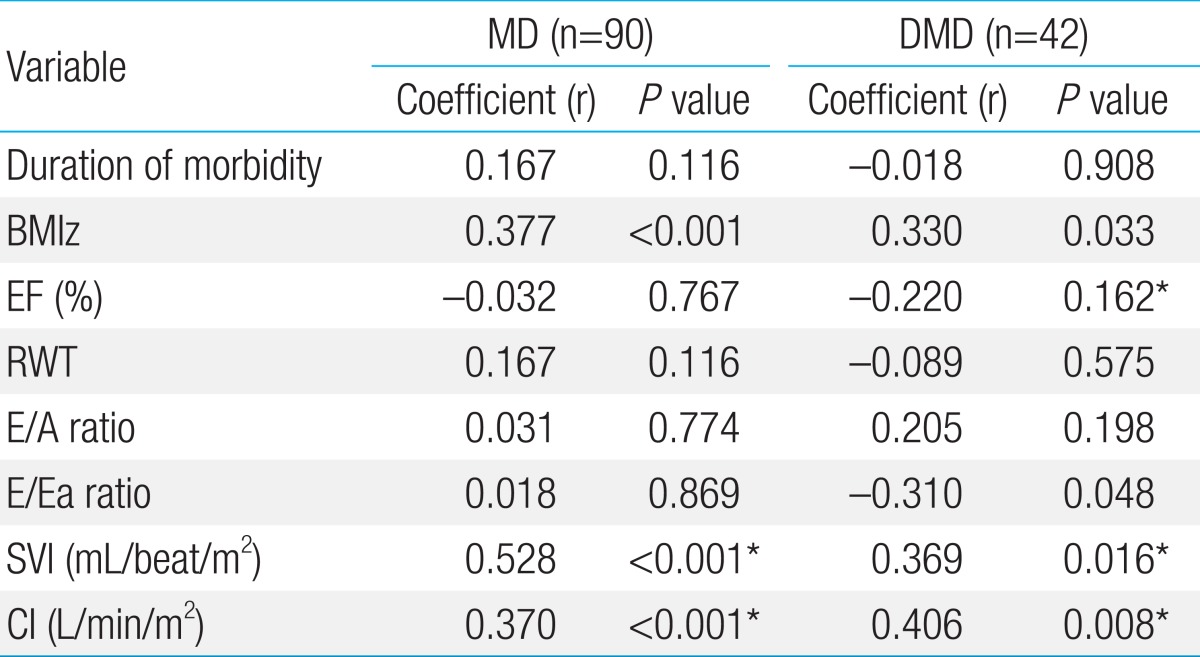
4. Correlations between LV mass-for height z score and other parameters
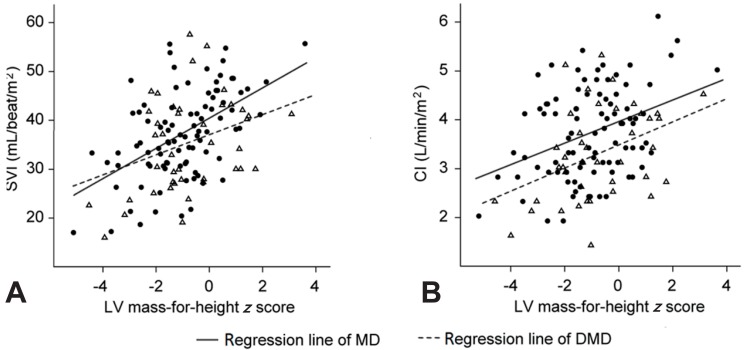
This study also confirmed if other data available for patients correlated with LV mass-for-height z score (Table 4). BMIz suggested positive correlation with LV mass-for-height z score in both groups, although duration of morbidity did not. RWT values for the two groups did not show significant correlations with LV mass-for-height z score. Meanwhile, SVI and CI showed overall positive correlations with LV mass-for-height z score in MD (SVI: R=0.528, P<0.001; CI: R=0.370, P<0.001) and DMD (SVI: R=0.369, P=0.016; CI: R=0.406, P=0.008) (Fig. 2). The same correlations were seen with LV mass-for-LBM z score in MD (SVI: R=0.600, P<0.001; CI: R=0.425, P=0.001) and DMD (SVI: R=0.410, P=0.012; CI: R=0.436, P=0.007). The presence of other baseline characters such as family history, assisted respiration, wheelchair-bound, mental retardation, moderate scoliosis, previously diagnosed cardiac disease, cardiac medication, and ECG abnormalities did not make differences with LV mass-for-height z score or LV mass-for-LBM z score.
Discussion
According to previous studies, the most common cardiac involvements in MD are HCMP, which occur in approximately 20% of MD patients. The cardiomyopathies associated with MD are usually diagnosed early in infancy, and rapidly progress to death before the age of two2,7). Meanwhile, cardiac dysfunctions in DMD are usually expressed as dilated cardiomyopathies6,8). Most of them present during the teen years, and their lifetime morbidity is about 90% with a 20% mortality rate25). As discussed above, investigations into the cardiopathologic changes that occur in MD and DMD have focused mainly on LV hypertrophy or dilation. Besides, an assumption of the steady shrinkage of heart could be possible, considering the progressive loss of other body components. Thus, we performed this study to confirm the structural and functional changes of the myocardium.
The first obstacle was normalizing LV mass to body size in growing children. We introduced the LV mass-for-height z score based on LMS data from another echocardiographic study, because typical indexation methods were not suitable for pediatric populations11). Although the influence of body size on LV mass was minimized by this scoring system, there were other problems that remained. The differences in heart size due to the effects of gender, ethnicity, race, and body weight could not be adequately corrected with the LV mass-for-height z score. Previous studies demonstrated that LBM was the most powerful determinant of LV mass compared with gender, race, weight, and other parameters26). The LV mass-for-LBM z score could also be calculated from the LMS table provided in another study19). This might be a more accurate method than using the z score based on height, but the complex calculation and age limitation of LBM should be carefully considered.
Our study demonstrated either the LV mass-for-height z score and the LV mass-for-LBM z score indicate reduction of LV mass beyond the effect of body size. A sufficient correlation between them satisfied the availability of the z score derived from height in place of LBM. Although the influence of disease duration on those z scores was not effectively proven in our study, BMIz showed significant correlations instead. Most of our patients had relatively small heights and low weights for age. Decreased BMIz might represent growth failure or muscle wasting in children with MD or DMD27,28). But LV reduction was beyond a reasonable proportion to the effect of bodily loss. LV masses were below the demand of body size in our patients.
The estimated SV values were below the standards but the estimated CO values were along with expected values probably by rapid PR in our patients. We should carefully consider a proper reason for the maintenance of CO despite their lower physical activities. The basal metabolic rates in MD and DMD might be increased with ATP synthesis reduction or protein catabolism increment29,30). As CO are determined by the basal metabolic rate as well as physical activity31), and SV are limited by decreased LV size, the myocardium would be forced to beat more. At this point, we can imagine the myocardium encountered two major threats: mass reduction and overwork. Therefore, the cardiac muscles in MD or DMD could be under chronic fatigue similar to other skeletal muscles32,33).
The parallel tendencies of SVI or CI relative to LV mass z scores also might be crucial, because the correlations imply myocardial reduction progresses with deterioration of systolic function. These results are comparable to measurements of diastolic function with E/A ratio or E/Ea ratio. They were grossly in normal ranges and had no correlations with LV mass z scores. Thus, our results indicate an essential role for LV mass in sustaining sufficient systolic function for body size. The atrophic change of myocardium and its functional influence have already been suggested in some studies of DMD or the paralyzed patients previously9,10). They demonstrated the reduction of cardiac mass in their patients, and proportionally decreased systolic function by increased afterload secondary to wall thinning. These findings are similar with the results of our study in MD as well as DMD. With an improved methodology of echocardiographic analysis, we reassure the myocardial atrophy and systolic influences in MD and DMD. If the metabolic demands are increased by severely ill conditions, the atrophied myocardium might fall into more prominent dysfunction.
Pathologic changes of myocardium should be characterized by wall-to-cavity ratio basically. One obesity study demonstrated the shared variability among body weight, LV mass and RWT34), and the study on DMD showed LV mass atrophy was driven by reduced wall thickness rather than cavity diameter10). Thus, myocardial thinning was presumed to initiate mass reduction accordingly in this study. Against the expectation, RWT was not significantly correlated with LV mass z score, and did not deviate from normal limits identifying the possibility of equally diminished LV wall thickness and inner cavity diameter. The exact explanation for the disparity could not be given in this cross-sectional study. We can only suggest that the myocardial changes might be from different pathologic processes between MD and DMD for their different RWT. Or a further longitudinal study could determine common dynamics of LV wall changes.
Our study has some limitations. First, even though the number of subjects was large, patients were confined to one medical center in our institution. This limitation might have resulted in the lower incidences of cardiac involvements against as reported. Thus, multicentered, multiracial studies should be conducted in the future. Second, the analysis for the echocardiographic data had been performed with the single examination on each patient. The investigation of myocardial atrophy should be required to analyze sequential changes over time meticulously. The possibility of restoration of LV mass needs to be identified to help improve cardiac function in patients with MD and DMD. Nevertheless, this study provides better insights into the myocardial atrophy and its hemodynamic influences in MD and DMD.
In conclusion, we estimated LV mass z scores using M-mode echocardiography to demonstrate the presence of LV atrophy in MD and DMD patients. The cardiac reduction might be in a close association with decreased BMI. LV mass insufficiency for body size might indicate deterioration of systolic function in patients with MD and DMD.

 PDF Links
 PubReader
 PubMed
 Download Citation


