



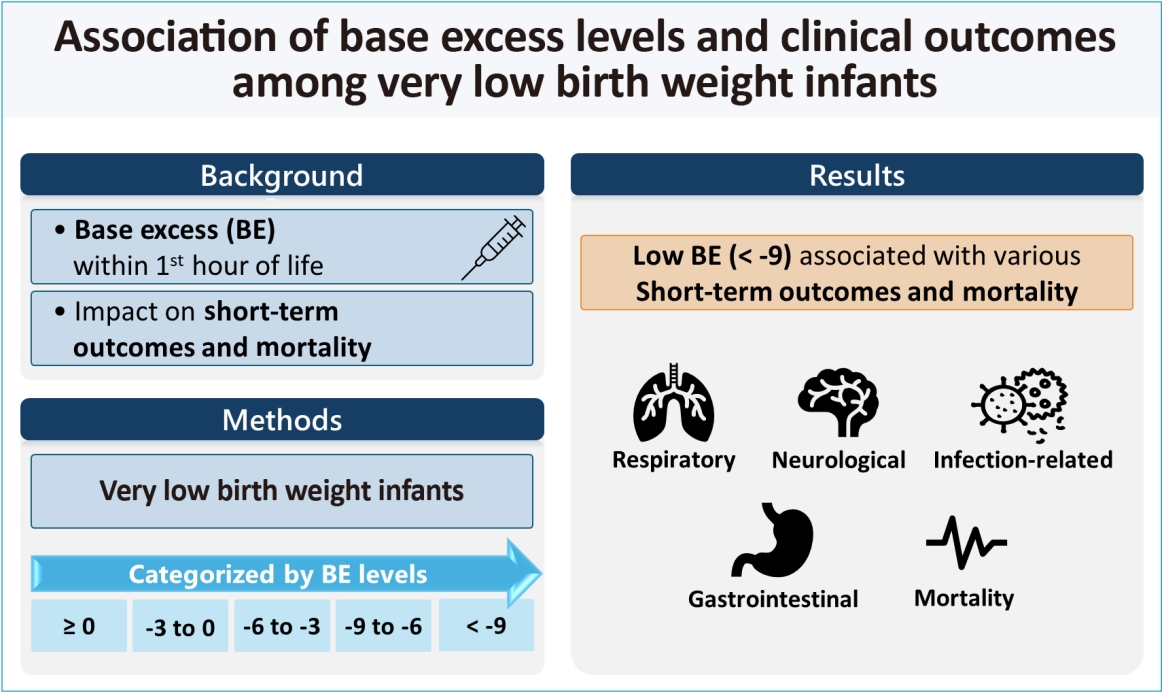
Graphical abstract
Introduction
The intricate interplay of diseases, growth, and development presents a constant challenge in the management of very low birth weight infants (VLBWIs), mostly consisted of preterm babies [1-3]. Coexisting morbidities, including respiratory, cardiac, gastrointestinal, neurological, and endocrinological issues may arise [1-3]. Although these extremely fragile neonates are effectively rescued from the acute risks during birth, long-term complications such as cerebral palsy remain a significant concern [4-6].
Metabolic acidosis is a well-established occurrence in physiologically immature neonates, particularly those born preterm, especially during the early stages of life. This condition closely resembles renal tubular acidosis and arises from physiological processes that occur during fetal development, enabling the infants to tolerate it relatively well [7,8]. Physicians typically adopt a permissive approach to manage metabolic acidosis in these cases, prioritizing the treatment of the overall well-being of the infants rather than directly treating metabolic acidosis [9]. However, the overall function of multiple organ systems could be affected on the basis of the severity of the acidosis. Furthermore, the short- and long-term consequences of metabolic acidosis on the outcomes of infants remain uncertain. A comprehensive analysis on a large study cohort could facilitate the exploration of potential effects of subtle acid-base changes on outcomes. However, there are no studies that have clearly explained the impact of initial acidosis at birth in VLBWIs.
In our study, we analyzed blood gas measurements obtained within the first hour of life for a prospective multicenter cohort of 14,519 Korean VLBWIs. The Korean Neonatal Network (KNN) was used to provide the data for this analysis [10,11]. We aimed to investigate the association between metabolic acidosis and clinical outcomes in VLBWIs.
Methods
1. Data source
We sourced the data utilized in this study from the KNN, which is a nationwide, multicenter, birth cohort that includes registered information on VLBWIs spanning 76 hospitals [11]. The KNN project, sponsored by the Korea Disease Control and Prevention Agency and led by the Korean Neonatal Society, spanned from 2013 to 2019 [12]. Our study included infants with a birth weight of less than 1,500 g who were admitted to the neonatal intensive care units across 76 participating hospitals. The dataset encompassed various aspects, including clinical information, epidemiological characteristics, treatment modalities, and clinical outcomes of the enrolled infants [13]. The institutional review board (IRB) of Kyung Hee University Medical Center (IRB No. KHUH 2013-09-103) approved our study protocol as well as those of all 75 hospitals participating in the KNN (2025-ER0601-00#). Upon enrollment, we obtained informed written consent from either parents or guardians or both of all the participants.
2. Study population
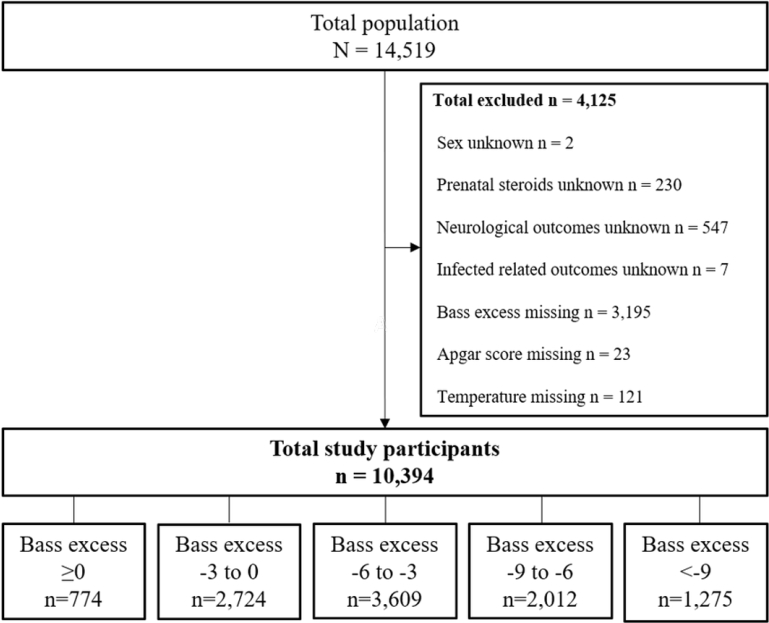
Our study sample consisted of 14,594 infants with birth weight less than 1,500 g, who were admitted to the neonatal intensive care unit between January 2013 and December 2019 (n=14,519). We prospectively investigated their clinical covariates and outcomes, including death and hospital discharge. We then excluded infants on the basis of the following criteria: (1) incomplete data source (excluded n=809); (2) missing blood sample data including base excess (BE) levels (excluded n=3,195); and (3) missing temperature data at birth (excluded n=121). After applying the exclusion criteria, the final study cohort included 10,394 infants (Fig. 1).
3. Exposures
Based on KNN data from 2013 to 2019, records measuring the BE (mEq/L) levels of blood gas within 1 hour of birth were classified into 5 groups: ≥0 mEq/L, -3 mEq/L to 0 mEq/L, -6 mEq/L to -3 mEq/L, -9 mEq/L to -6 mEq/L, and <-9 mEq/L. BE was categorized into 3 mEq/L intervals to allow clinically interpretable comparisons. Respiratory outcomes included air leak syndrome, massive pulmonary hemorrhage, pulmonary hypertension, neonatal respiratory distress syndrome, and bronchopulmonary dysplasia. In addition, bronchopulmonary dysplasia was classified as mild or moderate to severe. Neurological morbidities (neonatal seizure, periventricular leukomalacia, or intraventricular hemorrhage), infection-related outcomes (congenital infection, sepsis, or meningitis), and gastrointestinal outcomes (necrotizing enterocolitis or bowel performance) were classified based on the dichotomous responses of ‘yes’ or ‘no.’ Finally, endpoints included death while in neonatal intensive care units.
4. Statistical analysis
In our nationwide, multicenter birth cohort in South Korea, “exposure” was BE levels at birth and “outcomes” were respiratory outcomes (air leak syndrome, massive pulmonary hemorrhage, pulmonary hypertension, neonatal respiratory distress syndrome, bronchopulmonary dysplasia), neurological morbidities, infection-related outcomes, gastrointestinal outcomes, and mortality. We described the covariates as number (percentile) or mean± standard deviation. Multinomial logistic regression was used to analyze the data and recorded as crude and adjusted odds ratio (OR) with 95% confidence interval (CI) [14] for the groups after adjusting for potential confounding factors, such as: sex, birth year (2013–2015 and 2016–2019), prenatal use of steroids, gestational age (22–27 weeks, 28–33 weeks, and 34 weeks or more), 1- and 5-minute Apgar scores (0–3, 4–5, and ≥6), birth weight (<500 g, 500–1,000 g, ≥1,000 g), maternal age (continuous value), and temperature at birth (<35.5°C, 35.5°C–37.5°C, ≥37.5°C) [14]. The gestational age was divided into 3 groups based on data availability. We used the Kolmogorov-Smirnov test to confirm the normality assumption of maternal age (P>0.05). Statistical analyses were performed using SAS 9.4 (SAS Institute, USA). A 2-sided P value of less than 0.05 was considered statistically significant.
Results
Between 2013 and 2019, a total of 10,394 infants were registered with the KNN. Among them, 774 infants (7.45%) had a BE of 0 mEq/L or greater, 2,724 infants (26.2%) between -3 mEq/L and 0 mEq/L, 3,609 infants (34.72%) between -6 mEq/L and -3 mEq/L, 2,012 infants (19.36%) between -9 mEq/L and -6 mEq/L, and 1,275 infants (12.27%) below -9 mEq/L. Table 1 provides an overview of the baseline characteristics of the study population.
Table 2 presents the association between respiratory outcomes and BE at birth. Adjusted OR with 95% CI were calculated to examine the risk of respiratory outcomes in infants with lowest BE levels compared to those with highest BE levels. The results showed that infants with lowest BE had higher adjusted significant OR for various respiratory outcomes than those of the reference group (adjusted OR [aOR], 1.0): air leak syndrome (aOR, 2.071; 95% CI, 1.305–3.285), massive pulmonary hemorrhage (aOR, 2.317; 95% CI, 1.502–3.575), pulmonary hypertension (aOR, 2.296; 95% CI, 1.667–3.161), and neonatal respiratory distress syndrome (aOR, 2.219; 95% CI, 1.778–2.769).
Table 3 presents the correlation between BE levels at birth and various outcomes, including neurological morbidities, infection-related outcomes, gastrointestinal outcomes, and mortality. Among infants with lowest BE levels, there was an observed adjusted OR of 2.797 (95% CI, 2.314–3.380) for neurological morbidities, 2.082 (95% CI, 1.653–2.623) for infection-related outcomes, 1.979 (95% CI, 1.408–2.783) for gastrointestinal outcomes, and 2.683 (95% CI, 2.076–3.466) for mortality. The odds were higher than the corresponding OR values in infants with highest BE. These associations held consistent patterns across stratification analyses based on sex, birth year, gestational age, and birth weight.
Discussion
1. Findings of our study
The primary aim of our study was to investigate the influence of metabolic acidosis occurring at birth on clinical outcomes in VLBWIs, a population characterized by inherent physiological fragility and clinical vulnerability. Our study analyzed KNN data that focused primarily on the gas analyses of blood samples obtained within the first hour of life from a cohort of 14,519 VLBWIs. Our study results indicate that metabolic acidosis at birth was associated with mortality and adverse effects on respiratory, neurological, infection-related, and gastrointestinal functions in VLBWIs. Moreover, all groups classified by on sex, birth year, gestational age, and birth weight showed a consistent risk. This implies that all adverse outcomes of VLBWIs are highly susceptible to the impact of metabolic acidosis.
2. Comparisons with previous studies
Previous study demonstrated an association between metabolic acidosis in preterm infants and neurological morbidities. However, this study had a relatively small sample size (n=294) and did not target various outcomes [15]. In addition, several studies suggested an association between metabolic acidosis and various outcomes [16-18]. However, the role of initial metabolic acidosis in VLBWIs has not been well-established. The findings of our study indicate that metabolic acidosis in VLBWIs has adverse effects on clinical and, with a particularly notable impact, on neurological morbidities. However, some publications suggest that metabolic acidosis in this population may not be a reliable predictor of neonatal outcomes. This may be explained by the fact that these studies had small sample sizes ranging from approximately 700 to 3,000 preterm infants [19,20]. In contrast, our study included a total of 14,519 VLBWIs, mostly consisted of preterm infants and represents the most extensive analysis conducted to date on various neonatal outcomes.
3. Plausible mechanism
In our cohort, as most of VLBWIs were preterm infants, preterm acid-base physiology is applicable to the interpretation of our results. Preterm infants have been recognized to experience a temporary occurrence of normal anion gap metabolic acidosis during the early stages of postnatal life [9,21]. This phenomenon could be attributed to renal immaturity, which results in an increased loss of urinary bicarbonate and a reduced capacity to secrete ammonium (NH4+) [9,19,22]. Premature infants exhibit a decrease in ion channel activity and a low count of distal tubular cells, resulting in an inability to produce ammonia and a decrease in the supply of bicarbonate to the blood [23,24]. Furthermore, the decreased glomerular filtration rate contributes to a diminished ability to excrete NH4+ and titratable acid in the urine, while also preventing bicarbonate reabsorption. Although there are differing opinions on whether it should be treated or not, there is a permissive attitude towards metabolic acidosis in the perinatal period in preterm infants [25].
Nonetheless, there are additional factors that could lead to an acidic gas analysis, including perinatal oxygen depletion resulting from fetal distress, prolonged intrapartum hypoxia, or neonatal resuscitation [19,26]. Studies have shown that fetal distress accompanied by repetitive, variable decelerations can cause a decrease in BE levels of approximately 1 mmol/L per 30 minutes, while terminal bradycardia resulting from a ruptured uterus or major abruption can lead to a decrease of roughly 1 mmol/L per 2–3 minutes [27]. Since the glycogen reserves are relatively limited, extremely preterm infants are particularly vulnerable to anaerobic metabolism, even with only a slight decrease in oxygen levels [19]. Consequently, growth restriction or placental insufficiency can further amplify the risk of impaired multiorgan function or death [19].
From this standpoint, we anticipate that although metabolic acidosis may be tolerated within certain limits in preterm physiology, low pH and BE levels in cord blood gas or arterial blood gas within the first hour of life could potentially have detrimental effects on multiorgan functions. In our study, we specifically focused on using BE levels as a measure since it provides valuable insights into cord blood pH and helps to distinguish between metabolic acidosis and respiratory acidosis [11,28,29].
4. Limitations and strengths
Our study was conducted on a substantial scale with diverse samples to reduce selection bias. This prospective, multicenter VLBWI birth cohort study results showed that metabolic acidosis is associated with mortality, respiratory, neurological, infection-related, and gastrointestinal morbidities. Furthermore, the association between metabolic acidosis and multiple clinical outcomes remained robust even after accounting for potential confounders, such as sex, birth year, birth weight, temperature at birth, and several maternal parameters. The data from KNN, encompassing neonatal intensive care units in over 75 hospitals, facilitated the dynamic investigation of the relationship between metabolic acidosis and multiple clinical outcomes [30,31]. Through a comprehensive analysis of a 7-year nationwide dataset encompassing 14,519 VLBWIs, our study provides valuable insights into the impact of metabolic acidosis on the clinical outcomes of VLBWIs.
Our study has several limitations. First, the use of both cord blood and blood sampling within an hour following birth for gas analysis may introduce potential influences from other factors, including immediate postnatal respiratory distress that affect the results of gas analysis and subsequent neonatal outcomes. Second, since our data were confined to South Korea and demonstrate only nationwide trends, its application is likely restricted in connection with worldwide populations. Finally, confounding variables, beyond those accounted for in the study, limits the establishment of causal relationships. In addition, the KNN does not fully represent the entire national population.
5. Policy implications
There are significant implications from the findings of our multicenter cohort study, particularly concerning the management of VLBWIs with initial metabolic acidosis. Considering the observed correlation between metabolic acidosis and clinical outcomes in VLBWIs, it is important to develop policies to ensure comprehensive monitoring and acid-base balance managements [32]. The results of our study emphasize the critical need for early detection and prompt intervention in infants exhibiting metabolic acidosis, with a focus on minimizing the associated risks for respiratory, neurological, infection-related, and gastrointestinal complications as well as mortality. Consequently, standardized protocols should prioritize incorporating regular assessments of acid-base balance in neonatal care units, thereby enhancing the overall quality of care and potentially improving long-term outcomes for VLBWIs. These policy implications suggest the need for healthcare administrators and policymakers to consider implementing evidence-based strategies aimed at reducing the risks associated with metabolic acidosis and enhancing the quality of their clinical outcomes [29,32].
Our study's findings highlight the potential impact of metabolic acidosis at birth on clinical outcomes in VLBWIs. We found that potential associations, as measured by BE levels, were observed between metabolic acidosis measured within 1 hour of birth and adverse respiratory, neurological, infection-related, gastrointestinal outcomes as well as mortality. Our findings are significant not only for physicians providing insights into the care of VLBWIs with initial metabolic acidosis but also for future research aimed at exploring risk factors related to acid-base balance in these highly predisposed infants and the mechanisms influencing neonatal outcomes, particularly with respect to brain injury.


 PDF Links
 PubReader
 ePub Link
 XML Download
 PubMed
 Download Citation