


Introduction
Mucopolysaccharidosis (MPS) is a group of rare recessive genetic disorders that interfere with lysosomal enzymes that are critical for glycosaminoglycan (GAG) metabolism, resulting in GAG accumulation in the tissues and the malfunction of multiple organs, leading to disease symptoms [1].
MPS is a multiorgan systemic disease that causes symptoms ranging from airway obstruction, skeletal deformities, and neurological decline to cardiovascular disease and growth abnormalities [2,3]. Studies have reported normal or increased height and weight gains in patients with early-stage MPS types I and II; however, these gains are lost dramatically by 2–5 years of age [4]. Furthermore, short stature is prevalent among patients with severe MPS types III and IVA [5,6]. Symptom severity and growth pattern disruptions are influenced by multiple factors, including disease severity, sex, and timely treatment [7,8].
Various treatment options have been proposed for MPS [9,10]. However, enzyme replacement therapy (ERT) and hematopoietic stem cell transplantation (HSCT) remain the main options available to most patients [9-11]. HSCT involves transplanting healthy matched donor cells from the peripheral blood, bone marrow, or umbilical cord to continuously release intact enzymes and permanently treat patients with MPS [10]. Despite myriad factors, including age, pretreatment regimens, and disease progression, promising effects such as improvements in growth, joint mobility, and the respiratory system have been observed [12].
Comprehending the long-term growth trajectories of patients with MPS following HSCT is essential for refining clinical management strategies and enhancing patient care. Growth is a tangible and quantifiable indicator of treatment efficacy and overall health status in pediatric patients. A comprehensive assessment of the influence of HSCT on growth patterns will enable clinicians to better understand the enduring benefits and possible constraints of this treatment [13]. The current study aimed to use a systematic review and synthesis of the evidence in the literature to determine the effect of HSCT on growth patterns in patients with MPS. We hope that its findings will enhance our understanding of MPS and optimize its treatment by supporting clinicians, patients, and parents with informed decision-making.
Methods
This systematic review was conducted according to the PRISMA (Preferred Reporting Items for Systematic Reviews and Meta-analyses) guidelines [14]. The study protocol was registered in PROSPERO (registration No. CRD42024571488).
1. Eligibility criteria
This study included randomized controlled trials, prospective or retrospective cohort studies, case-control studies, case series, and observational studies that investigated the effect of HSCT on the growth parameters of patients with MPS with emphasis on bone marrow transplantation (BMT) published through April 20, 2024.
We excluded studies that investigated the effects of alternative treatments such as ERT, review studies, case reports of only a single patient, conference abstracts, non-English language studies, and in vitro and animal studies.
2. Search strategy
A systematic search was performed using keywords including MPS, BMT, and HSCT of the PubMed, Embase, Scopus, and Web of Science databases from inception through April 20, 2024. Only papers published in English were considered.
3. Selection process
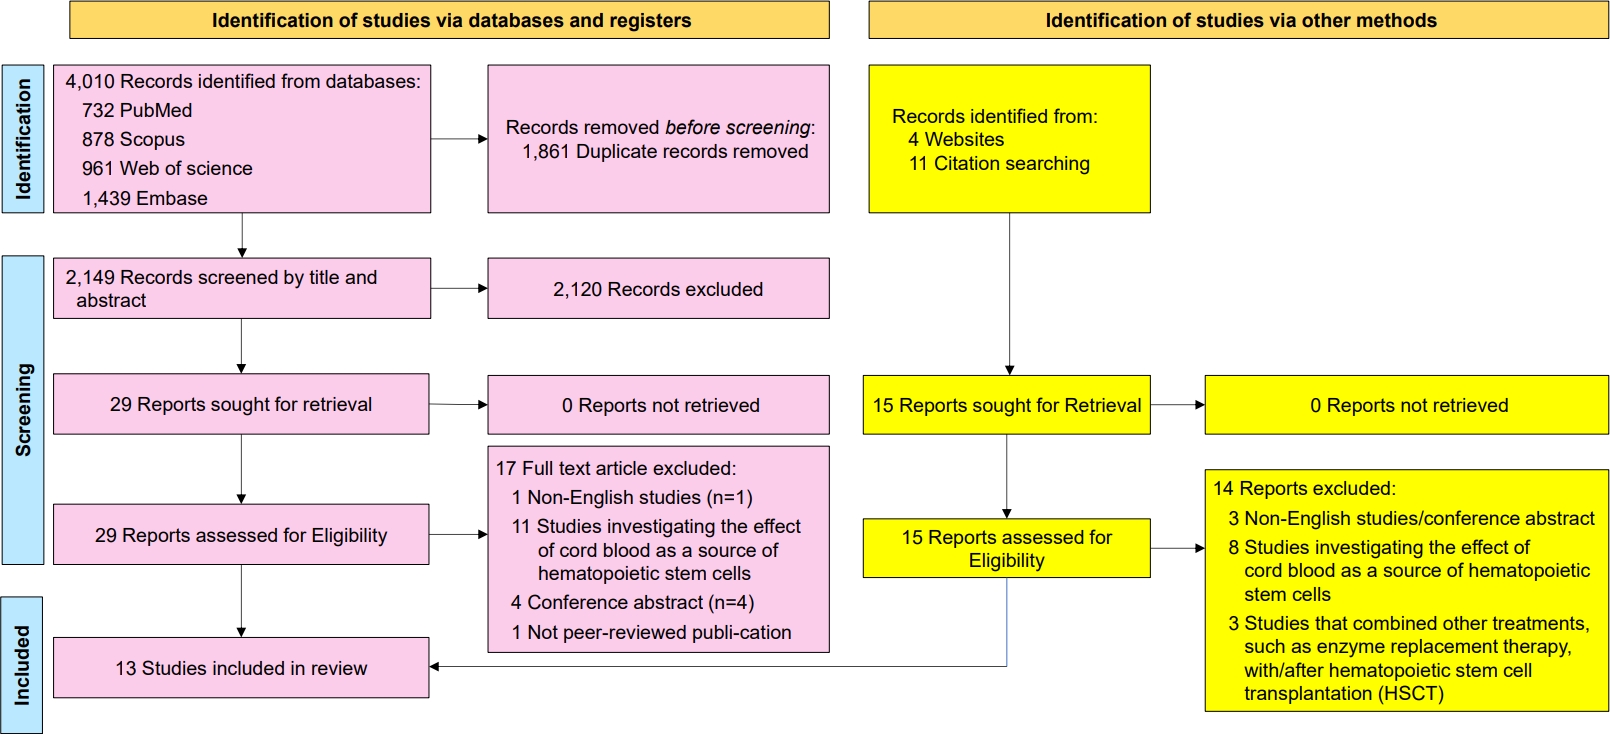
The researchers used Rayyan to organize and select eligible studies [15]. The retrieved studies were uploaded to https://www.rayyan.ai/ for screening. Based on predefined inclusion and exclusion criteria, AKH and RM independently reviewed each article at the title, abstract, and full-text levels. The review process was conducted blindly to minimize bias, and all decisions regarding article inclusion or exclusion were systematically logged into Rayyan to ensure transparency and reproducibility. After the initial screening, the studies underwent full-text screening and were included in the systematic review. In case of disagreement between the 2 authors, a third author (FA) expertly intervened to resolve the discrepancies and make a final decision. Fig. 1 presents an overview of the study selection process.
4. Data extraction
Two reviewers evaluated study quality and independently extracted relevant information from the included papers. The extracted data included the first author, publication year, country, study subjects, study design, sample size, sample characteristics, follow-up duration, and tools used to measure the outcomes. A detailed summary of the extracted data is presented in Table 1.
5. Risk of bias and study quality assessments
Study quality was assessed using the Newcastle-Ottawa Scale criteria for observational studies and the Joanna Briggs Institute checklist for case series. Two independent reviewers comprehensively evaluated the quality of each included study, while a third reviewer resolved any disagreements. Table 2 shows the quality appraisal results of the included studies.
Results
This review examined the impact of HSCT with primary focus on BMT on growth outcomes in pediatric patients diagnosed with different MPS subtypes. Although we intended to limit the analysis to studies that used BMT exclusively, some that included both BMT and cord blood cell transplantation were included because of their valuable BMT-specific results [16]. Comparisons were made between the pre- and post-HSCT growth records as well as between the treated and untreated groups to evaluate the impact of transplantation on these growth metrics. The primary growth outcomes included height, weight, body mass index (BMI), head circumference, and pubertal development.
1. Height
Among the included studies, 13 addressed height as the main growth index. Final height and height z scores were the most common types of measurements reported in previous studies.
1) Adult heights of patients with HSCT-treated MPS
Patel et al. [17] tracked 12 patients with MPS II who underwent HSCT at ≥8 years. Their growth trajectory mirrored that of untreated patients and healthy controls until 8 years of age. After this point, the treated group began to show increased height gains compared to the untreated patients, culminating in a mean 20-cm height difference by adulthood. However, despite this growth, they did not reach the same adult heights as the healthy controls.
In a cohort of 11 HSCT-treated patients with MPS type IH (MPS IH), the average adult height was 136.7±8.9 cm, with females averaging 135.2±9.3 cm and males 140.7±7.0 cm—both falling below the 3rd percentile of the healthy population. Similarly, a group of 6 MPS VI patients showed an average adult height of 121.8±10.8 cm for females and 130.6±17.9 cm for males. Among the 2 HSCT-treated patients with MPS VI, adult heights were 124.1 cm and 146 cm, while those not treated with HSCT had an average height of 124.0±16.1 cm [18]. In another study, 7 patients with MPS IH were followed into adulthood, with a median height of 137.5 cm for males versus 143.1 cm for females, both remaining below the standard height percentiles [19].
2) Height z scores and long-term growth patterns
Gardner et al. [19] examined the height z scores in 22 patients with MPS IH following HSCT. Over time, the median height z scores decreased, resulting in final height standard deviation score (SDS) values of -4.3 for boys and -3.4 for girls in the 7 patients that reached their final height. Similarly, a cohort of 44 patients with MPS IH noted that, before HSCT, the mean height SDS was 0.1±1.5, with 9% presenting short stature. By 10 years of age, the prevalence of short stature increased to 87%, with more pronounced growth decelerations in females [16]. Polgreen et al. [16] also reported that older age at the time of HSCT was linked to worse height outcomes. Notably, patients who underwent total body irradiation (TBI) were more prone to short stature (86% vs. 54%, P=0.009), although neither undergoing a second HSCT procedure nor sex significantly affected height outcomes.
Cattoni et al. [20] followed up 15 patients with MPS IH for 9 years after HSCT. The median height SDS decreased slightly by 60 months; however, this change was not statistically significant. In contrast, compared to patients with untreated MPS IH, the transplanted group demonstrated significant height improvements, with median height SDS increasing from -0.39 at baseline to +1.35 at 60 months (P<0.001). At the 9-year mark, compared to patients with untreated MPS IH, all HSCT-treated patients showed an average height SDS increase of +3.67 (±1.63) from their starting point (- 0.4±0.86, P<0.001), reflecting a significant height gain of 4.07 (±1.27) SDS from baseline. Despite this, 11 of the 14 patients had a decreased height SDS, while 3 either maintained the SDS or showed some improvement. By adulthood, 6 of 7 patients had short stature (<-2 SDS), with a final mean height SDS of -3.81 (P=0.048), indicating a significantly lower height than expected for their target height. Similarly, Vellodi et al. [21] found that, among 10 patients with MPS IH who underwent HSCT, the growth velocity was initially normal but gradually slowed over time, with patient heights dropping below the 3rd percentile by 5 years of age. This decline was almost entirely attributed to sitting height, indicating poor spinal growth.
3) Height and growth velocity across cohorts
Similarly, Maier et al. [22] tracked 14 patients with HSCT-treated MPS I and found that, although their birth lengths were comparable to those of healthy populations, their height z scores decreased sharply until 2 years of age, followed by a slower decline. Patients who underwent HSCT after age 2 years of age experienced a more significant reduction in height z scores than those treated earlier. The study reported an average body length SDS of -1.61 (range, -4.58 to 3.29), with height SDS decreasing further as the patients aged. Patients who received both matched unrelated donor (MUD) and related donor (RD) transplants showed a decline in growth, MUD recipients exhibited more balanced growth, and RD recipients showed a marked decline by 4 years of age.
Lund et al. [23] reported that a cohort of patients with HSCT-treated MPS IH (mean age, 8.0±2.9 years) exhibited a mean height z score of -2.4±1.2. At the same time, Miller et al. [18] documented a further decline in z scores to -2.9±1.5 by 9.3 years of age, indicating short stature in all 23 patients with MPS IH despite transplantation.
A larger study followed 217 patients with HSCT-treated MPS IH for a median 9.2 years and reported that post-HSCT growth was significantly below the standard growth curves beyond 10 years of age. The main determinant of short stature was a reduced sitting height, whereas leg length and arm span were relatively preserved [24].
Vellodi et al. [25] studied twin sisters with MPS IIIB who underwent BMT around 2 years of age. Both patients experienced decreased growth velocity fluctuating between the 3rd and 25th percentiles during childhood. However, their growth rates improved, reaching the 50th percentile by 10 years of age.
Cattoni et al. [20] reported significantly accelerated height velocity after HSCT, with the most substantial increase observed 24 months post-treatment. The average height velocity increased from - 0.84±1.79 SDS at HSCT commencement to -2.49±2.24 SDS at 24 months, demonstrating a statistically significant difference (P=0.049).
4) Growth hormone therapy in HSCT-treated patients
Many patients with various MPS types who experience restricted height growth are candidates for recombinant human growth hormone (rhGH) therapy combined with treatments such as HSCT and ERT.
In a study of 55 patients, 8 individuals with MPS IH underwent HSCT and rhGH for ≥2 years. However, no significant differences in height z scores were observed over time between patients treated with or without rhGH. Due to the lack of pretreatment growth data, the study could not determine whether individual growth outcomes improved with rhGH therapy [18].
In a study of 13 patients with HSCT-treated MPS IH (mean age, 9.8±3.1 years), 6 received rhGH for a mean 3.6±1.4 years. The height SDS change varied from -0.7 to 0.8 in those receiving rhGH to -0.7 to 0.3 in those not receiving rhGH. No significant intergroup differences were found in the growth velocity, height SDS, or upper-to-lower body ratio. Other factors such as prior TBI, peritransplant ERT, and age at the time of HSCT did not affect height outcomes in either group [26].
Cattoni et al. [27] reported 2 patients with MPS IH who began rhGH therapy 6 years after undergoing HSCT at 20 and 13 months of age. At the time of HSCT, their height SDS values were -2.68 and +1.35, values that worsened to -4.04 and -1.59 before starting rhGH, with a height velocity as low as 1.8 cm/year (-5.14 SDS). The first patient showed temporary improvements in growth velocity during the first year of rhGH treatment (5.2 cm/yr, -0.60 SDS) but only a modest SDS increase from -3.57 to -3.42. Owing to declining efficacy, the rhGH was discontinued after 2.9 years. The second patient experienced a significant growth velocity increase from 2.96 cm/yr (-3.44 SDS) to 9.97 cm/yr (+4.56 SDS) at 6 months and maintained stable growth until menarche at 10.1 years of age. The rhGH treatment was discontinued at 11 years of age because her annual height velocity decreased to <2 cm/yr.
In contrast, a different study of 8 HSCT-treated patients with MPS IH who received rhGH therapy showed some improvement compared to those who did not. Growth velocity increased from 3.5±1.5 cm/yr (-2.6±1.9 SDS) to 5.2±3.0 cm/yr (−0.1±3.6 SDS) after 1 year. Moreover, 4 patients (50%) experienced a growth velocity increase of ≥2 cm/yr. Although the baseline height SDS was -3.9±1.6, it remained stable at -3.7±2.0 after 1 year, with height increases ranging from 2.9 to 12.5 cm over 1 year [28].
2. Weight
Eight of the included studies discussed changes in weight and BMI in patients with HSCT-treated MPS. Weight gain was tracked before and after HSCT in a cohort of 14 children with MPS I. Untreated children exhibited disproportionate growth by 24 months with increasing weight and decreasing body length, both of which began to normalize after transplantation. Following HSCT, the mean weight SDS was -0.56 (range, -3.19 to 2.95), with significantly better outcomes in children who underwent transplantation before 2 years of age (P<0.04). However, those receiving HSCT from a RD experienced a decline in growth, including weight, around 4 years of age, highlighting the influence of donor type and timing on long-term outcomes [22].
In a larger cohort of 217 patients with MPS IH, weight and BMI improved significantly after HSCT. Pre-transplantation, both male and female patients experienced slower weight gain and lower BMI. Although weight was normalized for age in the post-transplantation period, BMI remained elevated with variable outcomes, suggesting an overall improvement in physical growth after HSCT, particularly when performed early in life [24].
Weight gain did not significantly differ in patients with HSCT-treated versus-untreated MPS II until 10 years of age. After this point, HSCT-treated patients were heavier than HSCT-untreated patients and age-matched healthy controls. By 12 years of age, untreated patients experienced a noticeable decrease in weight gain, resulting in a significantly lower weight than HSCT-treated patients [17].
The BMI z scores of patients with MPS IH remained relatively stable over time following HSCT. Miller et al. [18] examined 11 patients for a mean 8 years post-HSCT and determined a mean z score of 0.7±0.9. The median BMI percentile was 91.5%, with 18% classified as obese (BMI ≥30 kg/m²) and 64% falling within the overweight or obese range, indicating a high prevalence of elevated BMI despite HSCT.
A study of 8 patients with MPS IH (mean age, 9.6 years) reported a mean BMI of 20.5±3.4 kg/m² [28]. In another cohort of 14 patients with MPS IH who underwent HSCT at a mean age of 1.3±0.7 years, BMI was assessed at least 2.9 years post-HSCT. Despite treatment, the mean BMI z score was 0.7±0.9 (range, -0.5 to 1.9) [23]. Similarly, in a group of 13 patients with MPS I or II and a mean age of 10 years, the BMI percentile was 65%±20%, higher than the age-appropriate average [26].
In a cohort of 48 patients with MPS IH who underwent HSCT, BMI remained above the 50th percentile across all ages. Younger children (aged 0–4 years) had a mean BMI of 18.8±2.5 kg/m², which slightly declined in the 4–8 age group to 17.9±2.8 kg/m² but then increased to 20.7±4.8 kg/m² in the 12–18 years age group. Despite slow height growth, this increase in BMI suggests a growing disparity between weight and height [16].
In a long-term study, HSCT initially improved weight and BMI in patients with MPS IH, with a median BMI SDS of +2.2 at 2 years posttransplant. However, weight deficits emerged by 6–12 years of age; by 10 years, the median BMI SDS dropped to -0.04, reflecting a shift toward below-average BMI compared to the general population [19].
For patients with MPS II, BMI remained comparable between HSCT-treated and -untreated patients until 10 years of age, after which point it stabilized and decreased slightly, indicating more balanced growth in treated versus untreated patients and alignment closer to that of healthy controls [17].
3. Head circumference
Three studies examined head circumference in children with MPS I, whereas none examined head circumference in children with other MPS types.
In patients with MPS IH, an enlarged head circumference is common prior to HSCT. Aldenhoven et al. [24] found that while patients had enlarged head circumferences pre-HSCT, head growth slowed thereafter and followed a more typical trajectory, suggesting that HSCT helps normalize head growth over time.
Maier et al. [22] reported that the head circumference SDS of 14 patients with MPS I was normal at birth but increased at 6–24 months but body length and weight lagged. Post-HSCT, the head circumference SDS normalized (mean, 0.91). Notably, patients receiving MUD transplants experienced less disproportionate head growth than those receiving RD. Additionally, the earlier receipt of HSCT (prior to 2 years of age) improved head growth control, leading to faster SDS stabilization and reduced head enlargement.
In another study, most patients with MPS I presented with macrocephaly at the time of BMT. Posttransplantation, their head circumference growth either slowed significantly or stopped altogether. While the head circumferences of 2 patients returned to normal, those of the remaining 19 patients remained enlarged, although the degree of disproportion was notably reduced [21].
4. Pubertal progress
Pubertal development in patients with MPS after HSCT was examined in 5 separate studies, each of which examined different aspects of puberty. Collectively, these findings provide valuable insight into the overall progression of puberty in these patients.
In a study by Miller et al. [18], delayed puberty was not observed in any patients with MPS IH. Bone age closely aligned with chronological age (r=0.94), indicating normal pubertal progression, although this was not consistently reflected in epiphyseal plate closure.
Lund et al. [23] examined 14 patients with MPS IH who received HSCT at a mean age of 1.3±0.7 years and reported a mean bone age of 7.6±3.6 years but a mean chronological age of 8.0±2.9 years (range, 5.0–12.4 years), suggesting overall alignment with the expected developmental timeline for these patients.
In a cohort of 22 patients with MPS IH, 11 reached puberty. All patients progressed through puberty within the normal age range, although 2 females experienced pubertal arrest and required estrogen therapy to complete their development [19].
In a cohort of 45 patients with MPS IH, 19% exhibited normal pubertal development. One patient was diagnosed with precocious puberty at 7 years and 11 months of age (Tanner stage P3B3), while another was diagnosed at 7 years and 7 months, showing elevated estradiol and luteinizing hormone levels. Two additional patients showed biochemical signs of asymptomatic precocious puberty. No cases of delayed puberty, hypogonadism, or gonadal failure were observed, although the majority of patients (48%) remained prepubertal and 19% were of pubertal age but had no signs of puberty [16].
A case study described divergent pubertal development in 10-year-old twins with HSCT-treated MPS type IIIB. Twin 1 exhibited normal breast development and began menstruating at 10 years of age, whereas twin 2 remained at Tanner stage 2 breast development with no pubic hair or onset of menstruation [25].
Discussion
HSCT, particularly BMT, has emerged as a key treatment for MPS, especially more severe types such as MPS I, II, and VI. HSCT provides donor-derived enzyme activity, which reduces the accumulation of GAG and the debilitating symptoms of MPS. However, findings of the effects of HSCT on growth parameters, including height, weight, and pubertal development, have been inconsistent, raising concerns regarding long-term patient management.
HSCT can positively affect patient growth, especially when initiated early. Patel et al. [17] highlighted that MPS II patients with MPS II treated with HSCT at <8 years of age experienced increased height gains compared with untreated individuals, leading to a mean 20-cm height difference by adulthood. However, despite these improvements, treated patients often fail to reach the standard adult height compared with their healthy peers. Accordingly, despite effectively slowing disease progression, HSCT does not entirely normalize growth parameters [20,24]. Similarly, patients with HSCT-treated MPS IH or VI reached adult heights that were significantly below the 3rd percentile, emphasizing the persistent issue of short stature in these populations despite early intervention [18,20].
The timing of HSCT is critical in determining growth outcomes; however, evidence is conflicting. Previous studies demonstrated that earlier transplantation, particularly before 2 years of age, is associated with better long-term growth outcomes. Patients who underwent HSCT later in the study exhibited a more noticeable decline in height z scores, indicating that early intervention may help patients with MPS maintain their growth potential. Despite early HSCT, many patients experience declining height z scores as they age, with pronounced short stature during adolescence [19]. Polegreen et al. [16] found better height outcomes with younger age at transplantation. However, a further study by Polegreen et al. [26] reported no significant effect of age at transplantation on height outcomes among patients treated with HSCT or rhGH. This variation in findings indicates that multiple factors, including age at transplantation, donor type, and TBI, likely interact to influence growth outcomes [16,22]. More investigations are needed to clarify how HSCT protocols, including conditioning regimens and donor sources, affect long-term growth among MPS patients.
Moreover, although rhGH therapy is a possible adjunct to HSCT, its effect on height z scores remains limited. Some studies observed growth velocity improvements following rhGH therapy; however, the final adult heights remained below the standard percentiles. Cattoni et al. [27] noted a temporary increase in growth velocity during the first year of rhGH therapy, but long-term improvements were minimal. Similarly, Polegreen et al. [26] reported no significant differences in final height outcomes between patients treated with versus without rhGH therapy, suggesting that rhGH provides only a short-term boost without resolving long-term height deficits in patients with MPS.
HSCT positively affected weight and BMI, particularly in patients with MPS IH or II. Studies have consistently reported post-transplantation weight gain and BMI improvements, mainly when performed at a younger age [22,24]. However, variability in BMI outcomes, particularly among older patients, suggests that, although HSCT helps normalize growth, weight gain can become disproportionate over time, raising concerns about overweight or obesity in adolescence [16,18].
Although HSCT improves weight and BMI, head circumference remains a concern. An enlarged head circumference is frequently observed before HSCT, while HSCT helps slow or normalize growth over time [23]. Better control is achieved with earlier transplantation and MUD than with RD [23]. However, many patients still show disproportionately large head circumferences post-HSCT, with reduced but not fully resolved macrocephaly [21].
Studies of pubertal development after HSCT in patients with MPS have shown mixed results. Although most patients show normal pubertal progression, isolated cases of precocious puberty or pubertal arrest have been reported, especially in females [16,19,28]. Bone age generally aligns with chronological age, indicating that pubertal development follows expected timelines; however, some patients exhibit delayed epiphyseal plate closure [18,23].
In conclusion, HSCT shows promise for improving growth outcomes, including height, weight, and BMI, among patients with MPS. However, long-term growth challenges such as short stature, disproportionate weight gain, and incomplete resolution of macrocephaly persist. These findings underscore the need for long-term post-HSCT monitoring of growth and pubertal progression in patients with MPS. Despite early intervention, their growth parameters may continue to diverge from those of their healthy peers. Thus, the role of healthcare professionals in MPS treatment is crucial to ensure that patients receive the support they need as they navigate growth and developmental challenges. The heterogeneity of the studies included herein prevented us from estimating the effect sizes. Future research should prioritize standardized designs and consistent reporting to facilitate a reliable quantitative synthesis. Such efforts will help elucidate the impact of HSCT on the growth outcomes of patients with MPS.
 PDF Links
 PubReader
 ePub Link
 PubMed
 Download Citation


