Warning: fopen(/home/virtual/pediatrics/journal/upload/ip_log/ip_log_2024-03.txt) [function.fopen]: failed to open stream: Permission denied in /home/virtual/pediatrics/journal/ip_info/view_data.php on line 82

Warning: fwrite(): supplied argument is not a valid stream resource in /home/virtual/pediatrics/journal/ip_info/view_data.php on line 83
Association between maternal weight gain during pregnancy and child’s body mass index at preschool age

Volume 66(2); February

< Previous     Next >

Article Contents

Clin Exp Pediatr > Volume 66(2); 2023
Shin, Kwon, Kim, and Jeong: Association between maternal weight gain during pregnancy and child’s body mass index at preschool age

Abstract

Background

Recent studies reported that prepregnancy body mass index (BMI) and weight gain during pregnancy affect birth weight and contribute to childhood obesity. However, no such data are available in Korea.

Purpose

This study gathered data on weight gain during pregnancy and its impact on birth weight and childhood obesity in Korea.

Methods

We reviewed 1,753 singleton full-term babies born at CHA Bundang Medical Center in 2014–2016. We first review each maternal and baby factor based on prepregnancy BMI (underweight, normal, overweight/obese) and then divided them into low, normal, and excess gestational weight gain (GWG) groups based on the American Institute of Medicine (IOM) guidelines. We reviewed the characteristics of each group and analyzed the association between maternal GWG based on IOM guidelines and child BMI after 6 years.

Results

The maternal prepregnancy BMI group showed a significant difference in birth weight and child BMI at 6 years. As the prepregnancy BMI increased, the birth weight and BMI at 6 years also increased (P<0.001). Mean birth weight and child BMI at 6 years differed significantly among the GWG groups. Furthermore, excess postpartum weight gain increased the risk of childhood overweight and obesity (odds ratio, 2.21; 95% confidence interval, 1.40–3.49).

Conclusion

Excess weight gain during pregnancy should be avoided due to its short- and long-term association with childhood obesity. Owing to the high prevalence of excess GWG and childhood obesity, excess weight gain during pregnancy can have significant public health implications.

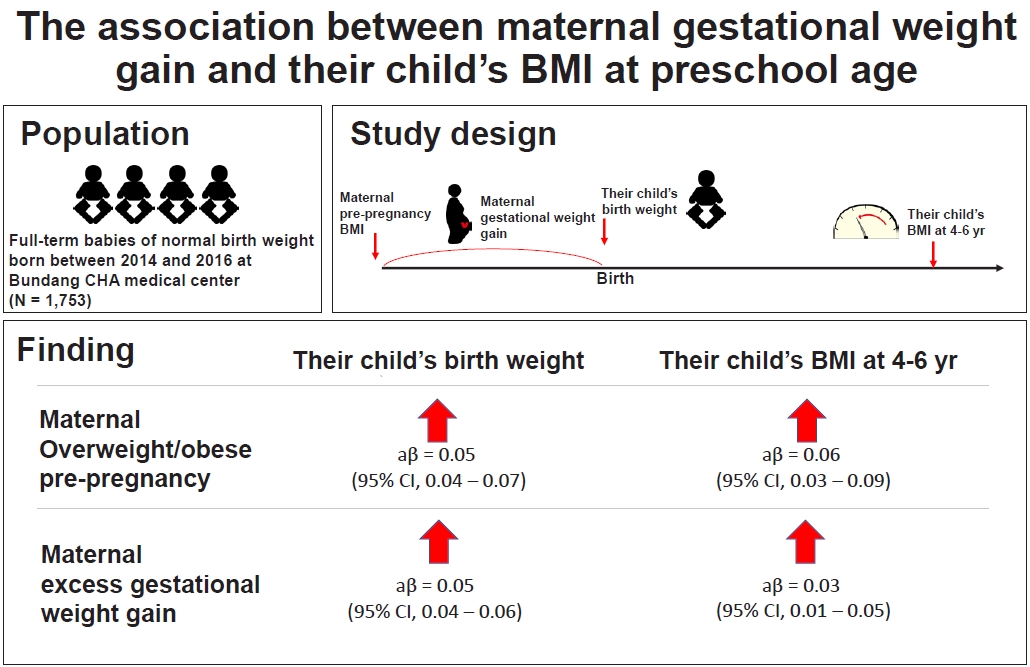
Graphical abstract. BMI, body mass index; CI, confidence interval.

Introduction

Globally, the prevalence of overweight and obesity in childhood and adulthood is increasing. Hence, further research is needed to understand the origins and the critical time periods that could increase the risk of obesity and adverse health outcomes later in life. Over the many years in America, overweight and obesity rates in women of reproductive age have increased rapidly [1]. The prevalence of overweight and obesity before pregnancy among women who gave birth increased from 23.2% in 1993–1994 to 44.8% in 2009 [2,3]. Another important issue for pregnant women is that excessive pregnancy weight gain is becoming more common among women with high prepregnancy body mass index (BMI) [4].
Evidence shows that maternal overweight and obesity have long-term health consequences on the offspring’s later health. These associations are stronger with maternal than paternal obesity, suggesting that they cannot solely be explained by a common genetic background. Maternal and fetal well-being is directly coupled. The optimal fetal growth is influenced by several factors. These factors control the fetal metabolic signaling pathways and guide “fetal programming” through an intricate mechanism. Recent studies suggest that “fetal origin” effects can be extended to a wider range of lifelong outcomes, particularly poor health at birth is a major pathway by which insufficient or excessive nutritional intake exerts lasting effects during fetal development [5,6]. This study will shed new light on such a pathway since GWG is a good measure of nutrition in utero and both high birth weight and low birth weight are the crucial indicators of poor infant health.
Many studies have shown that both prepregnancy BMI and GWG are the 2 key determinants of infant health [7]. There is a growing association between prepregnancy BMI and large gestational age (LGA) outcomes which have also been observed in other studies. Furthermore, BMI>85th percentile at birth is independently associated with being overweight at 4 years [8]. Newborn overweight is perhaps superior to newborn macrosomia in predicting overweight at age 4. This suggests that early ‘adiposity rebound’ may lead to adult obesity. We want to know that an LGA newborn of obese mothers has the potential to track into later life and confer negative effects on their future body composition and, thus, metabolic health.
So firstly, we intended to evaluate the effects of prepregnancy BMI and GWG on the infant’s birth weight. Secondly, we wanted to investigate such programming using the body composition data from birth and at ages 4–6 of Korean children born to obese mothers.

Methods

1. Study population

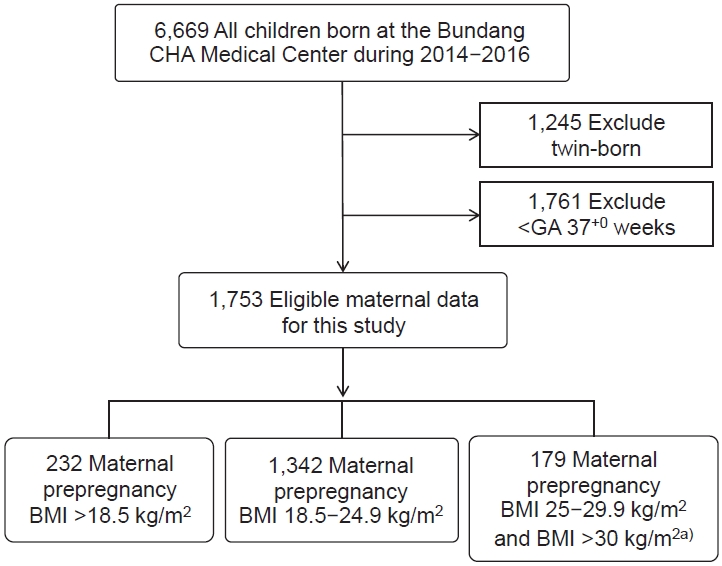
We reviewed the data of 6,669 babies born at the Bundang CHA Medical Center from January 2014 to December 2016. We excluded 1,761 preterm babies (under gestational age [GA], 37+0 weeks) and 1,245 twin babies from the study. We collected the medical data of 1,753 normal singleton and full-term babies eligible for this study (Fig. 1). We obtained information about the maternal and baby factors via electronic medical records. For the maternal factors, we collected age, weight before the pregnancy, total weight gain during the pregnancy, height, and BMI before and after the pregnancy. Prepregnancy weight and height were self-reported by mothers, and during pregnancy, body measurements were taken on the first day of pregnancy and the day of delivery at the hospital. We collected the birth weight and height, infant sex, and the delivery method for the baby factors. Furthermore, out of 1,753 babies, we confirmed a BMI of 473 at ages 4–6 years during their vaccination visit.

2. Measurements

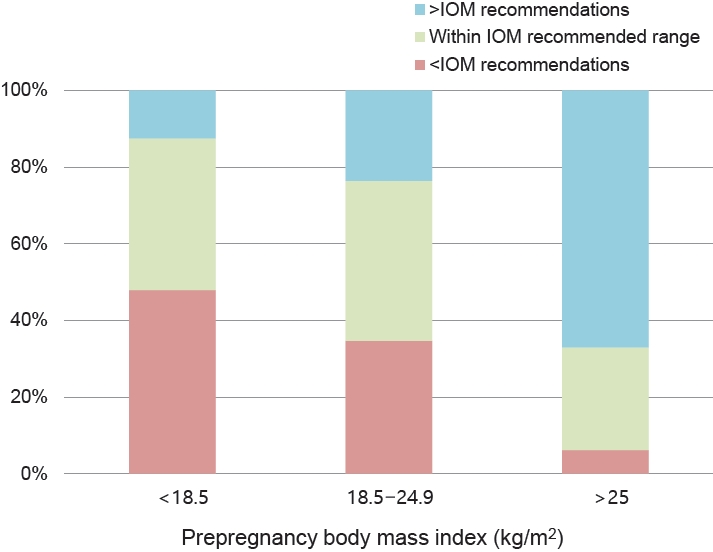
We used the prepregnancy weight and height self-reported by mothers to calculate the BMI (kg/m2). We categorized it according to the World Health Organization guidelines [9] as group 1: underweight (BMI<18.5 kg/m2), group 2: normal weight (BMI 18.5–24.9 kg/m2), group 3: overweight (BMI 25.0–29.9 kg/m2) and obese (BMI≥30 kg/m2) (Fig. 2). The weight at delivery was measured at the hospital and used to calculate the GWG by subtracting it from woman’s prepregnancy weight. For further statistical evaluations, we combined the overweight and the obese groups due to the small sample size in the obese group. The proper GWG for underweight, normal weight, overweight and obese women is 12.5–18 kg, 11.5–16 kg, 7–11.5 kg, and 5–9 kg, respectively, based on the American Institute of Medicine (IOM) recommendations [10]. We divided them into 3 groups based on gestational weight gain specified in the IOM guidelines: low GWG, normal GWG, and excess GWG (Fig. 2).

3. Statistical analysis

The data are presented as mean, standard deviation, number, and rate (%). The chi-square test conducted comparisons of mean values of the categorical variables. The Kruskal-Wallis test was performed to show the relationship between prepregnancy BMI, maternal factors, and birth height. We used the Mann-Whitney test for post hoc analysis as the data showed nonnormal distribution. We used analysis of variance analysis for normal distribution variables to find the association between the prepregnancy BMI group and the birth weight and childhood BMI. The Bonferroni test was used for post hoc analysis. Furthermore, we used linear regression with log gamma function to calculate beta coefficients (β) and 95% confidence intervals (CIs) and odds ratio (OR) to describe the association between the prepregnancy maternal BMI, GWG, birth weight, and BMI at age 4–6. Adjusted β (aβ) were calculated to describe the relative risk and adjusted for GA (day), sex, maternal height, and birth weight. All analyses were performed using IBM SPSS Statistics ver. 26.0 (IBM Co., Armonk, NY, USA). In this study, probability (P)≤0.05 (2-sided) was considered statistically significant.

Results

1. Baseline characteristics

In this study, we had data from 1,753 mothers and newborn infants and 473 4–6-years-old children. Table 1 shows the different characteristics of a maternal and newborn infant by the prepregnancy BMI status. In the underweight, normal, and overweight/obese groups, the median prepregnancy BMI was 17.65±0.72, 21.02±1.63, and 28.19±2.93 kg/m2 (P<0.001), respectively, and the average birth weight was 3.08±0.35 kg, 3.19±0.37 kg, 3.33±0.39 kg (P<0.05), respectively. Both of these things in each group showed statistically significant differences. There was no significant difference in the infant sex (P=0.971) between the 3 groups. However, the ratio of cesarean section (c/sec) delivery was significantly higher than normal spontaneous vaginal delivery, which showed a statistical difference in group 3 (P<0.001).

2. Maternal prepregnancy BMI vs. 4–6-years BMI

Table 2 shows the correlation between the maternal prepregnancy BMI and the child’s BMI at 4–6-year-old as well as the newborn infants’ birth weight. As the mother’s prepregnancy BMI increases, the infants’ birth weight increased (aβ=0.054; 95% CI, 0.037–0.072; P<0.001). BMI at 4–6-year-old also showed a positive correlation with the prepregnancy maternal BMI (aβ=0.059; 95% CI, 0.031-0.087; P<0.001).

3. Maternal GWG vs. newborn birthweight and 4–6-year-old BMI

The association between birthweight and BMI at 4–6 years of age and GWG based on the IOM guidelines are demonstrated in Table 3. Maternal weight gain during pregnancy shows a relationship between birthweight and BMI at age 4–6 years. Indeed, our data showed a relationship between GWG and birthweight and BMI at 4–6 years of age. GWG based on the IOM guidelines and the birthweight significantly increased in the excess GWG group than in the low and the normal GWG groups (aβ=0.050; 95% CI, 0.036–0.064; P<0.001). Also, the BMI at 4–6 year of age also showed the relationship with the excess GWG group (aβ=0.025; 95% CI, 0.005–0.045; P<0.015) (Table 3). The proportion of 4–6-year-old overweight/obese children showed the highest value in the excess GWG group and was statistically significant. After correcting for confounding variables such as GA (day), sex, maternal height, prepregnancy BMI, and birthweight, the overweight/obese ratio of children 4–6 years of age was statistically significantly higher in the excess GWG group (aOR 1.77; 95% CI, 1.09–2.88; P<0.021) (Table 4).

Discussion

Our study examined the associations between the maternal prepregnancy BMI and the infant’s weight at birth or the child’s BMI in childhood and between the maternal GWG and the infant birthweight or their child’s BMI in childhood. As the prepregnancy BMI increases, the birth weight significantly increases, even after adjusting for confounding factors. Furthermore, this study investigated the effect of the maternal prepregnancy BMI and GWG on the BMI at 4–6 years of age when the early adiposity rebound occurs. The overweight/obese children ratio in the excess GWG group was higher than in the low and normal GWG groups.
Worldwide, the prevalence of excessive gestational weight gain in women has increased, and much research about weight gain during prepregnancy increases body fat and birth weight [11-13]. Zhao et al. [13] found that overweight and obese women had a higher risk of developing macrosomia and LGA compared to women with normal weight. Nehab et al. [14] also found that children of mothers who gained excessive weight during pregnancy had increased body fat and birth weight. There have not been many studies about the relationship between weight gain during pregnancy and the child’s weight at 4–6 years when an early adiposity rebound occurs. So, in this paper, we tried to confirm that weight gain during pregnancy is associated with BMI at 4–6-year-old.
Several studies have linked fetal macrosomia with a higher risk of developing type 2 diabetes mellitus, obesity, and metabolic syndrome in childhood or adulthood, perpetuating this cycle in the next generation. Increasing maternal glucose and free fatty acids levels are related to maternal overweight and obesity proposed by the overnutrition hypothesis [15,16]. This may lead to permanent fetal body composition changes, in the long run, increasing the risk of obesity-related health outcomes later in the future [17]. Maternal body size closely relates to the infant’s birth size and also reflects maternal nutritional status long term [18].
Our study shows a relationship between the delivery mode and prepregnancy BMI. This demonstrates that the larger the baby higher the chance of being born by c/sec, which is consistent with previous studies. In a recent study from the United Arab Emirates, the prevalence of c/sec delivery (OR, 2.3) was higher in birth weight, more than 4,000 g (OR, 3.9) [19]. Sebire et al. [20] showed that the c/sec delivery rate in the very obese group was more than 20%, whereas it was only close to 10% in the normal weight group. Rutayisire et al. [21] reported the chance of overweight (OR, 1.24; 95% CI, 1.07–1.44; P=0.003), and obesity (OR, 1.29; 95% CI, 1.13–1.49); P<0.001) was remarkably related to c/sec in preschool children. In other words, as the mothers’ BMI increases, the possibility of c/sec increases, and c/sec affects childhood obesity as an independent factor; it may be predicted that the mother’s weight gain is the most important factor in preventing childhood obesity.
Sex differences in body weight and body fat development at a young age have been shown in previous studies [22,23]. Eriksson et al. [18] confirmed that a higher percentage of body fat in adulthood is associated with a higher birth weight in men born in women with high maternal BMI. However, Voerman et al. [24] studies did not reveal gender differences; this is maybe because fat and lean mass are not distinguished by BMI. Further studies on the causal relationship and underlying mechanisms of these relationships are needed [25].
As a result of this study, it was statistically confirmed that the maternal age increased as the prepregnancy BMI increased. It should be considered that the number of elderly mothers in Korea is recently increasing, which is also an important risk factor for childhood obesity in the future.
The present study has several limitations. First, the sample size of 4–6-year-old was relatively small either due to loss of follow-up after birth or because the child’s body weight data was missing. Second, the prepregnancy weight and height were self-reported, producing recall error and leading either to underestimation or overestimation of GWG. Third, it was a single-center study; hence the results may only represent Bundang CHA Medical Center. And finally, we did not consider gestational diabetes and other maternal medical issues which may affect the fetus. The strength of this study is that it was a long-term longitudinal study, and the sample size of the newborn baby was large.
In this study, we confirmed that the prepregnancy BMI and the maternal weight gain during the pregnancy affect the birth weight and the BMI at 4–6 years of age. GWG increases the risk of later childhood overweight or obesity at ages 4–6. Overall, it is worth noting that excess GWG may significantly impact public health due to the prevalence of obesity in children.

Acknowledgments

The authors are grateful to all participants in this study. We also thank the Department of Pediatrics, Bundang CHA Medical Center, for help with testing our study participants.

Footnotes

Conflicts of interest

No potential conflict of interest relevant to this article was reported.

Author contribution

Conceptualization: SJJ; Formal Analysis: JS, YK; Investigation: JS, YK, JHK; Methodology: JS, JHK; Project Administration: JS, SJJ; Writing – Original Draft: JS; Writing – Review & Editing: YK, JHK, SJJ

Fig. 1.
Schema of participant selection process. BMI, body mass index; GA, gestational age (weeks). a)BMI 25–29.9 kg/m2 and BMI >30 kg/m2 groups combined.
cep-2022-01158f1.jpg
Fig. 2.
Percentage of women in each body mass index class based on the American Institute of Medicine (IOM) gestational weight gain category.
cep-2022-01158f2.jpg
cep-2022-01158f3.jpg
Table 1.
Characteristics and maternal prepregnancy BMI status of total study population
Characteristic Total study population (n=1,753) Prepregnancy BMI status
P value
Underweight (Group 1)a) (n=232) Normal (Group 2)a) (n=1,342) Overweight/obese (Group 3)a) (n=179)
Maternal factors
Gestational age (day) 272.34±7.23 272.09±7.13 272.62±7.17 270.61±7.55 0.001b)
Maternal age (yr) 33.85±3.81 33.09±3.88 33.84±3.70 34.95±4.28 <0.001b)
Weight before the pregnancy (kg) 55.76±8.64 46.47±3.48 54.98±5.13 73.69±8.97 <0.001b)
Total weight gain (kg) 13.44±4.50 13.19±4.51 13.52±4.48 13.12±4.62 0.178b)
BMI before the pregnancy (kg/m2) 21.31±3.10 17.65±0.72 21.02±1.63 28.19±2.93 <0.001b)
Height (cm) 161.72±4.89 162.18±5.43 161.66±4.77 161.59±5.02 0.515b)
Baby factors
Birth weight (kg) 3.19±0.37 3.08±0.35 3.19±0.37 3.33±0.39 <0.001c)
Birth height (cm) 49.32±10.99 48.77±1.75 49.41±12.51 49.32±2.21 0.005b)
Infant sex 0.971d)
Male 913 (52.08) 120 (51.72) 701 (52.23) 92 (51.39)
Female 840 (47.91) 112 (48.72) 641 (47.76) 87 (48.60)
Delivery method <0.001d)
NSVD 970 (55.33) 138 (59.48) 757 (56.40) 75 (41.89)
Cesarean section 783 (44.66) 94 (40.51) 585 (43.59) 104 (58.10)

Values are presented as mean±standard deviation or number (%).

BMI, body mass index; NSVD, normal spontaneous vaginal delivery.

a) Underweight: prepregnancy BMI >18.5 kg/m2; normal: prepregnancy BMI 18.5–24.9 kg/m2; overweight/obese: prepregnancy BMI 25–29.9 kg/m2 or prepregnancy BMI >30 kg/m2.

b) Differences among groups were analyzed using the Kruskal-Wallis test. Thus, any relationship between 2 of the 3 groups was significant.

c) Intergroup differences were analyzed using analysis of variance; thus, any relationship between 2 of the 3 groups was significant.

d) Intergroup differences were analyzed using the chi-square test.

Boldface indicates a statistically significant difference with P<0.05.

Table 2.
Association between maternal prepregnancy BMI and child’s BMI at 4–6 years (N=1,753)
Prepregnancy maternal BMI Birthweight
Mean (95% CI) (kg) P valued) Crude β (95% CI)e) P value Adjusted β (95% CI)e,f) P value
Underweight (n=232)a) 3.08 (3.03–3.12) -0.037 (-0.053 to -0.020) <0.001 -0.036 (-0.051 to -0.021) <0.001
Normal (n=1,342)b) 3.19 (3.17–3.21) 0.001h) Ref Ref
Overweight/Obese (n=179)c) 3.33 (3.27–3.39) 0.042 (0.024–0.061) <0.001 0.054 (0.037–0.072) <0.001
Prepregnancy maternal BMI BMI in childhood (4–6 yr old)
Mean (95% CI) (kg/m2) P valued) Crude β (95% CI)e) P value Adjusted β (95% CI)e,g) P value
Underweight (n=116)a) 15.74 (15.45–16.03) -0.049 (-0.075 to -0.023) <0.001 -0.041 (-0.066 to -0.015) <0.002
Normal (n=267)b) 16.52 (16.28–16.78) <0.001h) Ref Ref
Overweight/Obese (n=89)c) 17.69 (17.19–18.18) 0.068 (0.039–0.096) <0.001 0.059 (0.031–0.087) <0.001

BMI, body mass index; CI, confidence interval.

a) Underweight: prepregnancy BMI >18.5 kg/m2.

b) Normal: prepregnancy BMI of 18.5–24.9 kg/m2.

c) Overweight/obesity: prepregnancy BMI of 25–29.9 kg/m2 or prepregnancy BMI >30 kg/m2.

d) Intergroup differences were analyzed using analysis of variance. Thus, any relationship between 2 of the 3 groups was significant.

e) β and 95% CI values were calculated using generalized linear regression with a log gamma function.

f) Adjusted for gestational age (days), sex, and maternal height.

g) Adjusted for gestational age (days), sex, maternal height, and birth weight.

h) Using the Bonferroni test for the post hoc analysis, all intergroup differences were statistically significant.

Boldface indicates a statistically significant difference with P<0.05.

Table 3.
Association between weight gain during pregnancy, birth weight, and child’s BMI at 4–6 years
Wight gain during the pregnancy Birth weight (n=1,753)
Mean (95% CI) (kg) P valuea) Crude β (95% CI)b) P value Adjusted β (95% CI)b,c) P value
Low GWG (n=587) 3.09 (3.06–3.12) -0.037 (-0.050 to -0.024) <0.001 -0.027 (-0.039 to -0.015) <0.001
Normal GWG (n=700) 3.21 (3.18–3.24) <0.001d) Ref Ref
Excess GWG (n=466) 3.31 (3.28–3.35) 0.068 (0.054–0.083) <0.001 0.050 (0.036–0.064) <0.001
Weight gain during the pregnancy BMI in childhood (4–6 yr old)
Mean (95% CI) (kg/m2) P valuea) Crude β (95% CI)b), P value Adjusted β (95% CI)b,c) P value
Low GWG (n=129) 15.60 (15.25–15.95) -0.52 (-0.077 to -0.026) <0.001 -0.035 (-0.057 to -0.013) 0.002
Normal GWG (n=199) 16.43 (16.15–16.71) <0.001d) Ref Ref
Excess GWG (n=144) 17.58 (17.25–17.91) 0.068 (0.043–0.092) <0.001 0.025 (0.005–0.045) 0.015

BMI, body mass index; CI, confidence interval; GWG, gestational weight gain.

a) Differences among groups were analyzed using analysis of variance. Thus, any relationship between 2 of the 3 groups was significant.

b) β and their 95% CI were calculated using generalized linear regression with a log gamma function.

c) Adjustment for gestational age (days), sex, maternal height, and prepregnancy BMI.

d) The Bonferroni test was used for the post hoc analysis; therefore, all differences among groups were statistically significant.

Boldface indicates a statistically significant difference with P<0.05.

Table 4.
Association between weight at age 4–6 years and maternal gestational weight gain based on Institute of Medicine (IOM) guidelines
Wight gain during the pregnancy Overweight/obese in childhood (4–6 yr old)
No. (%) OR (95% CI)b), P value aOR (95% CI)b,c), P value
Low GWG (n=129) 21 (16.3) 0.55 (0.32–0.97), 0.04 0.54 (0.29–0.99), 0.047
Normal GWG (n=200) 52 (26.0) Ref Ref
Excess GWG (n=144) 63 (46.8) 2.21 (1.40–3.49), 0.001 1.77 (1.09–2.88), 0.021

OR, odds ratio; aOR, adjusted OR; CI, confidence interval; GWG, gestational weight gain; BMI, body mass index.

a) Overweight and obesity were defined as a BMI (kg/m2) >85th percentile.

b) OR and 95% CI were calculated using binary logistic regression.

c) Adjustment for gestational age (days), sex, maternal height, prepregnancy BMI, and birth weight.

References

1. National Center for Health S. Health, United States. Health, United States, 2013: with special feature on prescription drugs. Hyattsville (MD): National Center for Health Statistics (US), 2014.

2. Fisher SC, Kim SY, Sharma AJ, Rochat R, Morrow B. Is obesity still increasing among pregnant women? Prepregnancy obesity trends in 20 states, 2003-2009. Prev Med 2013;56:372–8.
crossref pmid pmc
3. Kim SY, Dietz PM, England L, Morrow B, Callaghan WM. Trends in prepregnancy obesity in nine states, 1993-2003. Obesity (Silver Spring) 2007;15:986–93.
crossref pmid
4. Frederick IO, Williams MA, Sales AE, Martin DP, Killien M. Prepregnancy body mass index, gestational weight gain, and other maternal characteristics in relation to infant birth weight. Matern Child Health J 2008;12:557–67.
crossref pmid pdf
5. Almond D, Chay KY, Lee DS. The costs of low birth weight. Q J Econ 2005;120:1031–83.
crossref
6. Currie J, Hyson R. Is the impact of health shocks cushioned by socioeconomic status? The case of low birthweight. Am Econ Rev 1999;89:245–50.
crossref
7. Sun Y, Shen Z, Zhan Y, Wang Y, Ma S, Zhang S, et al. Effects of prepregnancy body mass index and gestational weight gain on maternal and infant complications. BMC Pregnancy Childbirth 2020;20:390.
crossref pmid pmc pdf
8. Winter JD, Taylor Y, Mowrer L, Winter KM, Dulin MF. BMI at birth and overweight at age four. Obes Res Clin Pract 2017;11:151–7.
crossref pmid
9. Institute of Medicine National Research Council Committee to Reexamine IOM Pregnancy Weight Guidelines. Weight gain during pregnancy: reexamining the guidelines. Washington (DC): National Academies Press, 2009.

10. World Health Organization. Geneva (Switzerland): World Health Organization; c2022 [cited 2019 Jan 17] Available from: https://www.who.int/data/gho/data/themes/topics/topicdetails/GHO/body-mass-index.

11. Goldstein RF, Abell SK, Ranasinha S, Misso M, Boyle JA, Black MH, et al. Association of gestational weight gain with maternal and infant outcomes: a systematic review and meta-analysis. JAMA 2017;317:2207–25.
crossref pmid pmc
12. Josey MJ, McCullough LE, Hoyo C, Williams-DeVane C. Overall gestational weight gain mediates the relationship between maternal and child obesity. BMC Public Health 2019;19:1062.
crossref pmid pmc pdf
13. Zhao R, Xu L, Wu ML, Huang SH, Cao XJ. Maternal prepregnancy body mass index, gestational weight gain influence birth weight. Women Birth 2018;31:e20–5.
crossref pmid
14. Nehab SR, Villela LD, Soares FVM, Abranches AD, Araújo DMR, da Silva LML, et al. Gestational weight gain and body composition of fullterm newborns and infants: a cohort study. BMC Pregnancy Childbirth 2020;20:474.
crossref pmid pmc pdf
15. Catalano Pa, Ehrenberg H. The short-and long-term implications of maternal obesity on the mother and her offspring. BJOG 2006;113:1126–33.
crossref pmid
16. Sewell MF, Huston-Presley L, Super DM, Catalano P. Increased neonatal fat mass, not lean body mass, is associated with maternal obesity. Am J Obstet Gynecol 2006;195:1100–3.
crossref pmid
17. Freeman DJ. Effects of maternal obesity on fetal growth and body composition: implications for programming and future health. Semin Fetal Neonatal Med 2010;15:113–8.
crossref pmid
18. Eriksson JG, Sandboge S, Salonen M, Kajantie E, Osmond C. Maternal weight in pregnancy and offspring body composition in late adulthood: findings from the Helsinki Birth Cohort Study (HBCS). Ann Med 2015;47:94–9.
crossref pmid
19. Kumari AS. Pregnancy outcome in women with morbid obesity. Int J Gynaecol Obstet 2001;73:101–7.
crossref pmid pdf
20. Sebire NJ, Jolly M, Harris JP, Wadsworth J, Joffe M, Beard RW, et al. Maternal obesity and pregnancy outcome: a study of 287,213 pregnancies in London. Int J Obes Relat Metab Disord 2001;25:1175–82.
crossref pmid pdf
21. Rutayisire E, Wu X, Huang K, Tao S, Chen Y, Tao F. Cesarean section may increase the risk of both overweight and obesity in preschool children. BMC Pregnancy Childbirth 2016;16:338.
crossref pmid pmc pdf
22. Fuente-Martín E, Argente-Arizón P, Ros P, Argente J, Chowen JA. Sex differences in adipose tissue: It is not only a question of quantity and distribution. Adipocyte 2013;2:128–34.
crossref pmid pmc
23. Karastergiou K, Smith SR, Greenberg AS, Fried SK. Sex differences in human adipose tissues - the biology of pear shape. Biol Sex Differ 2012;3:13.
crossref pmid pmc pdf
24. Voerman E, Santos S, Patro Golab B, Amiano P, Ballester F, Barros H, et al. Maternal body mass index, gestational weight gain, and the risk of overweight and obesity across childhood: an individual participant data meta-analysis. PLoS Med 2019;16:e1002744.
crossref pmid pmc
25. Gaillard R. Maternal obesity during pregnancy and cardiovascular development and disease in the offspring. Eur J Epidemiol 2015;30:1141–52.
crossref pmid pmc pdf
METRICS Graph View
  • 0 Crossref
  •  0 Scopus
  • 3,081 View
  • 110 Download