


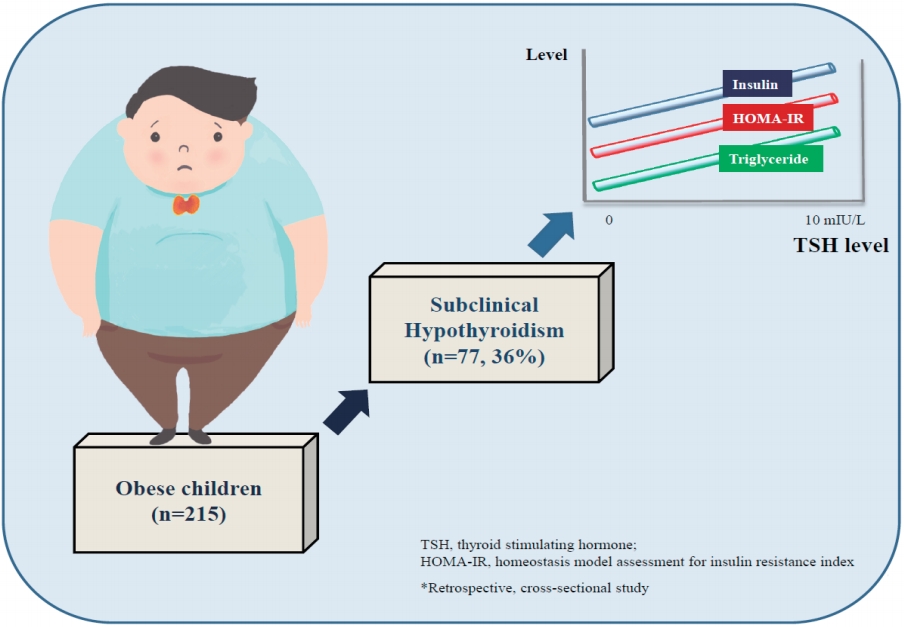
Graphical Abstract. The effect of subclinical hypothyroidism on metabolic parameters in obese children
Introduction
The prevalence of childhood obesity has increased by 5% each decade during the past 50 years and about 25% of all children are overweight or obese [1]. Obesity may result in complications like dyslipidemia, hypertension, and impaired glucose metabolism [2]. Thyroid hormones regulate the basal metabolism through playing a role in lipid and glucose metabolism [3]. Thyroid dysfunction leads to changes in body weight and composition [4]. As a result, the association between obesity and thyroid dysfunction has drawn attention. Subclinical hypothyroidism (SH) is defined as a thyrotropin (TSH) level of above the reference values despite normal serum free thyroxine (fT4) levels, and SH is more frequent in obese children and adolescents compared to subjects with normal weight [5-7]. The underlying mechanism of thyroid hormone alterations in the obese is not clear [8]. However, various mechanisms including iodine deficiency, autoimmune thyroid disease, TSH receptor gene mutation, thyroid hormone resistance, increased leptin levels, leptin-mediated production of pro-TSH-releasing hormone, impaired feedback due to a lowered number of T3 receptors in the hypothalamus and decrease in peripheral deiodinase activity have been proposed [6,8]. Besides, a positive correlation was found between the body mass index (BMI) and the TSH level in various studies conducted with the euthyroid obese (children who are above 95th BMI percentile for age and sex having normal thyroid function) [9,10]. Furthermore, the TSH levels are observed to increase with increasing weight [11]. All these changes in the obese are considered to be an adaptation for increasing the resting energy expenditure [12].
Assessment of thyroid functions is important in the obese as hypothyroidism is a cause of obesity. However, SH seems to be a result of obesity rather than the cause as TSH levels decrease with losing weight despite the absence of a consensus on this issue [8]. Treatment of SH in the obese is still of debate. Obesity-related glucose and lipid metabolism changes may be observed. Studies in children and adolescents are limited despite the presence of many adult studies investigating the relationship between the TSH level and metabolic parameters.
The present study was conducted with the aim of investigating the changes in glucose and lipid metabolism in obese children and adolescents with SH, and comparing these changes with those of euthyroid obese children and adolescents.
Methods
1. Study population
Patients aged between 6–18 years, who had been admitted to the Pediatric Endocrinology Outpatient Clinic of Bursa Yuksek Ihtisas Hospital with the complaint of being overweight between 1 October 2018 and 30 March 2019 and whose BMI >95th percentile for age and sex were included in the study. The study protocol was approved by the ethics committee of the Bursa Yuksek Ihtisas Training and Research Hospital (2011KAEK-25 2019/03-05) in accordance with the principles of the Helsinki Declaration. Data regarding age, sex, puberty, anthropometric measurements, and laboratory and radiology results were retrospectively collected from patient files. Patients who had missing data, whose thyroid auto-antibodies (antithyroid peroxidase, antithyroglobulin) were positive, whose TSH was >10 mIU/L and fT4 was low according to age, whose thyroid ultrasonography results were not normal, who had chronic diseases or medication use and secondary obesity, were excluded from the study. A total of 215 obese patients, the complete data of whom could be reached, whose thyroid auto-antibodies were negative and thyroid ultrasonography results were normal, were included in the study. Weight (kg), height (cm), BMI (kg/m2), BMI standard deviation score (SDS), puberty status and waist circumference of the patients were recorded. Laboratory analyses included TSH, fT4, fasting plasma glucose, homeostasis model assessment for insulin resistance (HOMA-IR), triglyceride (TG), total cholesterol (TC), high-density lipoprotein cholesterol (HDL-C), low-density lipoprotein cholesterol (LDL-C), aspartate aminotransferase, and alanine aminotransferase values. The patients were allocated to 2 groups according to thyroid function test results. Subjects whose fT4 level was normal and TSH level was 5–10 mIU/L were enrolled in the SH group. The subjects whose fT4 level was normal and TSH level was <5 mIU/L were enrolled in the control group. Both groups were compared with regard to fasting plasma glucose, insulin, HOMA-IR, and lipid profile.
2. Anthropometric examination
The weight measurements of all patients were carried out using the Tess BM 300 device (Comak tarti, Istanbul, Turkey), at 0.1-kg sensitivity and on an empty stomach, without shoes and with daily clothes. The height measurements were made with a stadiometer with an error of 1 mm with bare feet, standing upright, and the shoulder and gluteal area touching the wall. All measurements were made between 9:00 AM and 16:00 PM by the same person. BMI was calculated by using the formula: body weight/height2 (kg/m2).
3. Laboratory measurements
The serum fasting blood glucose, TC, TG, HDL-C, LDL-C, and insulin levels were tested after 12 hours of fasting. The serum blood glucose and lipids were tested using the standard methods with the ‘Cobas 8000’ (Roche Diagnostics Turkey, Istanbul, Turkey) equipment. Insulin was measured using the standard method with the ‘Cobas 8000’ equipment. Insulin resistance was calculated using the HOMA-IR formula (fasting blood glucose [mg/dL]×fasting insulin [µIU/mL]/405). The serum TSH (reference range, 0.5–5 mIU/L) and fT4 (reference range, 0.8–1.9 ng/mL) were analyzed using chemiluminescence immune assays method.
4. Statistical analysis
Statistical analyses were performed using the IBM SPSS Statistics ver. 21.0 (IBM Co., Armonk, NY, USA). The categorical variables were analyzed using the chi-square test. The Student t test and the Mann-Whitney U test were used for comparison of groups according to the parametric values. For correlation analyses, the Pearson test was used for the parametric variables and the Spearman test was used for the nonparametric variables. A P value <0.05 was accepted as statistically significant.
Results
1. Clinical characteristics of the subjects
A total of 215 patients were included in the study. There were 141 females (66%) and 74 males (34%). Mean ages of subjects were 12.33±2.86 years. The anthropometric and laboratory data of the patients have been summarized in Table 1.
2. Comparison of anthropometric and laboratory parameters between SH and control groups
SH was determined in a total of 77 patients (36%). There were 138 patients (64%) in the control group whose thyroid function test results were normal. No difference was found between the groups with regard to sex distribution (P=0.65). The puberty status was similar in both groups (P=0.92). While the mean BMI SDS was 2.47±0.67 in the SH group, it was 2.55±0.57 in the control group. Both groups were similar with regard to BMI SDS (P=0.16). When groups were compared with regard to glucose metabolism, the fasting insulin and the HOMA-IR were found to be higher in the SH group (P=0.007 and P=0.004, respectively). When the groups were compared with regard to lipid metabolism, while the HDL-C level was found to be lower, the TG level was seen to be higher in the SH group than control group (P=0.02 and P=0.01, respectively). The anthropometric and laboratory measurements of both groups have been summarized in Table 2.
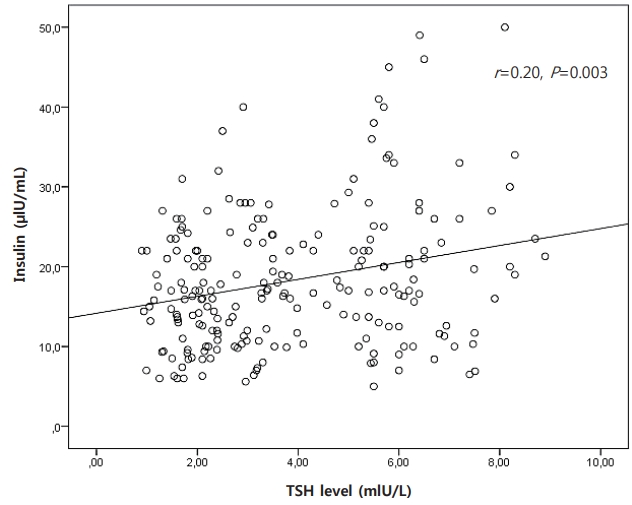
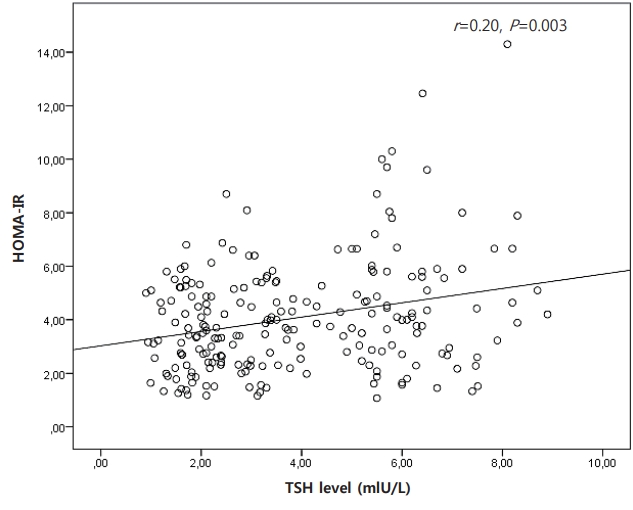
3. Correlations between TSH and metabolic parameters
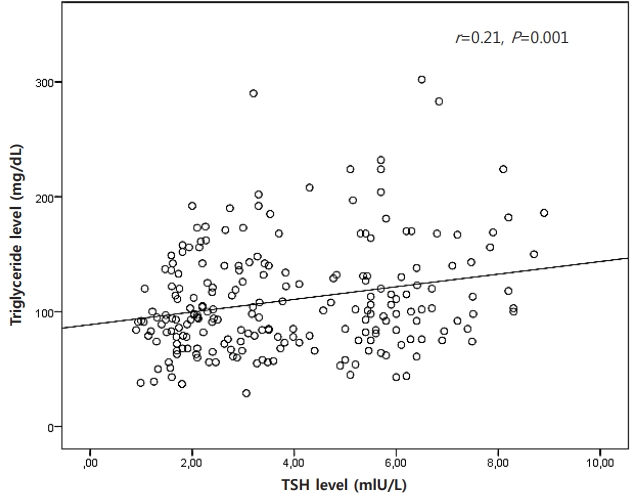
There was a positive correlation between TSH level and some metabolic parameters such as insulin (r=0.20, P=0.003), HOMA-IR (r=0.20, P=0.003), and TG (r=0.21, P=0.001). There was no correlation between TSH level and BMI and waist circumference. The correlation between TSH and metabolic parameters has been shown in Figs. 1–3.
Discussion
In the present study, the relationship between TSH level and metabolic parameters in obese children and adolescent with similar BMI was evaluated. Fasting insulin, HOMA-IR, and TG level were found to be higher in elevated TSH group (SH group). Also, HDL-C level was found to be lower in same group. Furthermore, positive correlation between TSH level and insulin, HOMA-IR, TG level were determined.
SH (elevated TSH and normal fT4) was determined in 36% of 215 obese children and adolescents in this study. Previous studies reported 7%–23% of obese children had moderately elevated TSH levels with normal or slightly elevated fT4 [8]. Thyroid hormones play a role in thermogenesis and energy consumption. Therefore, the interest in the association between thyroid functions and obesity and gaining weight has increased [13]. There are studies reporting a positive correlation between the serum TSH level and BMI beside the studies reporting the opposite [14-18]. In a study, the authors found a positive correlation between TSH and BMI, and furthermore, a gradual increase was observed between gaining weight and the TSH level [11]. In our study, no correlation was found between the serum TSH level and BMI.
In the present study, no difference was found between the groups with regard to age, sex, and puberty status. In a previous study, no relationship was observed between the TSH level and sex [19]. Dahl et al. [7] found higher TSH levels in boys than girls in a study conducted with 1796 obese/overweight subjects in childhood and adolescence. In a study conducted with euthyroid obese children, a negative correlation was found between age and puberty status, and TSH levels [10].
Thyroid hormones play an important role in glucose and lipid metabolism. Evident hypothyroidism is associated with obesity, insulin resistance, hyperglycemia, dyslipidemia, and increased cardiovascular events [20]. However, the influence of SH on metabolic parameters is still of interest with regard to its clinical relevance as there is no consensus regarding the treatment of SH. Furthermore, the influence of thyroid functions on metabolic parameters has become an issue of interest due to the higher prevalence of SH in the obese compared to normal weighing subjects. An ample amount of studies are available investigating the association between thyroid hormones and, glucose and lipid metabolism in the obese in childhood and adolescence [9,13,18]. While an association was found between TSH and, insulin and HOMA-IR index in some studies [18], other studies did not report such an association [21]. In our study, the insulin and HOMA-IR values were found to be higher despite BMI being similar in both groups. In addition, a positive correlation was determined between the TSH level and, insulin and HOMA-IR index.
The levels of TSH and lipid profile were evaluated in previous studies conducted with children and adolescents and a significant correlation was found between the TSH level and TG or TC [10,22,23]. On the other hand, there are studies that did not find a correlation between the TSH and lipid concentration [23,24]. Different from the others, the HDL-C level was found to be lower in the SH group compared to the control group in our study. In a population-based study evaluating the serum TSH level and lipid concentration of 30,656 subjects who did not have any thyroid diseases, while a linear increase was determined between the TSH level and serum TC, TG, and LDL-C levels, a linear decrease was determined between the TSH level and HDL-C [25]. The relationship between TG and HDL-C was reported to be more evident, particularly in overweight subjects [25]. Low HDL-C levels accompany high TG levels, particularly in subjects with insulin resistance. The potential mechanism is that HDL particles can be catabolized more easily related to high TG levels [26]. Finding high TG levels and low HDL-C levels in the SH group in our study can be explained with this mechanism.
The levels of TSH are seen to decrease when obese individuals lose weight. Therefore, the TSH elevation seems to be a result of obesity rather than the cause [8]. The TSH level was found to be significantly correlated with TC, LDL-C, insulin, and HOMAIR in a study of Aeberli et al. [18] conducted with 206 obese children and adolescents. After these patients lost weight, the TSH levels were observed to decrease and the decrease in TSH was found to predict the decrease in insulin and HOMA-IR. On the other hand, the elevation in TSH in the obese seems to be an adaptation mechanism for increasing the basal metabolic rate[8]. In conclusion, negative alterations are common in insulin, HOMA-IR and lipid metabolism in the obese with SH compared to the euthyroid obese, and this condition is correlated with the TSH level. All these results indicate that TSH could be evaluated as a metabolic risk factor in obese children and adolescents.
The study had some limitations. The first limitation was its retrospective design. The second was the absence of a control group including normal weighing children and adolescents.
The present study, which compared the obese children and adolescents with similar BMI, showed that insulin, HOMA-IR, and TG levels were higher and the HDL-C level was lower in patients with SH. In conclusion, it can be said that the TSH may be evaluated as a metabolic risk factor in obese patients.
 PDF Links
 PubReader
 ePub Link
 PubMed
 Download Citation


