

Introduction
Perinatal hypoxic ischemic (HI) brain injury is an important cause of neonatal mortality and can result in permanent neurodevelopmental disability1). Perinatal hypoxic-ischemic encephalopathy (HIE) is reported to affect 2 to 4 of every 1,000 full-term neonates, and considerably more preterm neonates2). Brain injury is irreversible and can have long term sequelae such as cerebral palsy, mental retardation, learning disabilities, and epilepsy1). Despite intensive research into HI brain injuries over several decades, no specific, successful, neuroprotective strategies exist. The development of new neuroprotective interventions to improve prognosis after perinatal asphyxia is critical.
Many researchers have attempted to elucidate the mechanism of neurotoxicity underlying HI injury so as to develop treatment strategies, but the mechanism is still not completely understood. HI in newborns, and brain ischemia in adults, are characterized by a cascade of cellular events due to mitochondrial dysfunction that result in the impairment of energy metabolism3,4). In the early stages after HI injury, neuronal cell damage begins with cellular necrosis. After a few hours, apoptosis occurs. Oxygen free radicals are also thought to play an important role in HI injury by promoting lipid peroxidation, protein destruction, and DNA damage. Thus, it is important that thes e free radicals be decreased to prevent injury.
Recently, preconditioning with hypoxia, hypothermia, and xenon gas was shown to protect both in vivo and in vitro against HI brain injury in animal studies5-7). However, these treatments strategies to protect and prevent neuronal damage are limited clinically, and are highly risky in newborns. Therapeutic agents that would be more effective and safer for newborns are required. The protective effects of various therapeutic agents including basic fibroblast growth factor, netrin-1, transferrin, nerve growth factor, and allopurinol against HI injury have also been investigated in animal models8-12). However, the side-effects associated with the use of these agents prevent their application in newborns.
Oral L-carnitine (3-hydroxy-4-N-trimethylammonium-butyrate) is available as a conditional nutritional supplement and as a prescribed drug for other diseases. L-carnitine is commercially available for the treatment of primary and secondary L-carnitine deficiency13). L-carnitine may have a cardioprotective effect in addition to beneficially affecting cardiac function, and it may aid the treatment of dementia disorders including Alzheimer's disease3,14,15). L-carnitine, an amino acid derivative that is found in nearly all cells of the body, plays an essential role in transporting long-chain fatty acids across the inner membrane of the mitochondria, where the fatty acids are then processed by β-oxidation to produce biological energy in the form of adenosine triphosphate (ATP), and neutralize excess toxic intracellular acyl-coenzyme A (acyl-CoA) production16-18). High levels of acyl-CoA esters impair numerous mitochondrial processes16,17,19-21). L-carnitine has an essential function in acute metabolic crises; it traps toxic acyl-CoA moieties that impair fatty acid oxidation, urea cycle function metabolism, and gluconeogenesis16,19-21).
The results of the studies discussed above suggest that L-carnitine can protect cells from peroxidative stress by several mechanisms, including prevention of the formation of reactive oxygen species (ROS), decreasing cellular damage, and reducing apoptosis. L-carnitine may therefore reduce damage after HI brain injury.
Several recent studies have reported that L-carnitine protects mitochondria and cells effectively against oxidative injury both in vitro and in vivo22-27). Furthermore, L-carnitine has been shown to protect against cerebral ischemia and myocardiac ischemia in adult animal models22-27). L-carnitine has also been reported to be effective in reducing HI brain injury in newborn rats after birth in vivo28). However, no study has directly investigated the mechanism by which L-carnitine treatment protects against HI brain injury.
The purpose of the present study was to further clarify the neuroprotective mechanisms of L-carnitine against HI brain injury using an in vitro model of HI neuronal injury. The present study investigated whether L-carnitine could reduce primary rat cortical neuronal injury following oxygen-glucose deprivation (OGD).
Materials and methods
1. Animal model
The experimental protocols used in this study were reviewed and approved by the Institutional Animal Care and Use Committee of the Samsung Biomedical Research Institute, Seoul, Korea. This study was also performed in accordance with institutional and National Institutes of Health guidelines for laboratory animal care.
Pregnant Sprague-Dawley female rats (Daihan Biolink, Seoul, Korea) were used for the in vitro experiments. Each experiment was repeated two times. For each experiment, four pregnant rats were sacrificed. Living embryos were excised by caesarian section performed under anesthesia with halothane. Each pregnant rat had between 10 to 12 embryos. Cortical neurons were prepared from rat embryos. Brains were removed from rat embryos at embryonic day (E)17, and the cortical area was dissected. Cortices were carefully collected and dissected free from the meninges. The rationale for choosing E17 is that generation of cortical cell types occurs in temporally distinct phases. The ventricular zone arises first, and cells from this area develop mainly into neurons. Ventricular zone neurogenesis peaks at E14 and recedes at E17 in rats. In contrast, cells originating from the subventricular zone at late embryonic days and early postnatal days (rat E17 to postnatal day [P]14) are destined predominantly for glial lineages29,30).
2. Primary neuronal cell culture
The culture methods were similar to those described previously31,32). Briefly, cortical tissues from E17 rat embryos were incubated in Dulbecco's phosphate-buffered saline (D-PBS; JBI, Daegu, Korea) containing 0.1% trypsin (Gibco, Rockville, MD, USA) for 15 minutes in a 37℃ water bath. It contained 40 µg/mL deoxyribonuclease I (DNase I; Sigma-Aldrich Co., St. Louis, MO, USA). Digestion was terminated by the addition of 20% fetal bovine serum. The tissue pieces were triturated into single cells by gentle pipetting through a fire-polished Pasteur pipette. Dissociated cells were suspended in neurobasal medium (Gibco) containing 2% B-27 supplement (Gibco). This serum-free combination medium is widely available for primary cultures of neurons and neuronal cell lines33). Cells were seeded in 24-well culture plates pretreated overnight at 37℃ with 100 µg/mL poly-D-lysine and 4 µg/mL laminin. The final cell density was approximately 2×10⁵ cells/cm2 in 2 mL/well of the culture medium. Cells were incubated at 37℃ in a 5% CO2/95% air atmosphere for 10 days. Culture medium was changed every 2 days in vitro and studies were performed at in vitro days 10 to 11. Each of the experimental groups was tested in four culture media (n=4), and 10 microscopic areas were counted for each medium tested.
3. Oxygen-glucose deprivation
L-carnitine (Sigma-Aldrich Co.) was applied to cultures just before they were exposed to OGD, and levels of L-carnitine were maintained during OGD. L-carnitine was also applied to cultures before reoxygenation because the culture medium was changed. L-carnitine was diluted with distilled water and applied to cells at concentrations of 1, 10, or 100 µM.
OGD was performed as described in detail elsewhere34,35). Exposure of rat cortical cultures to OGD was performed at in vitro day 10. The initial culture medium, Dulbecco's Modified Eagle's Medium (DMEM), was replaced by a solution containing (mmol/L): NaCl 130, KCl 5.4, CaCl2 1.8, NaHCO3 26, and MgSO4 0.8, NaH2PO4 1.18, and bubbled with 95% N2/5% CO2 for OGD cells (OGD solution). OGD cells were transferred to an anaerobic chamber containing 95% N2/5% CO2, humidified at 37℃, and maintained at a constant pressure of 0.015 bar. Cells were exposed to OGD for 60 minutes. OGD was terminated by replacing the exposure medium with serum-free DMEM containing 2% B27 supplement without antioxidants (Gibco) and were returned to the normoxic incubator. Control cultures in a solution identical to the OGD solution but containing glucose (33 mmol/L; control solution) were kept in the normoxic incubator for the same time period as the OGD experiment, and then the incubation solution was replaced with reperfusion buffer and cultures were returned to the normoxic incubator. To explore the neuroprotective effect of L-carnitine, cultures were treated with L-carnitine (1, 10, and 100 µM) during OGD and reoxygenation. Cell viability and cell death were evaluated 24 hours after OGD and ROS detection was evaluated 3 hours after OGD.
4. Immunocytochemistry
Cultures were stained with acridine orange (AO) and propidium iodide (PI) to quantify cell survival of primary cortical neurons. Untreated and L-carnitine-treated cells were washed with phosphate buffered saline (PBS) and stained for 10 minutes at 37℃ with a mixture of AO (15 µg/mL; Sigma-Aldrich Co.) and PI (4.6 µg/mL; Sigma-Aldrich Co.). AO is a nucleic acid-selective fluorescent cationic dye that is used for cell cycle determination. It is cell-permeable and interacts with both DNA and RNA. PI is an intercalating agent and a fluorescent molecule used to stain DNA. It can be used to differentiate necrotic, apoptotic, and normal cells. Neuronal injury curtails AO staining and facilitates PI penetration and interaction with DNA to yield a bright red fluorescent complex. Viability was expressed as the ratio of cells that stained with PI to those stained with AO (PI/AO). The concentrations of PI/AO were modified to visualize living and dead cells simultaneously36). Immediately after staining, cells were examined directly with an E600 fluorescence confocal microscope (Nikon, Tokyo, Japan) and pictures were taken. Cells stained with AO and PI were counted in random microscopic fields. Ten images were selected randomly from each sample, and the mean number of cells stained with AO and PI was determined. Cells were counted using a magnification of ×400.
5. MTT cell viability assay
The 3-(4,5-dimethylthiazol-2-yl)-2,5-diphenyltetrazolium bromide (MTT) cell proliferation assay is a standard colorimetric assay for measuring cellular growth and viability. It can also be used to determine the cytotoxicity of potential medicinal agents and other toxic materials. The yellow, water-soluble tetrazolium MTT is reduced to a blue, insoluble formazan product in mitochondria of viable cells by succininate-tetrazolium dehydrogenase. After incubation, a solubilization solution is then added to dissolve the insoluble purple formazan product and the amount of dye solubilized is quantitated by measuring the optical density at 570 nm.
After OGD, the cultured cells were washed twice with D-PBS and a 10 µL MTT (Roche Diagnostics Co., Indianapolis, IN, USA) solution (5 mg/mL PBS; Molecular Probes Inc., Eugene, OR, USA) was added. After a 3-hour incubation (37℃, 5% CO2), the MTT solution was aspirated and replaced with 200 µL dimethylsulfoxide (DMSO; Sigma-Aldrich Co.) to dissolve the formazan crystals produced by MTT reduction. The reaction solutions were transferred to 96-well culture microplates and the absorbance was read at 570 nm on an automated microplate reader using SOFTmax program ver. 5.2 (Molecular Device Co., Sunnyvale, CA, USA) to evaluate the degree of cell activation in response to various doses of L-carnitine. Results are expressed as the mean percent increase over background levels based on two experiments.
5. Lactate dehydrogenase (LDH) release assay
Cell injury was confirmed by measuring the amount of LDH released into the extracellular fluid by damaged or destroyed cells 24 hours after OGD reoxygenation in the following groups: control, OGD, and pretreatment with L-carnitine followed by OGD exposure. A series of control experiments showed that the specific efflux of LDH induced by OGD reoxygenation was linearly proportional to the number of neurons damaged or destroyed, and that no specific LDH efflux occurred when pure cultured cortical glial cells were similarly exposed to OGD. Cytotoxicity (%) was calculated as follows: (measured LDH activity-LDH activity of control) / (full kill LDH activity-LDH activity of control)×100. "Full kill" means that a control culture was lysed totally for 10 minutes with 1% Triton X-100 (Sigma-Aldrich Co.). After neuronal cell cultures were exposed to OGD reoxygenation for 24 hours, 100 µL of culture medium aspirated from each well was transferred to a 96-well plate, and was then incubated with a 100 µL reaction mixture in the dark for 10 minutes at room temperature. The amount of LDH released was determined by measuring the optical density at 490 nm.
6. Measurement of intracellular ROS formation
Molecular oxygen is necessary to sustain life, but ROS produced as a metabolic product due to oxygen consumption are paradoxically highly toxic to cells. Oxidative stress was assessed by direct measurement of ROS. Intracellular ROS levels were monitored using the fluorescent dye 2',7'-dichlorodihydrofluorescein diacetate (DCF-DA; Sigma-Aldrich Co.). DCF-DA, which is oxidized to fluorescent DCF by hydroperoxide, was used to measure relative levels of cellular peroxides37). After treatment, cultured cells were washed twice with D-PBS, and incubated with 10 µM DCF-DA in medium for 30 minutes. The cells were then washed with D-PBS. Fluorescence and differential interference contrast images were taken using an Axiovert 200 inverted microscope (Carl Zeiss, Jena, Germany). The intensity of green fluorescence was quantified using image analyzer software. Ten images were taken of each sample, and the mean ROS level of each sample was calculated.
7. TUNEL assay
Terminal deoxynucleotidyl transferase-mediated deoxyuridine triphosphate nick end labeling (TUNEL) is a common method for detecting DNA fragmentation produced by apoptotic signaling cascades. The assay relies on the presence of nicks in the DNA which can be identified by terminal deoxynucleotidyl transferase, an enzyme that will catalyze the addition of dUTPs that are secondarily labeled with a marker. This assay can also be used to label cells undergoing necrosis or cells that have suffered from severe DNA damage. The number of apoptotic OGD-stimulated neurons was determined by immunofluorescent TUNEL performed using the Apoptag fluorescein in situ detection kit (Chemicon International, Temecula, CA, USA), which detects the 3'-OH region of cleaved DNA during apoptosis. After OGD, cells were washed with D-PBS and fixed on chamber slides with 4% paraformaldehyde at 4℃ for 30 minutes. Cells were incubated in a permeabilization solution (0.2% Triton X-100 and 0.5% bovine serum albumin in D-PBS, pH 7.4) for 10 minutes. TdT reaction reagent was added to the cells for 1 hour at 37℃ and Avidinfluorescein isothiocynate II solution for 30 minutes. PI was used to counterstain stained cells. Slides were washed in PBS, mounted with Vectashield mounting solution with 4,6-diamidino-2-phenylindole (H-1200; Vector Laboratories Inc., Burlingame, CA, USA), and visualized with a Nikon E600 fluorescent microscope using an excitation wavelength of 460 to 490 nm. Apoptotic TUNEL-positive cells were counted under a fluorescence microscope with the viewer blinded to the identity of the treatment group. For each experiment, 10 random fields at 400× magnification were observed. The number of TUNEL-positive cells was initially expressed as the ratio of the number of green to red cells (TUNEL/PI). TUNEL/PI double staining flow cytometry was performed to assess the apoptotic rate and to determine the phase of the apoptotic cells38). The number of TUNEL-positive cells was expressed as the number of green cells divided by the number of total (red and green) cells.
8. Statistical analyses
All data are given as the mean±standard error of the mean. The statistical significance of differences between treatment groups was determined by one-way analysis of variance using the Tukey-Kramer multiple comparison test, and T-tests using Student-Newman-Keuls comparisons. All statistical analyses were performed using GraphPad Instat ver. 3.05 (GraphPad Software Inc., La Jolla, CA, USA). P values <0.05 were assumed to be significant.
Results
1. L-carnitine treatment reduces neuronal cell death after OGD
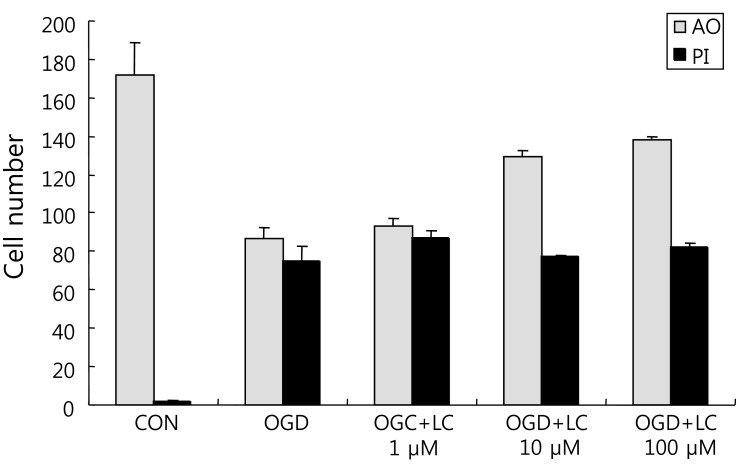
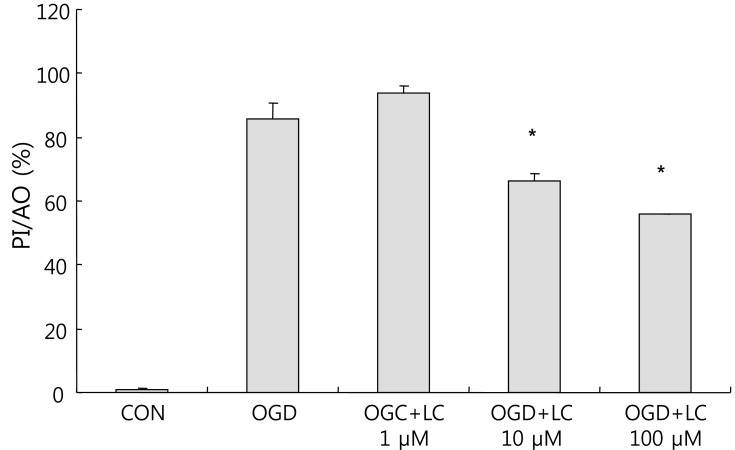
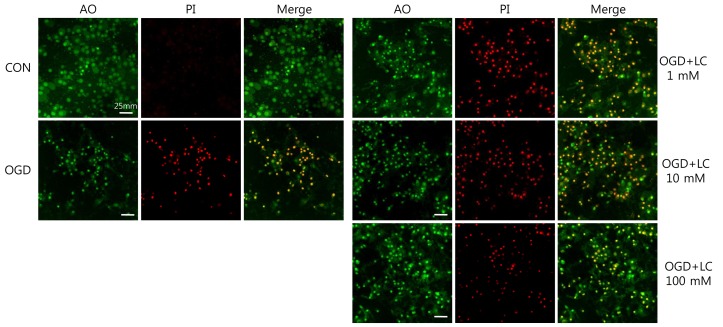
To examine whether L-carnitine can reduce neuronal injury after OGD, cultured primary cortical neurons were evaluated by AO and PI staining. Fig. 1 shows the cell numbers stained with the fluorescent dyes AO and PI in each group. The mean number of cells that stained with AO and PI were 171.50±17.36 and 2.00±0.68 in the control group, respectively, and 86.50±5.88 and 74.67±7.95 in the OGD group, respectively. In the OGD groups treated with L-carnitine, the number of cells that stained with AO and PI were 92.83±4.45 and 86.83±3.55 in the OGD group treated with 1 µM L-carnitine, respectively, 129.20±2.94 and 77.00±1.08 in the OGD group treated with 10 µM L-carnitine, respectively, and 138.00±2.16 and 81.67±2.37 in the OGD group treated with 100 µM L-carnitine, respectively. As shown in Fig. 1, the number of cells that stained with AO in the OGD groups treated with L-carnitine was proportional to the dose of L-carnitine. At lower doses of L-carnitine, especially 1 µM, the number of cells stained with AO was not increased, whereas at higher doses of L-carnitine, the number of cells that stained with AO increased. However, the differences in staining between groups were not statistically significant. The viability of neuronal cells was evaluated by calculating the PI/AO ratio, which indicates the number of dying cells. The results are shown in Fig. 2. The percentage of dying cells was significantly lower in the groups treated with L-carnitine, especially at concentrations of 10 µM and 100 µM (66.53±2.08% in the OGD group treated with 10µM L-carnitine, 55.80±0.09% in the OGD group treated with 100 µM L-carnitine vs. 85.51±5.22% in the untreated OGD group; P<0.05). However, the PI/AO ratio was not significantly different between the untreated OGD group and the group treated with 1 µM L-carnitine (93.82±2.42% in the OGD group treated with 1 µM L-carnitine vs. 85.51±5.22% in the untreated OGD group). Fig. 3 shows the morphology of neuronal cells after OGD treatment. Higher doses of L-carnitine reduced cellular death compared to lower doses of L-carnitine.
2. L-carnitine treatment prior to OGD increases cell viability and reduces LDH release
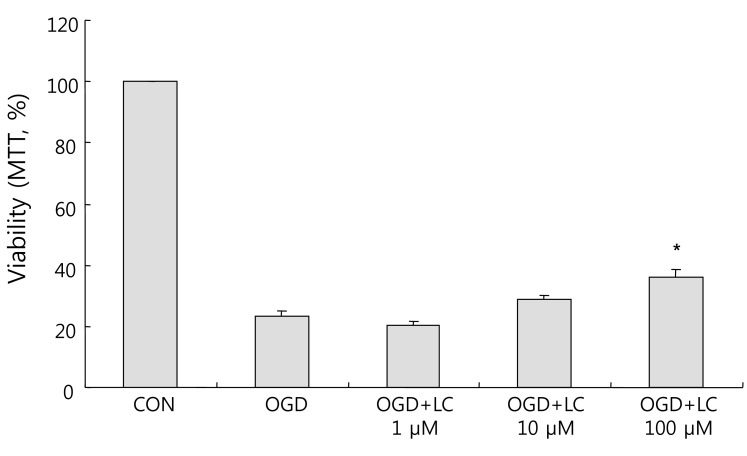
As shown in Fig. 4, exposure to OGD resulted in decreased cell viability compared to the control group as assessed using the MTT assay. Relative to the 100.00±0.00% viability of the control group, the cell viability was 23.24±1.93% in the untreated OGD group, 20.15±1.45% in the OGD group treated with 1 µM L-carnitine, 29.04±1.02% in the OGD group treated with 10 µM L-carnitine, and 35.86±2.54% in the OGD group treated with 100 µM L-carnitine. Thus cells treated with L-carnitine prior to OGD group were significantly more viable than cells not pre-treated with L-carnitine. Treatment of neuronal cells with L-carnitine followed by OGD exposure resulted in dose-dependent protection. In particular, the increase in cell viability in the OGD group treated with 100 µM L-carnitine was significantly greater than that of the untreated OGD group (P<0.05).
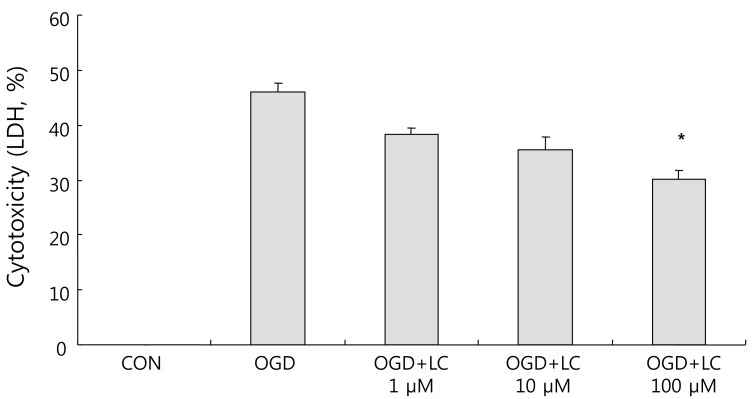
LDH leakage corresponds to cytotoxicity and membrane damage. OGD caused cell death, as shown by the increased LDH efflux to the medium. The LDH leakage results confirmed the MTT assay results. The percentage cytotoxicity based on LDH measurements was 46.04±1.70% in the untreated OGD group, 35.18±1.28% in the OGD group treated with 1 µM L-carnitine, 35.42±2.44% in the OGD group treated with 10 µM L-carnitine, and 30.09±1.59% in the OGD group treated with 100 µM L-carnitine (Fig. 5). There was a significant decrease in LDH leakage in all OGD groups treated with L-carnitine compared to the untreated OGD group.
3. L-carnitine treatment reduces intracellular ROS formation after OGD
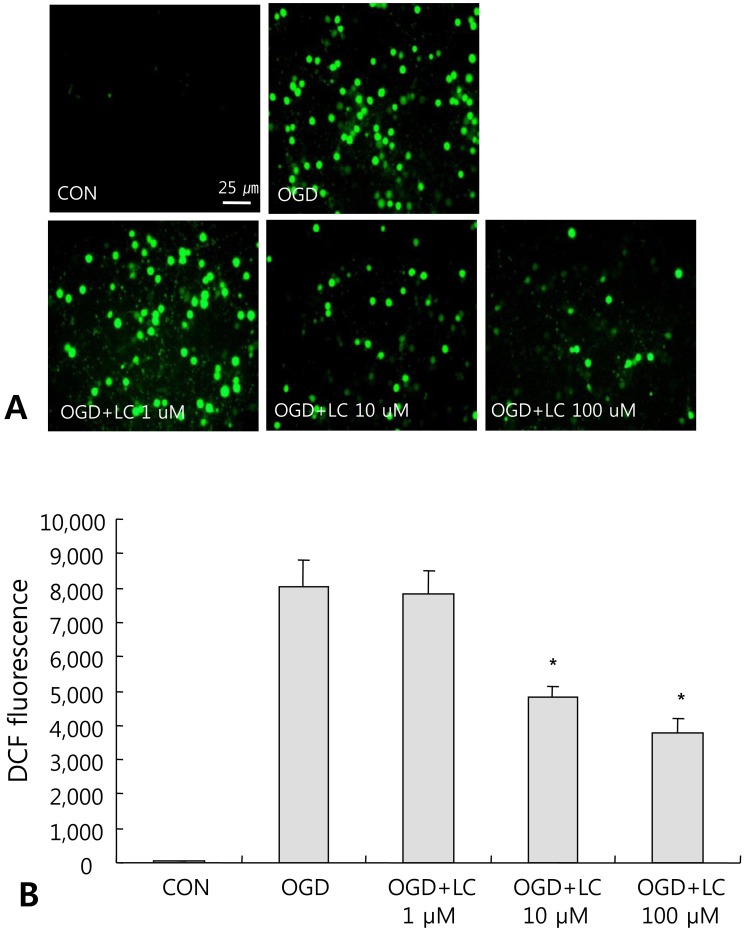
To investigate the involvement of free radical-mediated oxidative stress during OGD injury, we measured ROS levels in neuronal cell cultures. ROS formation can lead to protein oxidation, lipid peroxidation, DNA damage, and eventually cell death. Intracellular ROS levels were monitored using the fluorescent dye DCF-DA. Fig. 6A shows the accumulation of ROS in neuronal cells exposed to OGD. Treatment with L-carnitine inhibited ROS accumulation in neuronal cells after OGD. A significant decrease in ROS formation was found in the OGD groups treated with 10 µM or 100 µM L-carnitine compared to the control group (P<0.05) (Fig. 6A). ROS levels were 29.89±20.35 in the control group and 8,049.71±770.07 in the OGD group that did not receive L-carnitine treatment, while the ROS level was 7,837.50±654.90 in the OGD group treated with 1 µM L-carnitine, 4,838.00±294.82 in the OGD group treated with 10 µM L-carnitine, and 3,770.00±419.98 in the OGD group treated with 100 µM L-carnitine (Fig. 6B).
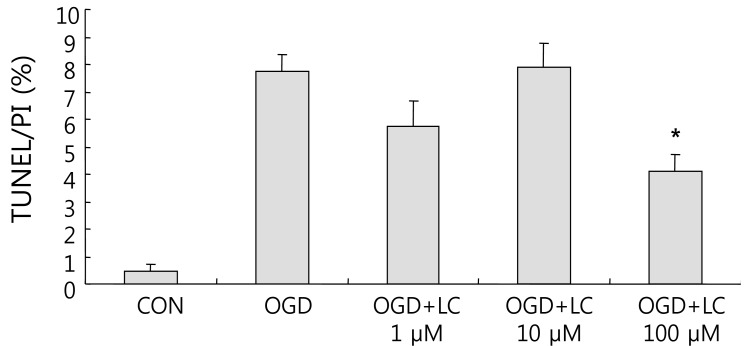
4. L-carnitine treatment reduces the TUNEL/PI ratio after OGD
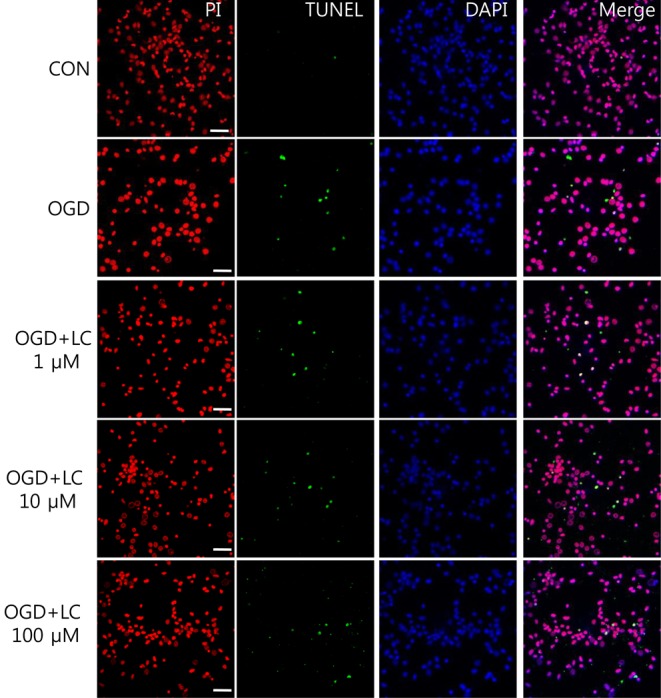
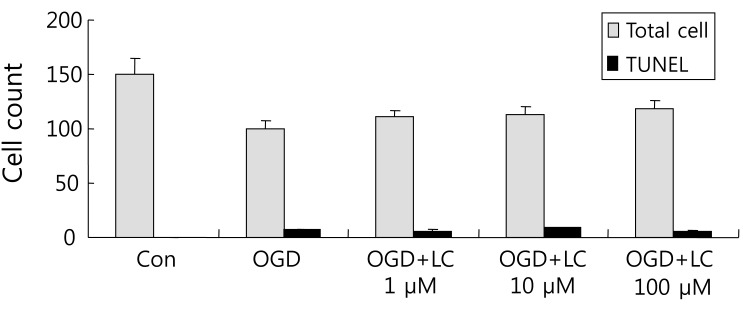
Neuronal viability and apoptosis were also assessed using the TUNEL assay. Fig. 7 shows TUNEL-positive cells after treatment of cells with OGD. The number of TUNEL-positive (green) cells in OGD groups treated with L-carnitine decreased in a dose-dependent manner compared to the number of TUNEL-positive cells in the OGD group that was not treated (Fig. 8). However, the differences between groups were not significant. The mean number of cells that stained with PI and were TUNEL-positive was 150.50±14.44 and 0.63±0.24 in the control group, respectively, and 100.70±5.90 and 7.60±0.64 in the untreated OGD group, respectively. In the OGD groups treated with L-carnitine, the mean number of cells that stained with PI and were TUNEL-positive were 110.70±5.49 and 6.30±1.03 in the OGD group treated with 1 µM L-carnitine, respectively, 112.10±7.58 and 8.56±0.82 in the OGD group treated with 10 µM L-carnitine, respectively, and 119.10 7.63 and 4.90±0.72 in the OGD group treated with 100 µM L-carnitine, respectively. The incidence of TUNEL-positive cells was expressed as the ratio of green cells to red cells (TUNEL/PI). TUNEL/PI was 0.48±0.22% in the control group, 7.72±0.65% in the untreated OGD group, 5.76±0.91% in the OGD group treated with 1 µM L-carnitine, 7.90±0.88% in the OGD group treated with 10 µM L-carnitine, and 4.12±0.59% in the OGD group treated with 100 µM L-carnitine (Fig. 9). There was a significant decrease in the TUNEL/PI ratio in the OGD groups treated with 100 µM L-carnitine compared to the untreated OGD group (P<0.05). The differences in the TUNEL/PI ratio were not significantly different among the other groups. The results indicated that a high dose of L-carnitine treatment reduces apoptosis of cortical cells after OGD.
Discussion
In the present study, we investigated the protective effects of L-carnitine against OGD in primary cortical neurons in vitro. OGD is commonly used to induce HI injury in animal models. We used an in vitro model of cerebral ischemia in this study, in which rat cortical neurons were exposed to OGD to more closely mimic the in vivo situation34,35). Primary cultures of cortical neurons exposed to OGD sustained cell damage as detected by PI staining, lack of MTT reduction, release of LDH, formation of ROS, and apoptosis. Cell viability was assessed by immunocytochemistry and MTT assays, while cell injury was evaluated by measuring the rate of LDH leakage, ROS accumulation, and apoptosis via the TUNEL assay. To explore whether L-carnitine protected cortical neurons against OGD, cultures were treated with L-carnitine before OGD exposure and reoxygenation. L-carnitine treatment significantly increased cell viability, decreased the rate of LDH leakage, decreased ROS formation, and decreased the percentage of apoptotic cells. The protective effects of various doses (1 µM, 10 µM, and 100 µM) of L-carnitine against OGD were investigated. In groups treated with the lowest dose of L-carnitine (1 µM), cell viability did not increase, whereas in groups treated with higher doses of L-carnitine (10 and 100 µM), cell viability increased significantly compared to the untreated OGD group. LDH release, ROS production, and cell apoptosis were also not significantly decreased by treatment with 1 µM L-carnitine compared to the untreated OGD group, whereas in groups treated with the higher doses of L-carnitine, cell viability was significantly increased compared to the untreated OGD group. Treatment of cultures with 100 µM L-carnitine increased cell viability after exposure to OGD, decreased LDH leakage, decreased ROS formation, and inhibited cell apoptosis in all experiments compared to the untreated OGD group. Thus, a high dose of L-carnitine protects against primary cortical neuronal cell damage, consistent with other brain injury studies.
Neuroprotection can be provided by two distinct mechanisms. One is the prevention of necrosis and cell death, as with the use of antioxidants or other treatments. The other is the prevention of the expansion of neuronal death after hypoxia ischemia due to inhibition of the apoptotic cascade. OGD-induced cell death, similar to hypoxic ischemia and stroke-induced cell death, occurs by both necrosis and apoptosis39). We hypothesize that L-carnitine treatment protects against OGD by reducing acyl-CoA thereby overcoming the acyl-CoA-mediated blockage of normal mitochondrial metabolism. Exogenous L-carnitine may reduce neuronal HI injury by buffering toxic acyl-CoA esters and releasing critical metabolic processes from acyl-CoA inhibition. Thus, L-carnitine may prevent both necrosis and apoptosis. Even though it is not clear how L-carnitine protects against HI injury directly, the present results show that L-carnitine promoted cell viability and decreased apoptosis after exposure to OGD. A previous study demonstrated that propofol protected hippocampal cell cultures against necrosis and apoptosis following OGD21). Furthermore, aspirin was shown to protect rat cortical neurons against OGD by inhibiting glutamate release, as assessed by determining oxygen consumption, LDH activity, and cell viability via PI staining and the MTT assay35). It has been reported that hepatocyte growth factor directly protects cortical neurons against OGD and reperfusion-induced cell injury in a dose-dependent manner, and that hepatocyte growth factor has a potent anti-apoptotic action on neurons exposed to OGD and reperfusion40). In the latter study, cell viability was assessed by the MTT assay, and cell injury was evaluated by the LDH leakage rate. The percentage of apoptotic cells was analyzed by flow cytometry and Hoechst 33258 staining.
The ability of L-carnitine to protect against cell death is consistent with the results of a previous study41). In that study, L-carnitine prevented bilirubin-induced N-methyl-D-aspartate (NMDA) neurotoxicity. In vitro, bilirubin induces apoptosis by decreasing the uptake of glutamate, which leads to the overstimulation of NMDA receptors and, ultimately, cell death42). It was previously shown that L-carnitine can accelerate the growth and differentiation of neurons, astrocytes, oligodendrocytes, and ependymal cells from the neurosphere in long-term cultured (2 months) adult murine brain cells, although L-carnitine did not improve their proliferative activity in short-term cultures25). In another study, L-carnitine and vitamin E alone or in combination provided neuroprotective effects against ischemia-reperfusion injury in rats based on histological examinations, assessment of malondialdehyde levels, superoxide dismutase (SOD) activity, and glutathione (GSH) levels43). HI injury enhances the formation of ROS in brain tissue. ROS are directly involved in oxidative cellular damage in HI tissues, which can lead to cell death. ROS are scavenged by SOD and GSH. L-carnitine is available in several forms. Oral L-carnitine is available as a nutritional supplement and as a prescribed treatment for primary and secondary L-carnitine deficiencies. Intravenous L-carnitine is available as a prescription drug for the treatment of primary and secondary L-carnitine deficiencies13). L-carnitine is able to cross the blood brain barrier (BBB) in mice44). L-carnitine has also been detected in fetal tissues, and L-carnitine can be transferred to the fetus via the placenta when administered to pregnant mice45). L-carnitine thus has the ability to move easily across the BBB and can be administered either orally or intravenously. However, no data directly addressing the protective effect of L-carnitine treatment on prenatal cerebral ischemic injury in fetuses or newborns have been published.
Presently, we observed substantial decreases in ROS generation and apoptosis in rat cortical neuron cultures at a dose of 100 µM L-carnitine. L-carnitine can accelerate the in vitro regeneration of neural networks from adult murine brain cells with the best proliferative activity obtained with 100 µM L-carnitine after 10 days of culture in one study25). In a study in which L-carnitine was shown to prevent bilirubin neurotoxicity41), L-carnitine was administered at doses of 1 µM , 10 µM, 100 µM, and 1,000 µM. L-carnitine at a dose of 100 µM significantly blocked bilirubin neurotoxicity. In contrast, the 1,000 µM concentration significantly increased bilirubin toxicity, whereas, similar to the current study, doses of 1 µM and 10 µM was ineffective. No study has investigated the relationship between experimental concentrations and clinical concentrations of L-carnitine. In one study, only 20% of a 2 g dose of L-carnitine was found to be absorbed following ingestion46). Further investigation is needed to evaluate the proper L-carnitine dose in a clinical setting.
L-carnitine has very few side effect, and is easy to administer, making it suitable for use in newborns. Our results suggest that L-carnitine treatment may address the earliest events that occur in HI injury and may provide neuroprotective effects in the prenatal and postnatal periods for fetuses or newborns at high risk. In addition, the protective effect of L-carnitine was directly proportional to the dosage. Given that the optimal dose of L-carnitine that had a protective effect in this study was fairly low (100 µM), L-carnitine at this concentration is not likely to be toxic.
L-carnitine has been shown to be beneficial in the treatment of HI injuries in adult animal models. L-carnitine treatment is protective in vivo against strokes in rats and Alzheimer's disease in mice22,23) and displays a cardioprotective effect in rat ischemic hearts in vivo19,26). Adult animal brain cells show limited neurogenesis, but fetal or newborn animal brain cells can grow easily in culture. In one study, L-carnitine treatment inhibited increases in cerebral carnitine esters and glutamate after hypoxic ischemia in newborn rats in vivo16). In that study, HI was associated with a significant increase in the ratio of acyl-CoA/CoA, which was prevented by treatment with carnitine. Carnitine treatment also prevented the increased the levels of glutamate, glycine, and superoxide radicals, and decreased the level of cardiolipin.
We hypothesize that L-carnitine reduces brain neuronal injury after HI injury by the preceding mechanisms. Wainwright et al.28) were the first to report that L-carnitine reduced brain injury after HI in newborn rats in vivo.
L-carnitine may have therapeutic potential. L-carnitine has been used to treat chronic hemodialysis adult patients47). Furthermore, L-carnitine has been used extensively to treat pediatric epilepsy, inborn errors of metabolisms, cardiomyopathy, and apnea14,48-50). Currently, there is limited treatment available for patients suffering from perinatal asphyxia. There is no accepted medical treatment that can inhibit or repair neuronal cell damage due to HI in newborns. Our findings suggest that L-carnitine can protect against HI injuries in fetuses or newborns. Clinical trials will be necessary, since the present study did not evaluate the exact doses and pharmacokinetics of L-carnitine in a clinical setting, or perform a detailed safety profile.
The present findings demonstrate that OGD induces necrosis and apoptosis in cultured neurons compared with controls. L-carnitine treatment reduced OGD-induced apoptosis and attenuated necrotic cell damage compared to the untreated, OGD-exposed control group. These results demonstrate that L-carnitine protects against apoptosis induced by HI injury.
In conclusion, L-carnitine protected rat primary cortical neurons under OGD conditions in vitro. Our experiments reveal the mechanisms by which L-carnitine rescues cells from death caused by OGD in vitro. Further investigations are required to evaluate L-carnitine as a therapeutic and preventive option for HI newborns.
 PDF Links
 PubReader
 PubMed
 Download Citation


