


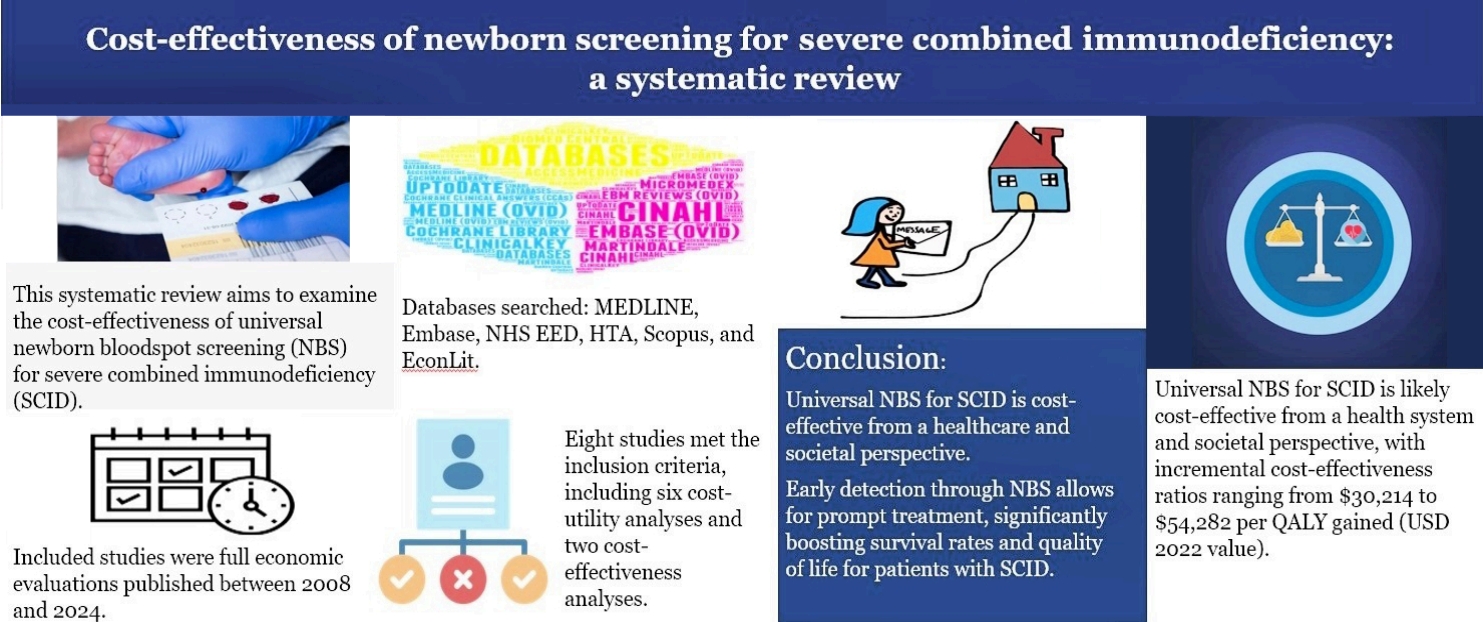
Graphical abstract. NHS EED, National Health Service Economic Evaluation Database; HTA, Health Technology Assessment.
Introduction
Severe combined immunodeficiencies (SCIDs) are a heterogeneous group of genetic disorders affecting T cell, B cell, and natural killer cell development [1] and resulting in impaired immune function. Infants with SCID are highly susceptible to severe and recurrent infections that can lead to morbidity and mortality [2,3]. SCID, a rare but life-threatening condition that affects the body’s ability to fight infections [4], is caused by a genetic defect that prevents the body from producing T cells, white blood cells that play a vital role in the immune system. Without T cells, people with SCID are extremely vulnerable to infection [5,6]; if left untreated, they often die of disease before reaching 1 year of age [7-9]. The diagnosis of SCID has historically relied on clinical symptoms, which leads to delayed identification until the onset of severe infection [10]. Nonetheless, healthcare systems can detect affected infants before their symptoms manifest by using newborn bloodspot screening (NBS) for SCID, thereby enabling timely intervention and improving long-term health outcomes [11].
The early detection and treatment of SCID can save lives [12]. In fact, its early diagnosis and timely treatment significantly affect a child’s future (mortality and morbidity) [13]. Early research on infant SCID screening yielded encouraging findings, indicating that its early identification and subsequent treatment can considerably lower morbidity and mortality rates [14-16]. Consequently, implementing neonatal screenings for SCID to quickly identify afflicted newborns and initiate life-saving therapies recently gained popularity. Nonetheless, an extensive evaluation of the cost-effectiveness of implementing such a screening program is indispensable, while the meticulous scrutiny of the associated expenses is imperative.
NBS programs have been instrumental to the detection and treatment of congenital disorders and subsequent prevention of mortality and morbidity. NBS involves screening, short-term follow-up, diagnosis, treatment, management, and evaluation components [17]. SCID is an important disorder that can be detected by NBS [7]. NBS for SCID is a simple and painless procedure. A small blood sample is collected from the newborn’s heel and tested for T cells [18]. Previous studies have concluded that routine SCID screening is feasible, effective [5,7], highly sensitive, and specific [11].
Several economic evaluations have assessed the cost-effectiveness of NBS programs for detecting SCID [14,19-22]. These studies employed various modeling approaches and considered different healthcare system contexts. However, discrepancies in study methodologies, assumptions, and cost parameters make it challenging to draw definitive conclusions from them regarding the overall cost-effectiveness of SCID screening. Thus, a comprehensive analysis synthesizing the existing evidence is essential to inform policymakers, healthcare providers, and payers about the economic implications of implementing newborn SCID screenings. This systematic review evaluated the methodological quality and completeness of the included information and compared the cost-effectiveness results of NBS for SCID across studies.
By understanding the economic implications of adopting an NBS program, a country’s health system can make informed decisions regarding its financial priorities and allocate the appropriate healthcare resources. An analysis of the cost-effectiveness of different screening strategies is helpful for selecting the most efficient and cost-effective screening strategy. SCID screenings can be optimized by the evaluation of various screening methods, cutoff values, and diagnostic procedures to maximize benefits while minimizing cost. This allows such systems to assess the financial implications of implementing a screening program that considers the costs of screening tests, diagnostic procedures, treatments, and long-term management. Moreover, it serves as a valuable tool for budget planning, reimbursement decisions, and the efficient use of healthcare resources. Using a cost-effectiveness analysis, decision makers can determine the long-term health benefits and potential financial savings of screening program implementation. However, systematic literature reviews that provide a narrative synthesis of the available evidence are currently lacking. Elsink et al. [23] reviewed the potential cost savings of the early diagnosis of primary immunodeficiency disease (e.g., common variable immunodeficiency, SCID). However, this was not a systematic review; moreover, it excluded several recent studies that reported the cost-effectiveness of NBS for SCID (e.g. [4,19,21,24],). This systematic review aims to bridge this research gap.
This review thoroughly assessed the cost-effectiveness of NBS for SCID. It aimed to provide a narrative synthesis of the economic consequences associated with SCID screening programs by summarizing the key findings of existing research. Its results will assist with the formulation of evidence-based policies and decision-making processes for adopting a universal NBS for SCID to ensure that healthcare resources are effectively deployed to enhance neonatal health outcomes. Overall, NBS for SCID is an intricate and diverse topic requiring careful study, and this study adds to the current body of information by reviewing many aspects that determine its cost-effectiveness.
Methods
This systematic review followed the Preferred Reporting Items for Systematic reviews and Meta-Analyses 2020 guidelines [25]. This review summarizes evidence of the cost-effectiveness of NBS for SCID, including the costs of screening, diagnostic testing, and subsequent treatments as well as long-term health outcomes and related healthcare expenses. The details of its methodology are provided in the following subsections.
1. Search strategy
A search strategy was formulated to identify the relevant studies. Multiple electronic databases were searched, including MEDLINE, Embase, NHS Economic Evaluation Database, Health Technology Assessment, Scopus, and EconLit. The details of the search keywords and strategy are presented in Supplementary Tables 1 and 2. The search records from all databases were imported into EndNote (ver. 20; Clarivate, London, UK). Duplicate records were removed using EndNote, Covidence (Veritas Health Innovation Ltd., Australia), and Rayyan (Qatar Computing Research Institute, Qatar), while duplicate data were imported into Rayyan for screening [26]. The search was conducted in September 2023. Two authors also manually searched the reference lists of the retrieved studies to identify any omitted studies.
2. Inclusion and exclusion criteria
Full economic evaluations, including cost-minimization, cost-effectiveness, cost-benefit, and cost-utility analyses, were included in this systematic review. Peer-reviewed published articles and relevant studies from the gray literature published in English from January 2008 to August 2023 were also included. Studies conducted before 2008 were excluded because NBS for SCID and severe T-cell lymphopenia using the T-cell receptor excision circle (TREC) assay was initiated in Wisconsin in 2008, followed by Massachusetts in February 2009 [27]. Systematic reviews, narrative literature reviews, conference abstracts, commentaries, editorials, study protocols, and methodological articles were also excluded.
3. Study selection process
The study selection process comprised 2 steps: screening of the titles and abstracts followed by screening of the full texts of the included studies in the first stage against the inclusion and exclusion criteria. Two independent reviewers reviewed the titles and abstracts of the duplicate records against the inclusion and exclusion criteria. The full texts of the selected studies whose abstracts and titles met the inclusion criteria were retrieved for further screening. Subsequently, the same researchers independently screened the full-text of each retrieved study to determine review eligibility. Any disparities in judgment were addressed through discussion and resolution and, if necessary, resolved by a third researcher. The exclusion rationale was documented in each case.
4. Data collection and extraction
A standardized data extraction form was created to gather pertinent data from the included studies. The extraction form included details such as study characteristics (e.g., authors, publication year), study design, perspective (e.g., healthcare system, society), screening strategies and costs, health outcomes (e.g., life-years gained, quality-adjusted life-years [QALYs] gained), incremental cost-effectiveness ratios, and sources of uncertainty. Owing to diversity in the study methods, perspectives, and outcome measures among the included studies, a narrative synthesis of the results was conducted. Data from the included studies were combined to thoroughly summarize the cost-effectiveness findings and major variables affecting the results and are shown in tables, figures, and descriptive analyses. The results are then explored and suggestions for further study and policy concerns provided.
5. Quality assessment
Reporting quality was evaluated using the Consolidated Health Economic Evaluation Reporting Standards (CHEERS) checklist, a 28-item tool that lays a foundation for critical evaluation without determining an overall quality score with theoretical support [28].
Results
1. Search results
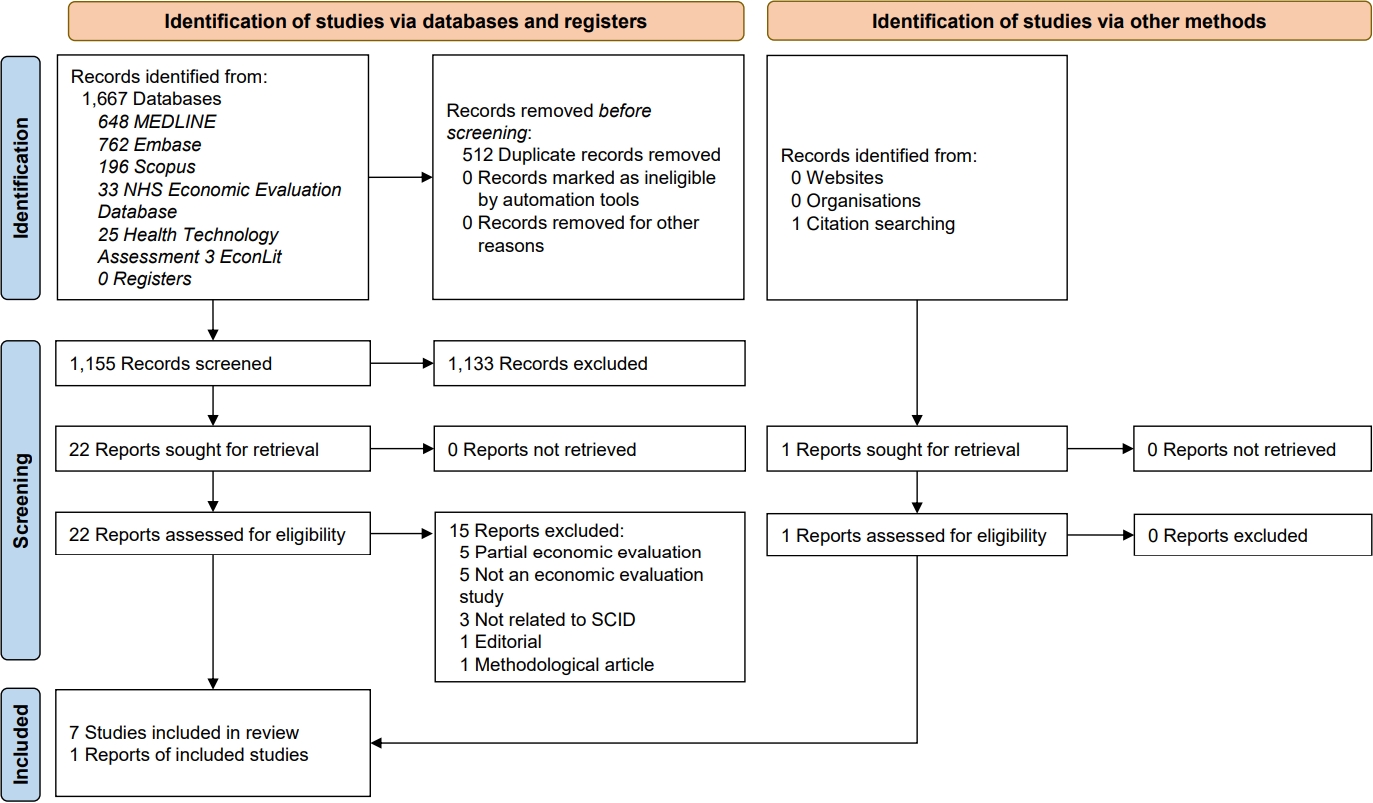
A total of 1,667 studies were initially identified (Fig. 1). Upon the removal of duplicates, 1,155 studies remained for the title and abstract screening. Among them, 1,133 were excluded because they did not align with the study’s scope or inclusion criteria. Twenty-two studies were fulltext reviews. However, 15 were excluded for reasons such as including only a partial economic evaluation (n=5), not being an economic evaluation study (n=5), not focusing exclusively on SCID (n=3), being an editorial (n=1), or being a methodological paper (n=1). In addition, one study was retrieved from the reference list of an included study. Finally, 8 studies were included in this review [4,14,18-21,24,29].
2. Study characteristics
The study characteristics are summarized in Table 1. A total of 8 studies were identified that matched the predefined inclusion criteria. Regarding study type, 6 studies were cost-utility analyses [4,18-21,24,29] and 2 were cost-effectiveness analyses [14,29]. Three studies used decision-tree models as the cost-effective model structure, 3 used the Markov model, and 2 used alternative modeling techniques. Six studies used a health system perspective, whereas 2 used a societal perspective. The time horizon differed among the studies: 3 were ≤5 years, 2 were 60–70 years, 3 were a lifetime, and 2 were unreported. Two studies used 5- and 60-year time horizons [20,24]. One study used QALYs gained and life-years saved [4] as health effectiveness measures, while 5 reported QALYs gained [18-21,24] and 2 reported life-years saved [14,29]. Three studies reported TREC screening test cutoff values [18,19,21]. None of the 8 studies originated from middle- or low-income nations (all were conducted in high-income countries).
3. Cost-effectiveness results
The cost-effectiveness data of the included studies are shown in Table 2. Several studies did not explicitly specify the years associated with the reported costs [14,24]. In this review, we assumed that the year preceding the publication date corresponded to the year associated with the costs. Furthermore, although Shih et al. [24] used a pilot population-based screening program in Australia to model cost-effectiveness, the incremental cost-effectiveness ratio (ICER) was reported in United States dollars (USD).
The ICER ranged from $30,214–$54,282 (USD 2022 value). Chan et al. [4] reported an ICER of $27,907 ($38,146 in 2022). However, Bessey et al. [19] reported an ICER of £18,222 ($30,214 in USD 2022 value). An ICER of $35,311 USD ($40,267 in USD 2022 value) was reported by Ding et al. [14] Van den Akker-van Marle et al. [21] recorded an ICER of €44,300 ($54,282 in 2022), whereas Shih et al. [20] and Shih et al. [24] reported ICER values of $33,600 ($34,295 in USD 2022). Van der Ploeg et al. [18] estimated an ICER of €33,400 (or $46,885 in USD 2022 value). The lowest ICER was reported by Health Partners Consulting Group [29] to be $30,409 (or $24,211 in USD 2022).
4. Key outcomes in the included studies
Bessey et al. [19] concluded that the ICER for SCID screenings would be £18,222 and the use of NBS would lower SCID mortality from 8.1 to 1.7 instances per screening year. Nonetheless, the results were sensitive to several parameters, such as screening test cost, incidence of SCID, disbenefit to healthy individuals, and false-positive cases (Tables 3 and 4). This study indicated that screening for SCID at £20,000 per QALY is likely financially advantageous.
Chan et al. [4] compared universal screening for SCID with symptom-based detection using USA data. The authors found that, over a 70-year time horizon, the average cost per infant was $8.89 without screening and $14.33 with screening. The universal screening program resulted in a gain of 880 life-years and 802 QALYs at a cost of approximately $22.4 million per year. A sensitivity analysis revealed that illness incidence and screening test specificity were key elements. The study concluded that NBS for SCID is cost-effective for enhancing the lives of kids with SCID at an anticipated screening cost of $4.22 per newborn.
Ding et al. [14] reported that NBS for SCID in Washington State is cost-effective and showed a positive net economic benefit (using values of $4.2 and $9.0 million per death averted). The decision analysis model projected a higher cost-effectiveness ratio of $35,311 per life-year saved and decreased mortality rates, and more SCID cases were identified through screenings. The cost-effectiveness and positive net benefit of NBS for SCID were supported by the sensitivity analysis. The Health Partners Consulting Group [29] investigated the cost-effectiveness of incorporating SCID screenings into New Zealand’s newborn metabolic screening program. The study concluded that the addition of the SCID screening was cost-effective at an estimated NZ$30,409 annually (Tables 3 and 4).
Shih et al. [20] examined the cost-effectiveness and budget impact of an NBS program for SCID (Tables 3 and 4). Using a Markov model simulation, the study concluded that if every newborn in the population was screened and treated for SCID using early hematopoietic stem cell transplantation (HSCT), 95 QALYs could be gained per 100,000 newborns, resulting in USD 8.6 million in cost savings. In a similar study, Shih et al. [24] investigated the cost-effectiveness of NBS for SCID in Australia using a pilot population-based screening program. The analysis compared 2 strategies: NBS for SCID and treatment with early HSCT versus no NBS and treatment with late HSCT. The ICER (reported in USD) for universal NBS for SCID over a 60-year period was $33,600 per QALY, resulting in a gain of 10 QALYs at a cost of $0.3 million. The sensitivity analysis revealed that most of the modeled ICER values are economically viable. Based on clinical and financial factors, this study suggests adding SCID screenings to the present NBS program in Australia.
Van den Akker-van Marle et al. [21] used real-life data to evaluate the cost-effectiveness of different NBS strategies for SCID in the Netherlands (Tables 3 and 4). The cost of SCID testing per child is estimated at €6.36, with diagnostic costs ranging from €985–€8,561 per child. Depending on the screening strategy, the cost-effectiveness ratio varied from €41,300–€44,100 per QALY. According to the authors, the use of real-life versus hypothetical data resulted in less favorable cost-effectiveness estimates, highlighting the importance of using real-life data to ensure model accuracy. In another study conducted in the Netherlands, van der Ploeg et al. [18] showed that early detection through screening decreased SCID-related deaths and increased QALYs. Total healthcare costs, including screening, diagnostics, and treatment, were higher with screening, resulting in a cost-to-utility ratio of €33,400 per QALY. Hence, this study concluded that NBS for SCID may be cost-effective.
Table 3 shows the characteristics of the included studies that assessed the cost-effectiveness of NBS for SCID. The included studies were congruent in terms of primary objectives, target populations, and measured outcomes. Nevertheless, noteworthy interstudy variations were observed in geographical settings, structural models, time horizons, discount rates, and currencies.
Table 4 summarizes the key findings of the included studies, which indicated that incorporating NBS for SCID is cost-effective (vs. no screening) for different ranges of willingness-to-pay thresholds in different countries. However, these studies also identified several sources of uncertainty.
5. Sources of uncertainty reported in the studies
The included studies identified several sources of uncertainty that could have affected their findings (Table 4). One key uncertainty is the change in mortality rates. Bessey et al. [19] indicated that SCID mortality rates change over time, making it difficult to estimate the number of deaths that can be prevented through NBS. Moreover, the identification of children with non-SCID T-cell lymphopenia adds to this uncertainty. T-cell lymphopenia can also occur under conditions other than SCID, making it difficult to distinguish between true-positive cases and those with different underlying disorders [19].
Three of the 8 included studies mentioned that the specificity of the screening test or false-positive rate were also sources of uncertainty [4,18,19]. A screening test with high specificity can accurately identify infants with SCID, minimizing the number of false positives. However, varying test accuracies affect the overall effectiveness and cost-effectiveness of screening programs [4,19].
The incidence of SCID is uncertain because of its relative rarity [4,20,24,29] (Table 4). Thus, accurately estimating the number of newborns with SCID is crucial for assessing the cost-effectiveness of such screening programs. Similarly, small populations and pilot projects introduce uncertainty [21]. When managing a small sample size, statistical variability can affect the reliability of the results. Moreover, discount rate was identified as a source of uncertainty in cost-effectiveness analyses [20,24,29]. Finally, studies have reported that the treatment cost is an important source of uncertainty [14,21,29]. These 2 studies indicated that test affordability determines the cost-effectiveness of SCID screening programs.
6. Methodological quality assessment
Methodological quality was assessed in the studies that met the inclusion criteria [28]. Twenty-eight items were divided into 6 categories: title, abstract, introduction, methods, results, and discussion (Table 5). Studies were labelled "Y" if they fulfilled and "N/R" if they did not fulfil the criteria listed in the CHEERS statement. Those studies with partial or inconclusive information were labelled "P." A score of 1 was assigned if the study reported the item, 0.5 if it partially reported it, and 0 otherwise. Following Fatoye et al. [30], studies that scored ≥75% were considered of high quality, while those that scored <75% were considered of poor quality. The total CHEERS checklist scores for each included study are presented in Table 5. All of the included complete economic evaluation studies scored ≥75%.
Discussion
This review synthesized the key evidence of the cost-effectiveness of NBS for SCID. Previous studies concluded that early identification (through NBS) and treatment led to better health outcomes among patients with SCID [11,15,31]. Evaluating the cost-effectiveness of NBS programs is crucial, especially for rare diseases such as SCID for which available data are limited for prevalence, natural history, and treatment response. This narrative review examined recently implemented SCID screening programs in the US and Europe and provided valuable insights into the cost-effectiveness of NBS programs in different countries. By synthesizing data from previous studies, this study addressed important knowledge gaps and identified areas of uncertainty, thereby improving the decision-making process surrounding SCID screenings.
The synthesis of the studies included herein indicated that universal NBS for SCID is highly likely to demonstrate cost-effectiveness from health system and societal perspectives. None of the included studies were randomized controlled trials. These cost-effectiveness findings consistently apply across diverse country settings such as the US, the Netherlands, the UK, and France. In this review, all reported ICER values were standardized to a common currency value (to ensure comparability), with the ICER per QALY ranging from $30,214–$54,282 (USD 2022 value). The included studies employed different screening costs per newborn, used varied time horizons, and were conducted during different time periods [4,24]. Despite these differences, all studies concluded that the NBS program for SCID is cost-effective for various willingness-to-pay thresholds. Chan et al. [4] concluded that there is a 78% likelihood of NBS for SCID being preferred if society is willing to pay $100,000 per QALY. According to Shih et al. [24], more than half of the simulated ICER values met the common willingness-to-pay threshold of A $50,000 per QALY (USD 35,000 per QALY). Elsink et al. [23] previously concluded that NBS for SCID is cost-effective at £20,000 per QALY.
Multiple empirical studies, including those by Chase et al. [11], Kubiak et al. [32], van der Ploeg et al. [18], and Clement et al. [2], consistently indicated that the early detection of SCID shortly after birth followed by prompt treatment before symptom onset significantly improves an infant's chances of survival. Furthermore, Clement et al. [2] concluded that the medical costs associated with HSCT were higher when performed after versus before 3 months of age. Another study showed that a shift from late to early transplantation resulted in savings in transplantation expenses (€103,900) and an overall improvement in health status throughout the remaining lifetime, resulting in reduced costs (€53,700) [18]. Shih et al. [20] demonstrated that early HSCT dominated late HSCT, indicating that the former yielded an additional 1.53 QALYs per patient with SCID accompanied by a cost savings of USD 122,509 per child with SCID over a 5-year projection. Over a 60-year time horizon, early HSCT outperformed late HSCT, providing an additional gain of 6.14 QALYs per patient diagnosed with SCID and resulting in a per-patient savings of USD 136,914.
Screening test sensitivity and specificity also affect an NBS program’s overall cost-effectiveness [4]. Notably, SCID newborn screenings showed excellent diagnostic performance with high sensitivity and specificity [11,14]. High specificity minimizes the need for excessive diagnostic testing, whereas low false-positive findings (high sensitivity) indicate that a significant percentage of afflicted newborns will be appropriately diagnosed. These reasons substantiate the unanimous conclusion drawn by all studies highlighting the cost-effectiveness of the NBS program for SCID.
The current review observed that the included studies analyzed cost-effectiveness using different cutoff values for the TREC screening test and SCID incidence rates of 1:49,000 by Bessey et al. [19], 1:75,000 by Chan et al. [4], 1:50,000 by Shih et al. [24], and 1:58,000 by Van der Ploeg et al. [18]. The variations in cutoff values and incidence rates may have contributed to the variations in ICER per QALY among the included studies.
Among the ICER values reported by the included studies, van den Akker-van Marle [21] reported the highest ICER (per QALY gained) among all studies ($54,282 as per USD 2022 value) based on real-life data from a prospective implementation study in the Netherlands. A similar study in the Netherlands in 2019 reported $46,885 (ICER of USD 2022 value). Van den Akker-van Marle et al. [21] concluded that cost analyses based on real-life data incur higher costs and, therefore, have worse cost-effectiveness estimates than those based on hypothetical data, suggesting the need to validate model assumptions using real-life data.
The included studies highlighted several sources of uncertainty that may have affected their cost-effectiveness findings. One major uncertainty arises from the changes in SCID mortality rates over time, making it challenging to estimate the number of potential deaths prevented through screening. T-cell lymphopenia with conditions other than SCID also introduces uncertainty in the accurate identification of true-positive cases. Screening test specificity, or false-positive rate, was determined as another source of uncertainty in 4 of the included studies. Screening test accuracy influences the overall and cost-effectiveness of the NBS program. The incidence of SCID is uncertain because of its rarity, and estimating the number of affected newborns is crucial for assessing screening cost-effectiveness. Furthermore, studies with small populations and pilot projects introduced uncertainty due to statistical variability. Finally, 2 studies emphasized the importance of screening test cost as a significant source of uncertainty.
This study has certain limitations. First, the small number and geographic scope of the eligible studies limit its conclusions. Second, it included only English-language studies, and none were randomized controlled trials. And finally, significant differences in study design and outcome measures limited its ability to conduct a meta-analysis, synthesize the data, and interpret the results.
A comprehensive analysis of NBS for SCID is crucial because it facilitates informed decision-making by assessing the justifiability of its implementation or expansion. This study’s findings provide information about direct testing and treatment costs, potential long-term healthcare cost savings, impacts on patient and family quality of life, and the societal benefit of preventing premature death. The results also highlight the uncertainties related to timely diagnosis and treatment and the consideration of ethical implications such as the potential for false-positive results.
Policymakers should focus on improving data collection processes and enhancing statistics on the incidence, mortality, hospital stay duration, and family history of SCID specific to each country [19]. It is also important that, while measuring screening test costs, future studies consider additional administrative services, sample collection or follow-up, and laboratory test costs in cost-effectiveness analyses [4]. Furthermore, studies of the cost-effectiveness of NBS for SCID should consider the treatment costs for patients with SCID who lack sibling donors as well as those for long-term medical treatment (gamma globulin therapy) or subsequent transplantation [14]. Future research should also consider that real-world estimates differ substantially from hypothetical estimates. Further investigations including significantly larger cohorts is crucial to advancing our knowledge in this area [21]. Finally, the future development of new treatments for SCID (e.g., gene therapy) may have a major impact on cost-effective analyses of NBS for SCID [18]. Thus, future cost-effectiveness analyses should consider this aspect.
Expert opinion
1. NBS for SCID: a cost-effective approach that improves outcomes
NBS for SCID can improve the treatment of this rare but critical illness. Early detection through NBS allows prompt treatment and significantly boosts the survival rates and quality of life of patients with SCID. Furthermore, studies across diverse countries have demonstrated the high cost-effectiveness of NBS programs for SCID. These programs provide long-term financial benefits to the healthcare system by preventing complications and facilitating latestage treatments. However, its widespread adoption has been hindered by several obstacles. First, as SCID is rare, obtaining accurate data on its incidence and mortality rates to calculate NBS program cost-effectiveness is difficult. Second, inconsistent cost estimates can result from differences in screening test cutoff values and disparities between actual data and theoretical models.
Addressing these limitations requires a multipronged approach. First, an enhanced data collection for SCID across regions that encompasses the incidence, mortality, treatment costs, and family history is vital for cost-effectiveness analysis accuracy. Second, future studies should incorporate all administrative and laboratory costs associated with NBS for SCID to provide a more comprehensive financial picture. Third, improvements in test specificity to minimize false positives can optimize resource allocation and reduce unnecessary procedures. Fourth, the development of gene therapies and other novel treatments for SCID could significantly affect future cost-effectiveness analyses. Finally, large-scale studies with diverse populations are crucial for validating the current findings and generating more generalizable data.
The wider adoption of NBS for SCID is expected in the next 5 years as cost-effectiveness data accumulate and uncertainties are addressed. Standardized methodologies for calculating NBS-related costs will facilitate informed decision-making. Moreover, future research should explore the long-term cost-effectiveness of NBS by considering treatment requirements. NBS for SCID is poised for significant advancement over the next 5 years. There is likely to be a shift from the analysis of T-cell markers to multifactorial assessments that include genetic markers and broader immune parameters. Moreover, technological refinements are expected to increase accuracy and reduce false-positive rates, whereas early stratification may facilitate treatment prioritizing. Future curative interventions may benefit from the integration of nascent gene editing technologies. Global implementation and cost-effectiveness are also vital considerations within ethical discussions related to the use of genetic information.
In conclusion, NBS for SCID represents a significant leap forward in early patient diagnosis and improved outcomes. By overcoming the current limitations and embracing advancements, we can ensure that this cost-effective approach becomes standard practice, thereby saving lives and transforming the SCID management landscape.
Conclusion
This review summarizes the evidence of the cost-effectiveness of NBS for SCID. The present results consistently demonstrate that universal NBS for SCID is cost-effective in countries with diverse healthcare systems. The early detection and treatment of SCID can significantly improve health outcomes and reduce related costs. However, uncertainty persists regarding mortality rates, test specificity, and morbidity rates that affects cost-effectiveness estimates. Future studies should focus on data collection processes, cost considerations, and new treatment efficacy. Moreover, a comprehensive randomized controlled trial is warranted to prevent bias. This review provides valuable insight for policy development and highlights the need for further research on NBS for SCID.
 PDF Links
 PubReader
 ePub Link
 PubMed
 Download Citation


