Article Contents
| Clin Exp Pediatr > Volume 67(4); 2024 |
|
Abstract
Background
Purpose
Methods
Results
Supplementary materials
Supplementary Table 1.
Supplementary Table 2.
Supplementary Table 3.
Supplementary Fig. 1.
Footnotes
Acknowledgments
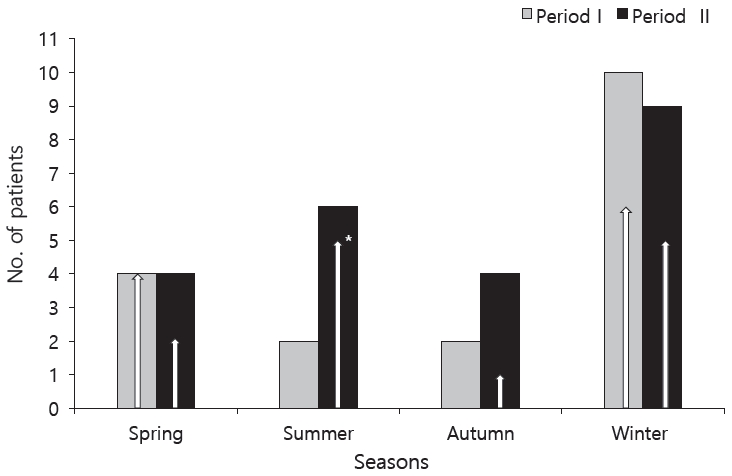
Fig. 1.

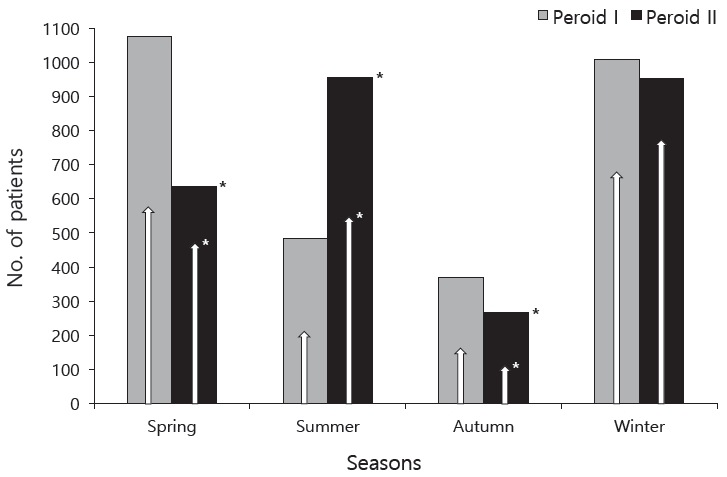
Fig. 2.

Fig. 3.

Table 1.
| Variable | Period I | Period II | Total | P value |
|---|---|---|---|---|
| Otherandunspecifiedconvulsions(R568) | 613 | 521 | 1,134 | |
| CwG (% of R568) | 18 (2.9) | 23 (4.4) | 41 (3.6) | 0.184 |
| Viruses proven | 16 (88.9) | 22 (95.7) | 38 (92.7) | 0.573 |
| Norovirus GII | 10 (55.6) | 13 (56.5) | 23 (56.1) | 0.951 |
| Enteric adenovirus | 1 (5.6) | 7 (30.4) | 8 (19.5) | 0.059 |
| Sapovirus | 2 (11.1) | 1 (4.3) | 3 (7.3) | 0.573 |
| Astrovirus | 1 (5.6) | 1 (4.3) | 2 (4.9) | 1.000 |
| Group A rotavirus | 2a (11.1) | 0 (0) | 2 (4.9) | 0.187 |
| Norovirus GI | 1a (5.6) | 0 (0) | 1 (2.4) | 0.439 |
| Viruses unknown | 2 (11.1) | 1 (4.3) | 3 (7.3) | 0.573 |
Values are presented as number of cases (%).
CwG, benign convulsions with mild gastroenteritis; GII, genogroup II; GI, genogroup I.
The 6-year study period was divided into periods I (March 2017 to February 2020, before COVID-19) and II (March 2020 to February 2023, during COVID-19).
The symptomatic diagnostic code R568 indicates “other and unspecified convulsions” based on the Korea Informative Classification of Diseases. [18]
CwG is grouped into the diseases coded by R568.
P values indicate comparisons between periods I and II.
Table 2.
Values are presented as number of cases (%).
Publicly available data from the Korea Disease Control and Prevention Agency. [17]
Viruses were detected in 29.3% (n=2,936/10,036) and 30.3% (n=2,810/9,273) of the stool samples during periods I and II, respectively (P=0.111).
P values indicate comparisons between periods I and II.
Boldface indicates a statistically significant difference with P<0.05.
Table 3.
| Characteristic | Norovirus GII (n=23) | Enteric adenovirus (n=8) | Total CwG (n=41) | P value |
|---|---|---|---|---|
| Age (mo) | 18.0 (15.0–22.0) | 15.5 (12.5–18.25) | 17.0 (14.0–22.0) | 0.132 |
| Female sex | 14 (60.9) | 4 (50.0) | 24 (58.5) | 0.674 |
| Follow-up period (day) | 21.00 (9.50–278.50) | 9.00 (3.50–131.75) | 18.50 (8.75–321.50) | 0.107 |
| Enteric symptoms | ||||
| Present at the first seizurea) | 21 (91.3) | 8 (100.0) | 36 (87.8) | 0.740 |
| Interval to seizure onsetb) | 2.0 (1.0–3.0) | 1.5 (1.0–2.0) | 2.0 (1.0–2.5) | 0.437 |
| Diarrhea | 17 (73.9) | 8 (100.0) | 34 (82.9) | 0.295 |
| Vomiting | 18 (78.3) | 5 (62.5) | 28 (68.3) | 0.520 |
| Number of seizures | 2.0 (1.0–4.0) | 2.0 (1.25–3.75) | 2.0 (1.0–3.5) | 0.912 |
| Seizure duration (min) | ||||
| <5 | 23 (100.0) | 7 (87.5) | 39 (95.1) | 0.611 |
| 5–15 | 0 (0) | 1 (12.5) | 2 (4.9) | 0.611 |
| Interval to the last seizurec) (hr) | ||||
| <6 | 15 (65.2) | 4 (50.0) | 26 (63.4) | 0.550 |
| 7–12 | 5 (21.7) | 4 (50.0) | 11 (26.8) | 0.255 |
| 13–24 | 1 (4.3) | 0 (0) | 1 (2.4) | 0.877 |
| >25 | 2 (8.7) | 0 (0) | 3 (7.3) | 0.740 |
| Seizure type | ||||
| Bilateral tonic-clonic | 16 (69.6) | 5 (62.5) | 28 (68.3) | 0.774 |
| Bilateral tonic | 7 (30.4) | 1 (12.5) | 9 (22.0) | 0.464 |
| Bilateral clonic | 0 (0) | 1 (12.5) | 1 (2.4) | 0.611 |
| Focal nonmotor | 0 (0) | 1 (12.5) | 3 (7.3) | 0.611 |
| EEG abnormalitiesd) | ||||
| Slowing | 8 (34.8) | 1 (12.5) | 10 (24.4) | 0.437 |
Values are presented as median (interquartile range) or number of cases (%).
GII, genogroup II; CwG, benign convulsions with mild gastroenteritis; EEG, electroencephalography.
P values indicate comparisons between norovirus GII- and enteric adenovirus-associated CwG.


 PDF Links
 PubReader
 ePub Link
 PubMed
 Download Citation


