


Graphical abstract COVID-19, coronavirus disease 2019.
Introduction
The coronavirus disease 2019 (COVID-19) pandemic has posed an unprecedented public health challenge globally. COVID-19 pandemic has led many countries to issue restrictive measures including school closures, affecting billions of students across the world [1]. YIn children, COVID-19 has a range of presentations, from an asymptomatic to an acute respiratory infection requiring hospitalization [2]. Yet, the severity in younger age group is lower than that of older population, thus, the net benefit of school closure in aim to mitigate COVID-19 outbreak has not been established [3].
As COVID-19 transmission depends on factors such as demography, comorbidity, and pattern of daily activity, a better understanding of the societal factors of the infection in students would be useful in planning prevention strategies [4]. South Korea has faced number of public health measures to mitigate from COVID-19 transmission in schools and in communities [5]. Although the schools were being closed in the beginning of the pandemic, the sequential opening and normalization has been made during the second year of pandemic response [6]. However, no studies have yet focused on societal factors associated with COVID-19 transmission in student population.
In this study, we aimed to characterize the factors of student population associated with COVID-19 transmission in metropolitan city of Seoul, South Korea.
Methods
The Seoul Metropolitan covers 605.24 km2 and had a population of approximately 9 million (9,453,878) in 2021. It consists of 25 districts (gu) [7]. The student population is comprised of children attending kindergarten or all schools (K-12) in Korea and is estimated at 1.1 million (1,136,363) in 2021, around 12% of the total community population [7].
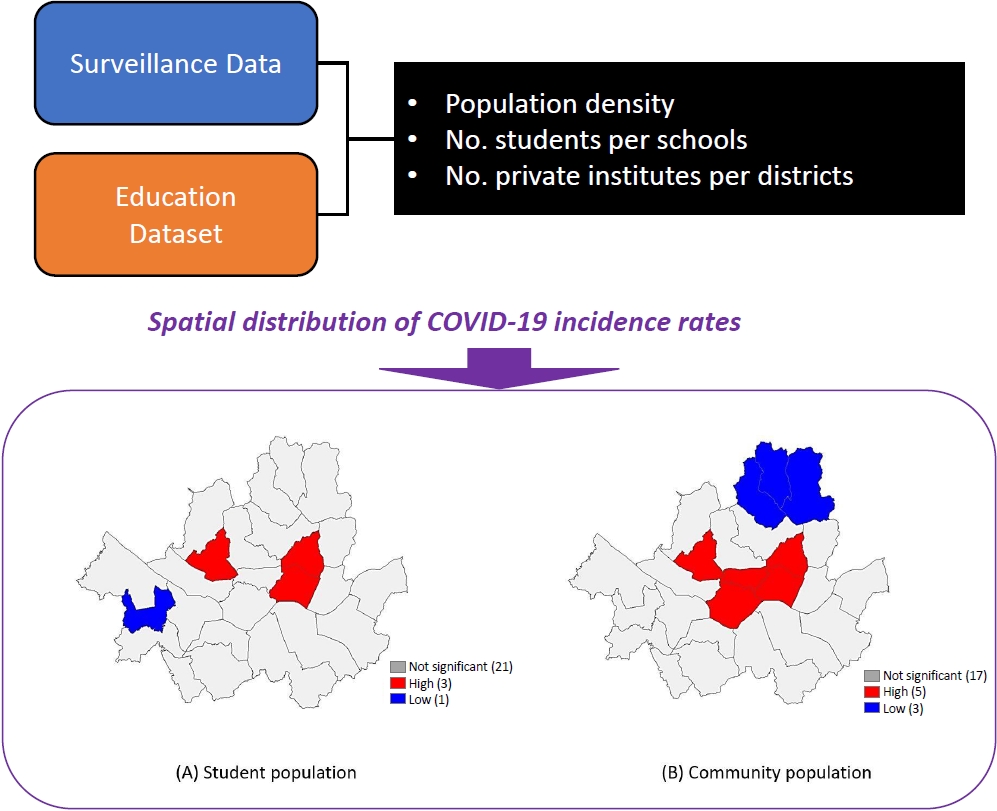
We analyzed the epidemiological data on laboratory-confirmed (reverse transcription polymerase chain reaction) COVID-19 cases collected by the Korea Disease Control and Prevention Agency and Ministry of Education during the period from January 2020 to October 2021. We calculated the COVID-19 attack rate by age in each district using midyear population data from the Korean National Statistics Office. Sociodemographic data on population density, number of students per kindergarten, elementary school, middle school, and high school classes, number of private academies per 1000 persons for each district were retrieved.
To examine the spatial distribution of incidence rates among the districts and their spatial autocorrelation, we visualized the district incidence rates using a 10-color scale and calculated the global Moran’s index to measure spatial autocorrelation based on locations and to evaluate whether the pattern expressed is clustered, dispersed, or random. To find local indicators of spatial association, the local Moran’s index and Getis-Ord’s index, which display ‘hot spots’ (high values next to high) and ‘cold spots’ (low values next to low) clustering to identify local clusters and local spatial outliers, were calculated.
Spatial regression analysis was performed to find sociodemographic predictors of the COVID-19 attack rate at the district level.
We used different sociodemographic factors to predict the COVID-19 attack rates for the total population and the student population; population density, percentage of the aged 3–18 years old (students), percentage of the aged 30–59 years old (workers), percentage of foreign citizens were included as predictors of the attack rates for the total population; population density, attack rate of the aged 30–59 years old, number of students per class (kindergarten, primary-, middle-, and high school each), number of private academies per 100 persons, percentage of foreign citizens for the student population. The spatial lag and spatial error model are an extension of the traditional ordinary least square regression model that includes the spatial dependency of variables or errors in the model. The spatial lag model takes the following form:
Where values of the dependent variable in neighboring locations (WY) are included as an extra explanatory variable. The spatial error model takes the following form:
Where values of the residuals in neighboring locations (Wε) are included as an extra term in the equation.
We used GeoDa software (version 1.20, The University of Chicago, IL, USA) to visualize maps of incidence rates and local clusters and to conduct the spatial regression analyses. This study was reviewed and was approved by the Institutional Review Board (IRB) of Korea University Anam Hospital (IRB No. 2021AN0314).
Results
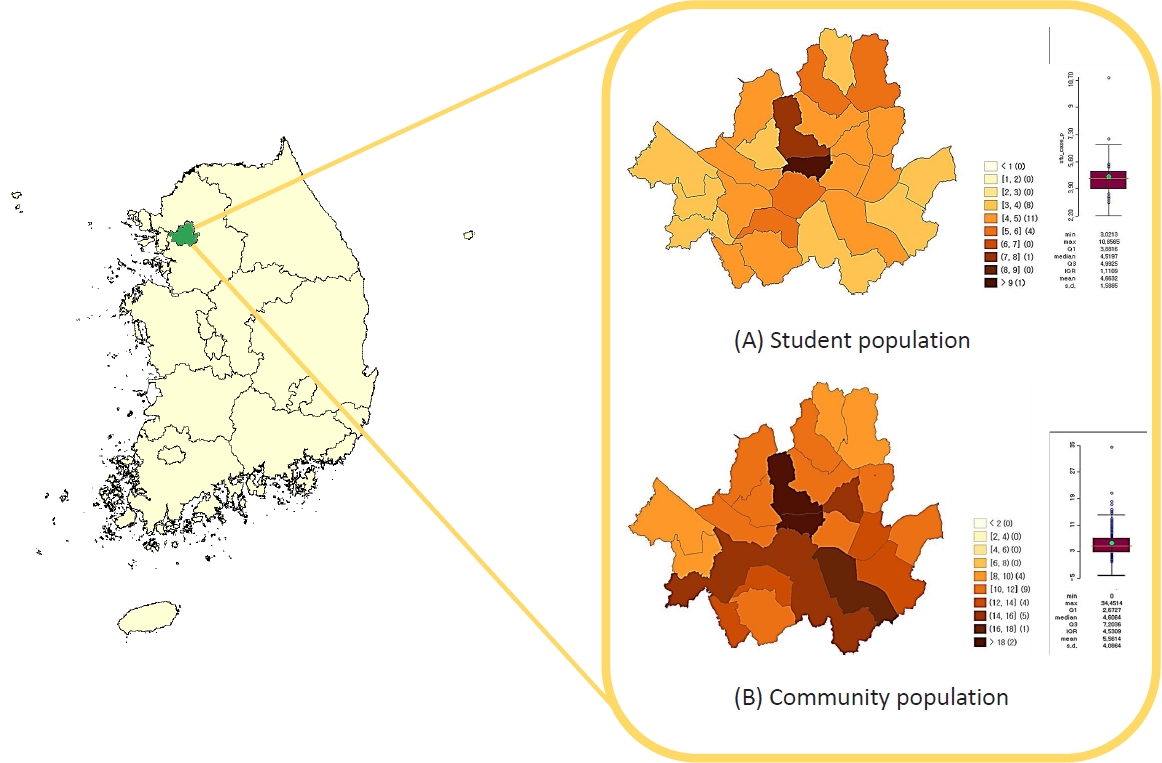
The weekly COVID-19 incidences among the total population of 116,374 and among the student population of 4,839 during the period from the 4th week in 2020 to the 44th week in 2021 (from 19 Jan 2020 to 26 Oct 2021) was noted in Seoul city. The COVID-19 incidence and attack rates among the student population and community population in the 25 districts during the monitored period were summarized (Table 1). Among the student population, Jung-gu (10.86 per 1,000) recorded the highest attack rate, followed by Jongno-gu (7.04 per 1,000), and Gangbuk-gu (5.48 per 10,000) (Table 1, Fig. 1A). Among the community population, Jung-gu (34.45 per 1,000) recorded the highest attack rate, followed by Jongno-gu (20.54 per 10,00), and Yongsan-gu (15.38 per 1,000) (Table 1, Fig. 1B). The highest attack rate of adults aged 30–59 years was in Jung-gu (38.44 per 1,000), followed by Jongno-gu (21.90 per 1,000) and Gangnamgu (18.35 per 1,000) (Table 2). The population density was the highest in Yangcheon-gu (26,661,98 persons/km2). The number of students per class ranged 17–27 persons in kindergarten, elementary, middle, and high schools (Table 2).
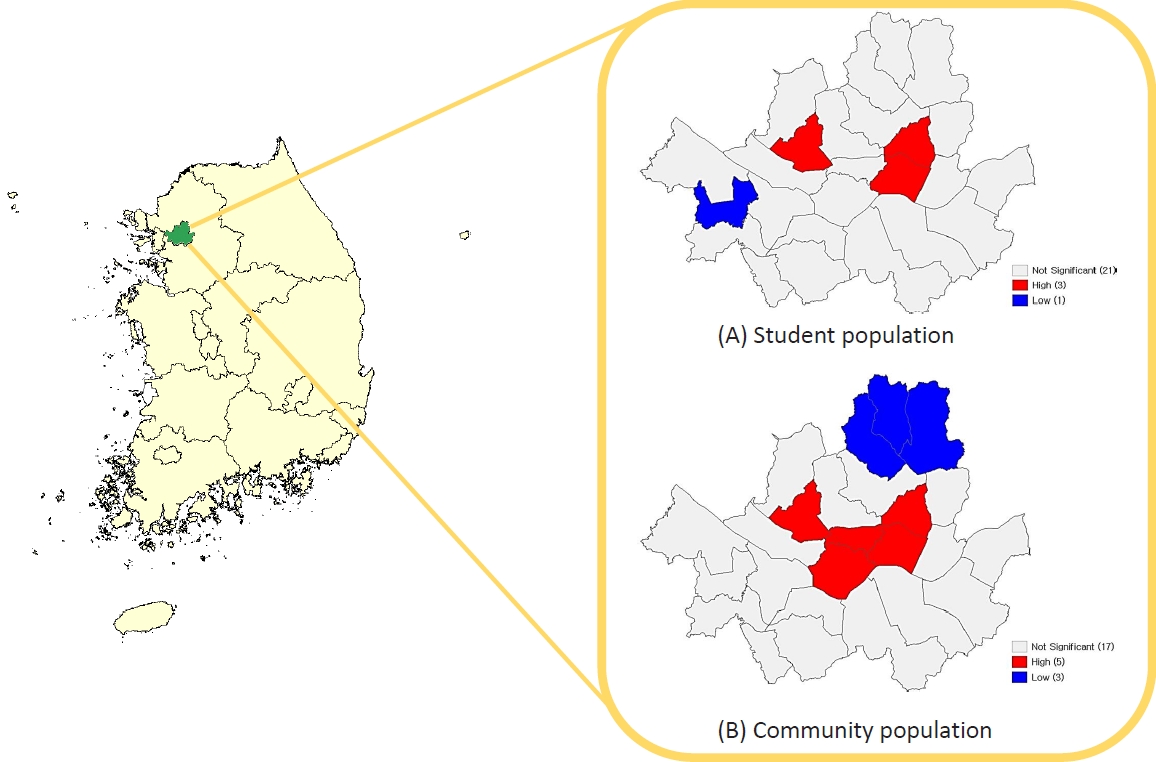
The global spatial correlation estimated by Moran’s I was 0.082 for the community population and 0.064 for the student population. This reflects that the student population was spatially less correlated than the total population. Spatial clustering, demonstrating local autocorrelation, was examined by local Moran’s index and Getis-Ord’s G and showed similar patterns with hot spots and cold spots. Among the student population, the hot spot was detected only in Dongdaemun-gu and the cold spot was detected in Yangcheon-gu (Fig. 2A). Among the community population, hot spots were detected in central area of Seoul including Jung-gu, Yongsan-gu, and Dongdaemun-gu, and cold spots were detected in northern area of Seoul including Gangbuk-gu, Dobong-gu, and Nowon-gu (Fig. 2B).
Attack rate of adults aged 30–59 years (P=0.049) was associated with increased risk of COVID-19 attack rates in students (Table 3), whereas the number of students per primary- (P=0.003) and middle- (P=0.030) schools’ class were inversely associated with risk of COVID-19 attack rates in students. According to the results from regression analysis, spatial error models, values of the residuals in neighboring locations being included as predictors, showed a better fit regarding the lowest Akaike information criterion.
Discussion
Incidence of COVID-19 in student population generally followed the burden of COVID-19 in the community surrounding schools in Seoul, South Korea 2020–2021. This study confirmed that the combination of locations at high risk of SARS-CoV-2 clusters (community at district level) may lead to COVID-19 clusters in student population. Our finding is supported by spatiotemporal analyses conducted in other countries. A study from the United States (US) showed that the correlations between urban centers were significant indicating that spreading was facilitated by travel between cities [8]. The central part of the city, with heavy commuter as it serves as business district and relatively smaller number of population residing, was shown to have the highest attack rate among all districts, as in line with this finding. Given that the school closure measures were uniformly practiced in all 25 districts in Seoul, our finding suggest that the community-onset severe acute respiratory syndrome coronavirus 2 (SARS-CoV-2) transmission was likely the cause of COVID-19 clusters in student population [6]. Unlike influenza pandemic, COVID-19 with its earliest onset in adult population, may have insignificant impact from nonpharmaceutical measures targeting children, including school closures [9].
We also found that the attack rate of adults aged 30–59 years in the community was correlated with SARS-CoV-2 in student population in the district. A previous spatial analysis in the US suggested that there are a variety of sociodemographic variables that are associated with the COVID-19 county-level incidence [10]. Also, another spatial distribution study from China suggested that the spatial distribution of COVID-19 cases was in nonrandom manner, with other external factors may play important role in the disease spread [10]. Adults aged 30–59 years would presumably the parents of student population aged 3–17 years, which can be partly explained by the direction of transmission of SARS-CoV-2 from adults to their children in the households [11].
We also found that the size of classrooms in schools were inversely correlated with the COVID-19 attack rate in schools. The number of students per classes are high in South Korea, though the number gets lower than previous years. Despite these changes, the size of classes does affect the epidemic spread in various models [12]. Another model finds a highly variable transmission cluster sizes in the classroom setting, with clusters ranging from 1 to 20 individuals in a class of 25, suggesting the result may vary according to the mitigation protocols [13]. The inverse association of number of students per class and attack rates in elementary and middle schools were observed. The plausible reasons could be that the high school students had more of school attendance and that they spend more time in schools compared to the elementary and middle school students. There had been standardized protocols developed in aim to contain schools from SARS-CoV-2 spread in Korea, and the transition to full-serviced education should be instituted for the best interest of the children.
This study has some limitations. First, we used administrative data which only contain basic epidemiological data about COVID-19 cluster events. Therefore, our finding should be interpreted with caution given the differences or trends in patients’ clinical data or symptoms was not available. Second, this study only monitored SARS-CoV-2 status with no information on the variant; therefore, the relationship between virus strains and age-specific incidence could not be elucidated. Despite these limitations, our findings suggest that student population is largely affected by the adult population or the surrounding community, not vice versa, which should be strongly reflected in the pandemic mitigation plan. One advantage of this study is that the existing epidemiological analysis platform in Korea contains data regarding COVID-19 clustering at a large scale, so that researchers can use these data to contribute to the evidence-based public health policy.
In summary, our analysis found that COVID-19 transmission in student population is more attributable to the community-level burden and attack rate in adult population. We recommend that the public health initiatives need to focus on targeting and tailoring initiatives that protect students from COVID-19 when there is high burden of infection in the community.
 PDF Links
 PubReader
 ePub Link
 PubMed
 Download Citation


