Warning: fopen(/home/virtual/pediatrics/journal/upload/ip_log/ip_log_2024-03.txt) [function.fopen]: failed to open stream: Permission denied in /home/virtual/pediatrics/journal/ip_info/view_data.php on line 82

Warning: fwrite(): supplied argument is not a valid stream resource in /home/virtual/pediatrics/journal/ip_info/view_data.php on line 83
Growth patterns of preterm infants in Korea

Volume 65(1); January

< Previous     Next >

Article Contents

Clin Exp Pediatr > Volume 65(1); 2022
Lim, Yoon, and Lee: Growth patterns of preterm infants in Korea

Abstract

With advancements in neonatal care and nutrition, the postnatal growth of preterm infants has improved; however, it remains an issue. Accurate assessments of growth using a standardized reference are needed to interpret the intrauterine and postnatal growth patterns of preterm infants. Growth in the earlier periods of life can contribute to later outcomes, and the refinement of postnatal growth failure is needed to optimize outcomes. Catchup growth occurs mainly before discharge and until 24 months of age, and very low birth weight infants in Korea achieve retarded growth later in life. Knowing an infant’s perinatal history, reducing morbidity rates during admission, and performing regular monitoring after discharge are required. Preterm infants with a lower birth weight or who were small for gestational age are at increased risk of poor neurodevelopmental outcomes. Furthermore, poor postnatal growth is predictive of adverse neurodevelopmental outcomes. Careful monitoring and early intervention will contribute to better development outcomes and national public health improvements.

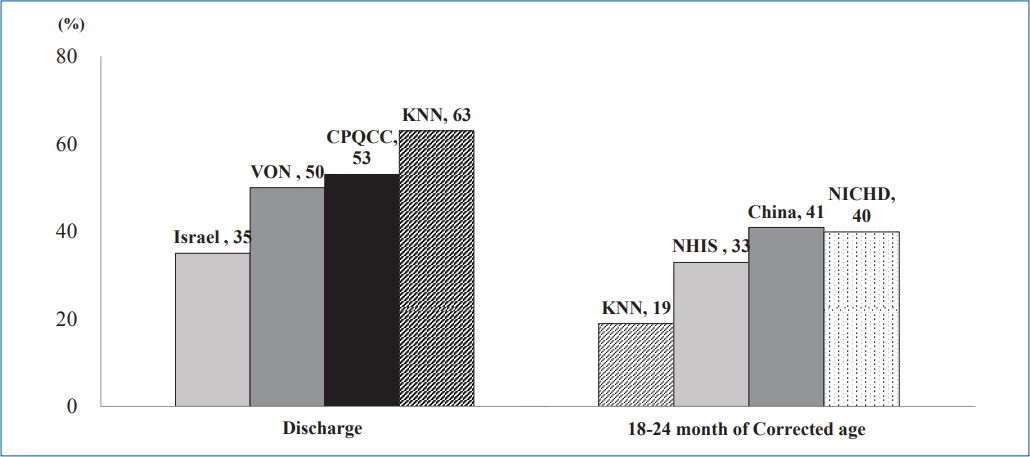
Graphical abstract. The incidence of poor growth (weight <10 percentile) in preterm infants. VON, Vermont Oxford Network; CPQCC, California Perinatal Quality Care Collaborative; KNN, Korean Neonatal Network; NHIS, national health insurance system in Korea; NICHD, National Institute of Child Health and Human Development.

Introduction

The recommendation to encourage preterm infants to grow in utero at a rate comparable to that of their age-matched peers is rather clear. However, their postnatal growth often does not achieve this goal. The percentage of infants with severe growth failure has decreased significantly over time. However, such improvements are insufficient. Various studies have examined the growth of preterm infants in Korea; however, few have focused on the data of preterm infants from a large-scale database. With advancements in neonatal care, the survival rates of premature infants in Korea have become comparable to those of medically advanced countries. Therefore, reviewing growth data for premature infants in Korea and comparing them with data from other countries can help improve the long-term growth and development and quality of life of premature infants in Korea.

Growth assessment

Neonatal growth charts that allow the calculation of precise z scores and percentiles were introduced in neonatology over the past decade. Growth standards are prescriptive and define how a population of children should grow if given optimal nutrition and health. Growth charts (references), on the other hand, describe a child’s growth at a certain point in time. Several charts and growth standards for interpreting intrauterine and postnatal growth patterns of infants have been introduced (Table 1), but their comparison is difficult due to age range variability and methodological problems.
Over 50 years ago, Lubchenco constructed the first intrauterine growth chart using birth records from the 1950s representing birth weight for gestational age at 24–42 weeks [1]. Olsen growth charts from the United States and Bertino growth charts from Italy assess appropriate for gestational age (AGA), small for gestational age (SGA), and large for gestational age status at a wide gestational age range of 22–23 to 42 weeks [2,3]. The Olsen growth chart included more diverse ethnicities [4]; however, it is limited because the sample included neonatal intensive care unit (NICU) admissions only, so they are known to perform relatively poor growth monitoring beyond 36 weeks of age.
The Fenton chart introduced fetal and infant growth reference data for 22–50 weeks in 2003 [5]. It was last updated in 2013 after a meta-analysis of 6 studies monitoring postnatal growth and revised to harmonize and continue using the World Health Organization (WHO) Growth Standard after 50weeks’ postmenstrual age [6]. However, it did not consider postnatal adaptations, especially by ignoring the physiological fluid loss that occurs in the first few days of life.
In 2014, the INTERGROWTH-21st Consortium published international postnatal growth standards for preterm infants 27–64 weeks’ postmenstrual age based on neonates with no major complications or risk factors or ultrasound evidence of fetal growth restrictions who were born to healthy mothers [7]. The INTERGROWTH-21st is a multicenter multiethnic population-based project that proposed growth patterns using a representative population sample from 8 geographical areas of the world. It aims to better adapt to premature growth of infants 24–33 weeks’ gestation. However, concerns remain that fetal growth parameters may differ among ethnicities and that population-based growth references for infants with the same genetic and environmental backgrounds should be used [8].
The Centers for Disease Control and Prevention growth charts for use in children from birth to 20 years were released in May 2000 based on the National Center for Health Statistics growth chart in 1977 with the addition of more recent comprehensive data and improvements in the statistical smoothing procedure [9]. These growth charts were based primarily on nationally representative survey data for healthy infants, excluded very low birth weight (VLBW) infants, were supplemented with limited data from other sources, and used a descriptive approach to generate a reference to describe the distribution of size for age in the United States.
In 2006, the WHO released international growth standards for children aged 0–59 months that are now accepted worldwide [10]. These standards include all children regardless of ethnicity and socioeconomic status and include those who were predominantly breastfed for at least 4 months and still breastfeeding at 12 months. However, the WHO growth charts, although recommended for preterm infants after term age, begin at term and do not assist preterm infant growth assessments prior to this age [6].
The Korean National Growth Chart (KNGC) was released in 2017 for the evaluation of body size and growth of Korean children and adolescents in private and public health clinics [11]. In children aged 0–35 months, a WHO growth chart was used with the recommendation of breastfeeding as the ideal nutritional supply for infants. For children and adolescents aged 3–18 years, height for age, weight for age, body mass index for age, weight for height, and head circumference (HC) for age charts were developed to overcome the limitations of the KNGC 2007 version.
In Korea, the Fenton growth chart is commonly used to assess preterm growth and promising for optimal preterm growth monitoring. After term-equivalent age is reached, the KNGC is widely used, although it is the same as the WHO chart for children younger than 3 years of age.

Postnatal growth during NICU admission

Among the 355 published preterm infant growth studies published since 2005, 19% showed extrauterine growth restriction (EUGR) or postnatal growth failure (PGF) rates mainly defined as being below the 10th percentile (62%) and the 3rd percentile (28%) at the time of discharge (61%), term (20%), or 36 weeks’ gestation (19%) [12]. According to previous reports of various neonatal networks, the rate of PGF among VLBW infants, defined as a discharge weight below the 10th percentile, was noted to exceed 95% in the 1990s in the National Institute of Child Health and Human Development (NICHD) study, a decreasing trend from 2000 to 2013 (65% to 50%) in the Vermont Oxford Network, and 53% using the Fenton growth chart in 2005–2012 from the California Perinatal Quality Care Collaborative (CPQCC) [13,14]. In a single-center study of data from the KNGC, 67% of VLBW infants were admitted between 2005 and 2009 versus 47% of VLBW infants admitted between 2010 and 2011 [15,16]. In the Korean Neonatal Network (KNN) study, the weight z score at discharge among surviving 2,799 VLBW infants was -1.37, showing a greater than 50% PGF incidence using the Fenton growth chart [17]. The incidence of PGF in Korea is comparable to those of other countries.
However, the term PGF requires refinement in the diagnostic criteria because EUGR is not predictive of adverse neurodevelopmental outcomes and is usually used to apply intrauterine growth restriction (IUGR) criteria [18]. The definition of malnutrition in preterm infants includes ow growth velocity (weight and length growth), change in weight z score, and previous nutrient intake. When PGF of VLBW was defined as a weight z score decrease from birth to discharge using the Fenton growth chart, the KNN reported that 45.5% of the infants had a score that exceeded 1.28, in accordance with the 41% of infants whose score exceeded 1.0 in the CPQCC [14,17]. Among the Israel National VLBW infant database, 8.1% and 35.5% had a decrease in z scores of >2 and 1–2 using a Canadian reference, respectively [19].
The growth of preterm infants is adversely affected by neonatal morbidities such as necrotizing enterocolitis, gastrointestinal perforations, intraventricular hemorrhage, retinopathy of prematurity, and bronchopulmonary dysplasia. In addition, nutrition-related factors such as enteral feeding and parenteral nutrition practices can be significant risk factors for PGF [20-22]. Infants born SGA or with IUGR had poor growth outcomes [17,23]. A growth assessment is necessary to elucidate how well an infant’s nutritional needs are being met and which infants have difficulty overcoming neonatal morbidities. Recent evidence points to the importance of true growth faltering for optimizing outcomes and supporting infants who are growing adequately to continue on their successful path rather than using a one-time size value at 40 weeks or prior.
It is challenging to further improve our understanding of the growth and nutritional needs of preterm infants during NICU admission. Furthermore, clinical judgment and individualization are needed to set growth goals and assess nutritional status to ensure better outcomes.

Postnatal growth after discharge, especially in VLBW infants

The incidence of growth failure after discharge is declining, but it has not yet been overcome. Table 2 presents a study of postnatal growth in premature infants after discharge. Research on VLBW infants using the KNGC at a single center in Korea revealed a 33% rate of weight below the 10th percentile at 24 months in 2000–2001, a 19% (18 of 98) rate of weight below the 10th percentile at 18 months of postchronological age (PCA) between 1996 and 2000, and a 12.4% (14 of 113) rate of weight below the 3rd percentile at 18 months of PCA between 1997 and 1999 [24-26]. A prospective cohort study of a total of 2,943 VLBW infants from the KNN between 2013 and 2015 showed a rate of 18.5% at 18–24 months of corrected age and a rate of 33.5% at 36 months of age for a weight z score <-1.28 using the WHO growth chart [27]. A nationwide study from the Korean National Health Insurance System (NHIS) database showed the rate of poor growth (defined as below the 10th percentile of weight) using the KNGC was 33% at 24 months, 26% at 36 months, 32% at 48 months, and 36% at 60 months of age [28]. Compared to our data, the incidence of growth under the 10th percentile at 1 year of age was 40.9% of 284 patients in China, while the NICHD in the United States indicated that 40% of patients still have a weight, length, and HC less than the 10th percentile at 18–22 months [13].
Although limited long-term data exist, many studies agree that, despite a period of catch-up growth, VLBW infants achieve retarded growth later in life [29]. A study in the Netherlands revealed that VLBW infants remain shorter and lighter at age 19 years than non-VLBW infants [30]. Accordingly, at age 20 years, former VLBW infants were twice as likely as normal birth weight infants to have a short stature below the 3rd percentile [31]. Studies also suggest that compromised growth may result in a different body composition and lead to adverse health outcomes later in life [32]. Thus, catch-up growth in VLBW infants should be monitored after discharge.
The weight growth pattern from birth to 36 months of age showed significant differences between SGA and non-SGA infants and between VLBW infants and extremely low birth weight (ELBW) infants in the KNN study [27]. Similarly, very preterm and SGA infants in Denmark showed a catch-up growth in weight and height at 6 years of age; however, they reached a significantly lower mean z score than AGA children [33].
Growth is influenced by various factors, including comorbidities and sex [9,21]. From the NHIS database, hyaline membrane disease, patent ductus arteriosus, intraventricular hemorrhage, sepsis, and bronchopulmonary dysplasia (BPD) significantly increased the risk of having a weight less than the 10th percentile of normal at 60 months of age [28]. In particular, infants with BPD reportedly showed an increased risk of growth failure after discharge of 30%–67%. This finding is consistent with the result as an odds ratio (OR) of 2.18 at 18–24 months from the KNN study and OR of 1.50 at 60 months from the NHIS study [27,28]. In a previous large-scale cohort study, infection in ELBW infants affected growth failure in weight and HC at both 36 weeks and 18–22 months of corrected age [26]. In Korea, infants with sepsis showed growth failure in weight (OR, 1.43) and HC (OR, 1.33) [28]. In accordance with a previous study, infants with periventricular leukomalacia (PVL) had a relatively small HC (OR, 1.91) at 60 months of age. Knowing an infant’s perinatal history, reducing the morbidity rate during admission, and performing regular check-ups after discharge can reduce the rate of growth failure.

Postnatal growth of preterm infants by preschool age, adolescence, and adulthood

Various studies have analyzed long-term growth patterns in premature infants using various definitions of poor growth and growth parameters (Table 2). Catch-up growth occurred mainly during the early neonatal period before 24 months and before discharge [33,34]; however, the gains did not always continue over time. In the NHIS study of 430,541 infants covering 99% of national births in 2013, significant differences were noted in height, weight, and HC, respectively, according to age at health check-up, birth weight group, and combination of age and birth weight [35]. The lower birth weight group showed lower catch-up growth, even at 60 months. The mean weight, height, and HC percentiles were persistently below 40 among low birth weight and VLBW infants [35]. The full-term group had greater heights than the preterm group at 8 years of age when the healthy preterm and mid-preterm groups caught up. A systematic review of growth patterns and body composition among ELBW neonates stated that, despite catch-up growth, their weight, height, and HC growths remained retarded into adulthood [29,36,37].
Pre- or full-term born SGA children were shorter and lighter until 3 years of age than AGA children [34,38-41]. The growth velocity of SGA children was significantly higher than that of AGA children in the first 2 years of life [39]. In a single-center study in Korea, 29% of SGA, 33% of severe SGA (<3rd percentile), and 36.4% of moderate SGA (3rd–10th percentile) infants did not reach catch-up growth for weight goals at 24 months of PCA [15,42]. In a Swedish population cohort study, SGA moderate preterm (32–35 weeks) infants were shorter and lighter throughout the 5-year follow-up and the association was stronger in SGA infants at birth [43]. The SGA group was still shorter and lighter at 12 years of age [40].
Nutrition is also a factor contributing to the growth of preterm infants; however, limited information is available on what it involves. Unfortified human milk-fed infants demonstrated slower catch-up growth that was extended until 6 years of age. Rapid weight growth was most pronounced shortly after discharge, especially in preterm formula-fed infants [33].

Growth and development

The correlations between growth and development revealed using various neurodevelopmental assessments in preterm infants are presented in Table 3. Although most studies focused on extremely preterm infants or VLBW infants [36,44,45], even moderate preterm (32+0–33+6 weeks’ gestational age) or late-preterm (34+0–36+6 weeks’ gestational age) infants were at increased risk of poor neurodevelopmental outcomes [46-48]. Being born preterm and SGA increased the risk of adverse developmental outcomes [49,50].
In accordance with other studies, from the NHIS study, infants with poor weight, height, and HC growth were at an increased risk of suspected developmental delay at 60 months of age. ELBW infants were more likely to have a suspected developmental delay (OR, 5.05) than infants with a birth weight of 2,500–4,500 g [35]. According to Korean retrospective cohort studies, HC at 4 months of PCA was related to favorable neurodevelopmental outcomes at 18 months of PCA, while an HC growth spurt between a postmenstrual age of 35 weeks and a PCA of 4 months is beneficial for preterm AGA infants [34]. Catch-up growth of body length was related to cognitive development, while catch-up growth of HC was related to both cognitive and motor development [51]. The period and indices differ between SGA and AGA infants, so they should be monitored differently [34]. Using multiple regression analysis to predict a risk factor for poor developmental outcomes at the age of 60 months, PVL (OR, 2.89), restricted HC growth (OR, 2.36), and restricted height growth (OR, 2.42) were confirmed [28].
Growth in the early postnatal period affects neurodevelopmental outcomes at school age and adolescence [36,52]. Even during adulthood, psychological and behavioral problems are increased in the poor growth group [53], and all height, weight, and HC growth parameters are related to developmental outcomes [54]; however, the association between HC and neurodevelopment was more closely examined [34,45,51,55,56]. Brain size at term-equivalent age was associated with brain tissue volumes on magnetic resonance imaging [45]. Poor postnatal head growth in preterm infants becomes more evident by 2 years and is strongly associated with poor neurodevelopmental outcomes and cerebral palsy. Earlier catch-up HC growth was more critical for neurodevelopment than catch-up weight and length growth [51].
In a Japanese population study, SGA infants with poor postnatal growth were at risk for attention problems throughout preschool to school age. Twenty-six percent of preterm SGA infants failed to catch up. SGA children lacking catch-up growth were more likely to be unable to listen without fidgeting (OR, 2.51) and unable to focus on a task (OR, 2.66) than non-SGA children at 5.5 years of age. Furthermore, SGA children lacking catch-up growth were at a significant risk of inattention at 8 years of age. In contrast, the SGA and catch-up groups were not at increased risk of attention problems or delinquent/aggressive behaviors [57]. In a Brazilian cohort study, preterm infants born with IUGR were at increased risk of motor delays [58]. Thus, children born preterm and SGA, especially those lacking catch-up growth, should be monitored cautiously.

Conclusion

Recent improvements in preterm survival have shifted the focus on preterm infants toward improving their quality of life by monitoring their growth and development. In Korea, preterm infants still show differences in growth and development until preschool age. Thus, careful monitoring and early intervention are required.

Footnotes

Conflicts of interest

No potential conflict of interest relevant to this article was reported.

cep-2021-00234f1.jpg
Table 1.
Review of growth charts and standards
Olsen chart Bertino chart Fenton Growth Chart Intergrowth Growth Standard WHO Growth Standard CDC Growth Chart Korean National Growth Chart
History 2010 2010 2003, Updated in 2013 2014 2006 2000 2007, updated in 2017
Data source Cross-sectional sample of birth data from Pediatrix Medical Group, Inc Nationwide prospective study in Italy Literature selection and combination by University of Calgary INTERGROWTH-21st Consortium (27 institutions in 18 countries worldwide and coordinated from the University of Oxford) WHO multicenter growth reference study National Health Examination Surveys and the National Health and Nutrition Examination Surveys Ministry of Health and Welfare and the Korean Pediatric Society
Sample size 257,855 22,087 Girls and 23,375 boys. Nearly 25000 Nearly 60,000 27,853 Birth to 36 months: nearly 900,000 252,359
2–20 years: nearly 32,000
Dates of data 1998–2006 2005–2007 1987–2012 2009–2014 1997–2005 1963–1994 1997–2005
Age range 22–42 Weeks 23–42 Weeks 22–50 Weeks >14 Weeks of gestation to 2 years of age Birth–59 months Birth–20 years 3–18 years (<3 years: WHO growth chart)
Data WT, LT, and HC WT, LT, and HC WT, HC, LT WT, HC, LT according to GA and sex WT, HC, LT Infant: WT, LT, HC WT, HC, LT, BMI, WT for HT
Pediatric: WT, HT, BMI
Exclusion criteria Only fetal hydrops and major congenital anomalies diagnosed at birth Infants who were not discharged from the hospital at 50 weeks of PMA Maternal smoking, severe maternal obesity or morbidity, congenital malformations, or ultrasound evidence of fetal growth retardation Maternal smoking, breastfeeding less than 3 months Birth weight<1,500 g

CDC, Centers for Disease Control and Prevention; WHO, World Health Organization; WT, weight; LT, length; HC, head circumference; GA, gestational age; BMI, body mass index; HT, height; PMA, postmenstrual age.

Table 2.
Characteristics of the studies included in the review of preterm infant growth after neonatal intensive care unit discharge
Study Study design/country Characteristics:Number, GA/BW, SGA/AGA, Age at follow-up Measurement Main results
Han et al. [28] 2021 Retrospective, Korea 2,961 4-6, 9-12, 18-24, 30-36,42-48 and 54-60 months HT, WT, HC About 30% had growth parameters below the 10th percentile.
BW<1,500 g Increased growth restriction in Infants with morbidities.
Yoon et al. [35] 2021 Retrospective, Korea 430,541 4–6, 9–12, 18–24, 30–36, 42–48, and 54–60 months HT, WT, HC Higher incidence of poor WT, HT, and HC growth at 60 mo in LBW groups. A significant correlation with the growth measurement at 60 months and at 6 months especially in ELBWs
BW subgroup; <1,000 g, 1,000–1,499 g, 1,500–1,999 g, 2,000–2,499 g, 2,500–4,500 g
Song et al. [34] 2020 Retrospective, Korea 122 PMA 35 weeks, 4, 18 months PCA HT, WT, HC Decreased mean z scores of all growth indicators from birth to PMA 35 weeks in both groups. From 4 to 18 months, the 3 growth indicators for SGAs continued to increase
BW<1,500 g or GA<32 weeks
SGA 29/AGA 93
Park et al. [15] 2017 Retrospective, Korea 81 At PCA 40 weeks, every 3 months until PCA 24 months HT, WT Higher growth failure rates in SGA infants, ELBW infants at PCA 24 months.
VLBW infants
SGA 17/AGA 64
Park et al. [59] 2015 Retrospective, Korea 103 12, 24 months PCA WT One birth weight z score decrement increased the odds for CUG failure (OR=2.9 at 12 months and 3.0 at 24 months).
Preterm
SGA 34/AGA 69 The increase in z score between 12–24 months PCA in the nutritional support group.
Ou-Yang et al. [60] 2020 Meta-analysis & systematic review 169,439 Childhood, adolescent WT, BMI Accelerated WT gain during first 2 years significantly increased the likelihood of subsequent childhood obesity among preterms (aOR=1.87)
Children
Preterm/term
Van de Pol and Allegaert [29] 2020 Systematic review, Belgium BW<1,000 g From birth to adulthood WT, HT, HC, BMI After hospital discharge, ELBW neonates remained with poor WT, HT, and HC at each CA throughout childhood and adolescence
Liao et al. [61] 2019 Prospective, Taiwan 2,124 At 6, 12, and 24 months PCA WT The prevalence of PGF was 17.3%, 19.4%, and 13.8% at the CA of 6, 12, and 24 months, respectively. The significant perinatal factors of PGF were being SGA, ELBW and EUGR.
GA<37 weeks and BW<1,500 g
Lindström et al. [43] 2019 Prospective, Sweden 41,669 1.5, 3 ,4, 5 Years WT, HT, HC, BMI Those born SGA in GA 32weeks or 35weeks had poor HT, WT, mean BMI throughout the whole follow-up period.
GA 32–40 weeks The association seemed stronger the shorter GA at birth.
Olbertz et al. [39] 2019 Longitudinal, Germany 1,496 term AGA/173 preterm SGA/891 term SGA 4 Years HT, WT, HC, BMI Inferior growth outcome in preterm or full-term born SGA children from birth until 3 years. The higher growth velocity of SGA children in the first 2 years.
Visuthranukul et al. [62] 2019 Prospective, United States 51 At discharge, 12–15, 18–22 months PCA HT, WT, HC SGA premature infants with an exclusive HM-based diet in NICU until 34 weeks PCA exhibited greater CUG without increased adiposity or elevated insulin resistance at 2 years
BW≤1,250 g
SGA 18/AGA 33
Toftlund et al. [33] 2018 Prospective, Denmark 281 6 Years WT CUG occurred mainly before discharge. CUG in UHM-fed infants was slower, but extended until 6 years. Rapid weight growth was most pronounced shortly after discharge and especially if PF-fed.
GA 24–32 weeks
UHM/FHM/PF
Raaijmakers et al. [36] 2017 Prospective, Belgium 140 At 9 and 24 months and at 11 years WT, HT, HC ELBW children still had HT, WT, HC below target at 11 years.
BW<1,000 g CUG in ELBW children in the first 2 years of life is associated with a lower percentage body fat and is therefore likely to be beneficial.
Rowe et al. [37] 2011 Cohort study, New Zealand 54 2–20 years HT, WT Preterm is shorter and lighter than controls throughout childhood, remaining below their genetic height potential.
<37 weeks, 82: control
Sullivan et al. [40] 2008 Prospective, United States 148 18, 30 months CA, 4, 8, and 12 years WT, HT, BMI Only the SGA group had smaller HT at age 12 years. The preterm with neurologic illness, and SGA groups had lower WT through age 12 years. BMI was appropriate for preterm groups by age 4 years. Across time, neonatal morbidity had a significant effect on HT and WT trajectories.
BW<1,850 g and 46 full term/29 preterm SGA
Farooqi et al. [63] 2006 Prospective, Sweden 247 From birth to the age of 11 years WT, HT, HC, BMI Sharp decline in WT and HT z scores up to 3 months' CA, followed by CUG in both WT and HT up to 11 years. No CUG in HC after the first 6 months.
GA<26 weeks

GA, gestational age; BW, birth weight; SGA, small for gestational age; AGA, appropriate for gestational age; HT, height; WT, weight; HC, head circumference; LBW, low birth weight; ELBW, extremely LBW; PMA, postmenstrual age; PCA, postchronological age; VLBW, very LBW; CUG, catch-up growth; OR, odds ratio; BMI, body mass index; aOR, adjusted odds ratio; CA, corrected age; PGF, postnatal growth failure; EUGR, extrauterine growth restriction; HM, human milk; NICU, neonatal intensive care unit; UHM, unfortified human milk; FHM, fortified human milk; PF, preterm formula-fed.

Table 3.
Overview of included studies on growth factors related to long-term infant development
Study Study design/country Characteristics: Number, GA/BW, SGA/AGA Age at follow-up Measurement Age at developmental test Neurodevelopmental assessment Main results
Han et al. [28] 2021 Retrospective, Korea 2,961 4-6, 9-12, 18-24, 30-36, 42-48 and 54-60 months HT, WT, HC 54-60 months K-DST Poor growth at 60 months of age showed significantly poor developmental outcomes. Children with PVL had small HC (OR, 1.91) and poor developmental screening results (OR, 2.89).
BW<1,500 g
Yoon et al. [35] 2021 Retrospective, Korea 430,541 4–6, 9–12, 18–24, 30–36, 42–48, and 54–60 months HT, WT, HC 54-60 months K-DST Increased risk of poor developmental results at 60 months in the infants with poor WT, HT, and HC growth. Infants with poor HC at 60 months of age had poor developmental results (OR, 1.81)
BW subgroup; <1,000 g, 1,000–1,499 g, 1,500–1,999 g, 2,000–2,499 g, 2,500–4,500 g
Song et al. [34] 2020 Retrospective, Korea 122 PMA 35 weeks, 4, 18 months PCA HT, WT, HC 18 Months CA BSID III HC at 4 months CA was an important factor of favorable neurodevelopmental outcomes, and HC growth spurt between PMA 35 weeks and 4 months CA in preterm AGAs
BW<1,500 g or GA<32 weeks, SGA 29/AGA 93
Sohn et al. [51] 2016 Retrospective, Korea 107 8, 18 Months CA HT, WT, HC 18 Months CA BSID III Appropriate HT at birth was significantly associated with optimal cognitive development. CUG for HT was related to cognitive development, while CUG of HC was related to both cognitive and motor development.
<32 Weeks GA or BW <1,500 g
Dotinga et al. [54] 2019 Prospective, Netherlands 234 1, 4, 7 Years HT, WT, HC 7 Years WISC. 3rd: IQ Poorer growth in the first 7 years is associated with poorer neuropsychological functioning.
32–36 Weeks GA NTBC AVLT
MABC
Egashira et al. [64] 2019 Prospective, Japan 280 40 Weeks CA HT, WT, HC 3 Years KSPD A longer HT and larger HC at term were important indicators that influenced better psychomotor development in VLBW infants at 3 years of age.
VLBW infants
Takeuchi et al. [57] 2019 Prospective, Japan 1,667 2 Years CA HT 5.5, 8 Years Questionnaire at 5.5 years Preterm SGA children without CUG at 2 years were at increased risk for behavioral problems, including inattention symptoms, from preschool age to school age.
Preterm <37 weeks, SGA CBCL at 8 years
Taine et al. [65] 2018 Systematic review Small (≤30) From birth to age 3 years HT, WT, HC, BMI 3–26 Years IQ Positive association with early postnatal growth (first 6 months)
32–36 weeks GA or SGA term CBCL, BSID II
Raaijmakers et al. [36] 2017 Prospective, Belgium 140 9, 24 Months, 11 years HT, WT, HC 24 Months CA 11 years BSID–II–NL ELBW children had worse neurocognitive testing results with an average IQ at 11 years. CUG was not associated with neurocognitive performance.
BW<1,000 g Wechsler Non-Verbal Test
Sammallahti et al. [52] 2017 Prospective, Finland 108 5, 20 Months CA, and 56 months HT, WT, HC 24–26 Years WAIS-III: Wechsler Memory Scale-III, Bohnen version of the Stroop test, Grade point average Faster growth in WT and HC from birth to 5 months CA is associated with higher IQ and better executive functioning in adulthood and higher GPA.
34–36 Weeks GA
Sicard et al. [55] 2017 Prospective, France 4,046 Hospital discharge HC 2 Years CA HC at birth and HC z score between birth and discharge are associated to neurodevelopmental outcome at 2 years
≤34 Weeks GA
Ghods et al. [56] 2011 Retrospective, Austria 173 3, 6. 9. 12., 24 Months CA and 40, 54, 66 months HC 2 Years Neuromotor assessments, BSID II Most HC catch-up occurred between birth and 3 months CA. There is a close relation between HC growth and neurodevelopmental outcome.
VLBW
Franz et al. [44] 2009 Prospective, Germany 219 At discharge WT, HC 5.4 Years KABC test Motor development was associated with growth from birth to discharge. Cognitive development was associated with BW, early neonatal WT gain, and postdischarge HC growth.
<30 Weeks GA and BW <1,500 g CP
Cheong et al. [45] 2008 Prospective, Australia 227 1, 2 Years CA WT, HC 2 Years CA BSID II Poor HC growth becomes more evident by 2 years and is associated with poor neurodevelopmental outcome and cerebral palsy.
<30 Weeks GA or BW <1,250 g

GA, gestational age; BW, birth weight; SGA, small for gestational age; AGA, appropriate for gestational age; BW, birth weight; HT, height; WT, weight; HC, head circumference; K-DST, Korean Developmental Screening Test; PVL, periventricular leukomalacia; OR, odds ratio; PMA, postmenstrual age; BSID, Bayley Scale of Infant Development; ELBW, extremely low birth weight; CA, corrected age; WISC, Wechsler Intelligence Scale for Children; IQ, intelligence quotient; NTBC, Neuropsychological Test Battery for Children; AVLT, Auditory Verbal Learning Test; BMI, body mass index; MABC, Movement Assessment Battery for Children; VLBW, very low birth weight; KSPD, Kyoto Scale of Psychological Development (Postural-Motor/Cognitive-Adaptive/Language-Social); CUG, catch-up growth; CBCL, Child Behavior Checklist; BMI, body mass index; WAIS, Wechsler Adult Intelligence Scale; KABC, Kaufman Assessment Battery for Children; CP, cerebral palsy.

References

1. Lubchenco LO, Hansman C, Dressler M, Boyd E. Intrauterine growth as estimated from liveborn birth-weight data at 24 to 42 weeks of gestation. Pediatrics 1963;32:793–800.
crossref pmid
2. Olsen IE, Groveman SA, Lawson ML, Clark RH, Zemel BS. New intrauterine growth curves based on United States data. Pediatrics 2010;125:e214–24.
crossref pmid
3. Bertino E, Spada E, Occhi L, Coscia A, Giuliani F, Gagliardi L, et al. Neonatal anthropometric charts: the Italian neonatal study compared with other European studies. J Pediatr Gastroenterol Nutr 2010;51:353–61.
crossref pmid
4. Greer CF. Intrauterine growth as estimated from liveborn birth-weight data at 24 to 42 weeks of gestation, by Lula O. Lubchenco et al, Pediatrics, 1963;32:793-800. Pediatrics 1998;102(1 Pt 2): 237–9.
crossref pmid pdf
5. Fenton TR, Nasser R, Eliasziw M, Kim JH, Bilan D, Sauve R. Validating the weight gain of preterm infants between the reference growth curve of the fetus and the term infant. BMC Pediatrics 2013;13:92.
crossref pmid pmc
6. Fenton TR, Kim JH. A systematic review and meta-analysis to revise the Fenton growth chart for preterm infants. BMC Pediatrics 2013;13:59.
crossref pmid pmc
7. Villar J, Ismail LC, Victora CG, Ohuma EO, Bertino E, Altman DG, et al. International standards for newborn weight, length, and head circumference by gestational age and sex: the Newborn Cross-Sectional Study of the INTERGROWTH-21st Project. Lancet 2014;384:857–68.
crossref pmid
8. Sankilampi U. One size may not fit all when it comes to growth references for preterm infants. Acta Paediatr 2016;105:228–9.
crossref pmid
9. Kuczmarski RJ, Ogden CL, Guo SS, Grummer-Strawn LM, Flegal KM, Mei Z, et al. 2000 CDC Growth Charts for the United States: methods and development. Vital Health Stat 11 2002;(246): 1–190.

10. de Onis M. Update on the implementation of the WHO child growth standards. World Rev Nutr Diet 2013;106:75–82.
crossref pmid
11. Kim JH, Yun S, Hwang SS, Shim JO, Chae HW, Lee YJ, et al. The 2017 Korean National Growth Charts for children and adolescents: development, improvement, and prospects. Korean J Pediatr 2018;61:135–49.
crossref pmid pmc
12. Fenton TR, Chan HT, Madhu A, Griffin IJ, Hoyos A, Ziegler EE, et al. Preterm infant growth velocity calculations: a systematic review. Pediatrics 2017;139:e20162045.
crossref pmid
13. Dusick AM, Poindexter BB, Ehrenkranz RA, Lemons JA. Growth failure in the preterm infant: can we catch up? Semin Perinatol 2003;27:302–10.
crossref pmid
14. Griffin IJ, Tancredi DJ, Bertino E, Lee HC, Profit J. Postnatal growth failure in very low birth weight infants born between 2005 and 2012. Arch Dis Child Fetal Neonatal Ed 2016;101:F50–5.
crossref pmid
15. Park JS, Han J, Shin JE, Lee SM, Eun HS, Park MS, et al. Postdischarge growth assessment in very low birth weight infants. Korean J Pediatr 2017;60:64–9.
crossref pmid pmc
16. Kim ES, Sohn JA, Lee EH, Choi EJ, Lee HJ, Lee JA, et al. Extrauterine growth restriction in very low birth weight infants. J Korean Soc Neonatol 2010;17:53–63.

17. Lee SM, Kim N, Namgung R, Park M, Park K, Jeon J. Prediction of postnatal growth failure among very low birth weight infants. Sci Rep 2018;8:3729.
crossref pmid pmc
18. Fenton TR, Cormack B, Goldberg D, Nasser R, Alshaikh B, Eliasziw M, et al. "Extrauterine growth restriction" and "postnatal growth failure" are misnomers for preterm infants. J Perinatol 2020;40:704–14.
crossref pmid
19. Marks KA, Reichman B, Lusky A, Zmora E. Fetal growth and postnatal growth failure in very-low-birthweight infants. Acta Paediatr 2006;95:236–42.
crossref pmid
20. Lima PA, Carvalho M, Costa AC, Moreira ME. Variables associated with extrauterine growth restriction in very low birth weight infants. J Pediatr (Rio J) 2014;90:22–7.
crossref pmid
21. Senterre T, Rigo J. Optimizing early nutritional support based on recent recommendations in VLBW infants and postnatal growth restriction. J Pediatr Gastroenterol Nutr 2011;53:536–42.
crossref pmid
22. Embleton NE, Pang N, Cooke RJ. Postnatal malnutrition and growth retardation: an inevitable consequence of current recommendations in preterm infants? Pediatrics 2001;107:270–3.
crossref pmid
23. Pilling EL, Elder CJ, Gibson AT. Growth patterns in the growth-retarded premature infant. Best Pract Res Clin Endocrinol Metab 2008;22:447–62.
crossref pmid
24. Shim JW, Whang JH, Choi CW, Chang YS, Park WS. Failure to thrive of very low birth weight infants up to corrected 18 months of age. J Korean Soc Neonatol 2003;10:115–24.

25. Lim JW, Jun NL, Kim KA, Kim AR, Kim KS, Pi SY. Postnatal catch-up growth of very low birth weight infants. J Korean Soc Neonatol 2002;9:1–11.

26. Ma TH, Kim KA, Ko SY, Lee YK, Shin SM. Catch-up growth and development of very low birth weight infants. Korean J Pediatr 2006;49:29–33.
crossref
27. Lim JH, Yoon SJ, Han JH, Shin JE, Lee SM, Eun HS, et al. Growth failure of very low birth weight infants during the first 3 years: a Korean Neonatal Network. PLoS One 2021;16:e0259080.
crossref pmid pmc
28. Han JH, Yoon SJ, Lim JH, Shin JE, Song IG, Lee SM, et al. The impact of neonatal morbidities on child growth and developmental outcome in very low birthweight infants: nationwide cohort study. Eur J Pediatr 2021;Jul 8 https://doi.org/10.1007/s00431-021-04177-x. [Epub].
crossref
29. Van de Pol C, Allegaert K. Growth patterns and body composition in former extremely low birth weight (ELBW) neonates until adulthood: a systematic review. Eur J Pediatr 2020;179:757–71.
crossref pmid
30. Hollanders JJ, van der Pal SM, van Dommelen P, Rotteveel J, Finken MJJ. Growth pattern and final height of very preterm vs. very low birth weight infants. Pediatr Res 2017;82:317–23.
crossref pmid
31. Hack M, Flannery DJ, Schluchter M, Carter L, Borawski E, Klein N. Outcomes in young adulthood for very-low-birth-weight infants. N Engl J Med 2002;346:149–57.
crossref pmid
32. Morrison KM, Ramsingh L, Gunn E, Streiner D, Van Lieshout R, Boyle M, et al. Cardiometabolic health in adults born premature with extremely low birth weight. Pediatrics 2016;138:e20160515.
crossref pmid
33. Toftlund LH, Halken S, Agertoft L, Zachariassen G. Catch-up growth, rapid weight growth, and continuous growth from birth to 6 years of age in very-preterm-born children. Neonatology 2018;114:285–93.
crossref pmid
34. Song IG, Kim EK, Cho H, Shin SH, Sohn JA, Kim HS. Differential effect of growth on development between aga and SGA preterm infants. Int J Environ Res Public Health 2020;17:3022.
crossref pmid pmc
35. Yoon SJ, Lim J, Han JH, Shin JE, Lee SM, Eun HS, et al. Identification of growth patterns in low birth weight infants from birth to 5 years of age: nationwide Korean cohort study. Int J Environ Res Public Health 2021;18:1206.
crossref pmid pmc
36. Raaijmakers A, Jacobs L, Rayyan M, van Tienoven TP, Ortibus E, Levtchenko E, et al. Catch-up growth in the first two years of life in extremely low birth weight (ELBW) infants is associated with lower body fat in young adolescence. PLoS One 2017;12:e0173349.
crossref pmid pmc
37. Rowe DL, Derraik JGB, Robinson E, Cutfield WS, Hofman PL. Preterm birth and the endocrine regulation of growth in childhood and adolescence. Clin Endocrinol 2011;75:661–5.
crossref
38. Nobile S, Marchionni P, Carnielli VP. Neonatal outcome of small for gestational age preterm infants. Eur J Pediatr 2017;176:1083–8.
crossref pmid
39. Olbertz DM, Mumm R, Wittwer-Backofen U, Fricke-Otto S, Pyper A, Otte J, et al. Identification of growth patterns of preterm and small-forgestational age children from birth to 4 years - do they catch up? J Perinat Med 2019;47:448–54.
crossref pmid
40. Sullivan MC, McGrath MM, Hawes K, Lester BM. Growth trajectories of preterm infants: birth to 12 years. J Pediatr Health Care 2008;22:83–93.
crossref pmid pmc
41. Kim S, Choi Y, Lee S, Ahn MB, Kim SH, Cho WK, et al. Growth patterns over 2 years after birth according to birth weight and length percentiles in children born preterm. Ann Pediatr Endocrinol Metab 2020;25:163–8.
crossref pmid pmc
42. Huh J, Kwon JY, Kim HR, Lee EH, Rhie YJ, Choi BM, et al. Comparison of postnatal catch-up growth according to definitions of small for gestational age infants. Korean J Pediatr 2018;61:71–7.
crossref pmid pmc
43. Lindström L, Ahlsson F, Lundgren M, Bergman E, Lampa E, Wikström AK. Growth patterns during early childhood in children born small for gestational age and moderate preterm. Sci Rep 2019;9:11578.
crossref pmid pmc
44. Franz AR, Pohlandt F, Bode H, Mihatsch WA, Sander S, Kron M, et al. Intrauterine, early neonatal, and postdischarge growth and neurodevelopmental outcome at 5.4 years in extremely preterm infants after intensive neonatal nutritional support. Pediatrics 2009;123:e101–9.
crossref pmid
45. Cheong JLY, Hunt RW, Anderson PJ, Howard K, Thompson DK, Wang HX, et al. Head growth in preterm infants: correlation with magnetic resonance imaging and neurodevelopmental outcome. Pediatrics 2008;121:e1534–40.
crossref pmid
46. Hack M, Breslau N, Weissman B, Aram D, Klein N, Borawski E. Effect of very low birth weight and subnormal head size on cognitive abilities at school age. N Engl J Med 1991;325:231–7.
crossref pmid
47. Connors JM, O'Callaghan MJ, Burns YR, Gray PH, Tudehope DI, Mohay H, et al. The influence of growth on development outcome in extremely low birth weight infants at 2 years of age. J Paediatr Child Health 1999;35:37–41.
crossref pmid
48. Hintz SR, Kendrick DE, Stoll BJ, Vohr BR, Fanaroff AA, Donovan EF, et al. Neurodevelopmental and growth outcomes of extremely low birth weight infants after necrotizing enterocolitis. Pediatrics 2005;115:696–703.
crossref pmid
49. McGowan JE, Alderdice FA, Holmes VA, Johnston L. Early childhood development of late-preterm infants: a systematic review. Pediatrics 2011;127:1111–24.
crossref pmid
50. Heinonen K, Lahti J, Sammallahti S, Wolke D, Lano A, Andersson S, et al. Neurocognitive outcome in young adults born late-preterm. Dev Med Child Neurol 2018;60:267–74.
crossref pmid
51. Sohn JA, Kim EK, Lee JA, Choi CW, Kim HS, Kim BI, et al. Neurodevelopmental outcome according to prenatal and postnatal growth patterns in preterm infants. Neonatal Med 2016;23:108–15.
crossref
52. Sammallahti S, Heinonen K, Andersson S, Lahti M, Pirkola S, Lahti J, et al. Growth after late-preterm birth and adult cognitive, academic, and mental health outcomes. Pediatr Res 2017;81:767–74.
crossref pmid
53. Stathis SL, O'Callaghan M, Harvey J, Rogers Y. Head circumference in ELBW babies is associated with learning difficulties and cognition but not ADHD in the school-aged child. Dev Med Child Neurol 1999;41:375–80.
crossref pmid
54. Dotinga BM, Eshuis MS, Bocca-Tjeertes IF, Kerstjens JM, Van Braeckel KN, Reijneveld SA, et al. Longitudinal growth and neuropsychological functioning at age 7 in moderate and late preterms. Pediatrics 2016;138:e20153638.
crossref pmid
55. Sicard M, Nusinovici S, Hanf M, Muller JB, Guellec I, Ancel PY, et al. Fetal and postnatal head circumference growth: Synergetic factors for neurodevelopmental outcome at 2 years of age for preterm infants. Neonatology 2017;112:122–9.
crossref pmid
56. Ghods E, Kreissl A, Brandstetter S, Fuiko R, Widhalm K. Head circumference catch-up growth among preterm very low birth weight infants: effect on neurodevelopmental outcome. J Perinat Med 2011;39:579–86.
crossref pmid
57. Takeuchi A, Yorifuji T, Hattori M, Tamai K, Nakamura K, Nakamura M, et al. Catch-up growth and behavioral development among preterm, small-for-gestational-age children: a nationwide Japanese population-based study. Brain Dev 2019;41:397–405.
crossref pmid
58. Rocha PRH, Saraiva MDCP, Barbieri MA, Ferraro AA, Bettiol H. Association of preterm birth and intrauterine growth restriction with childhood motor development: Brisa cohort, Brazil. Infant Behav Dev 2020;58:101429.
crossref pmid
59. Park HJ, Lee HY, Woo HK, Kim SN, Lee J, Yang HR, et al. et al. The usefulness of birth weight z-score as a predictor of catch up growth in preterm infants. Neonatal Med 2015;22:142–9.
crossref
60. Ou-Yang MC, Sun Y, Liebowitz M, Chen CC, Fang ML, Dai W, et al. Accelerated weight gain, prematurity, and the risk of childhood obesity: a meta-analysis and systematic review. PLoS One 2020;15:e0232238.
crossref pmid pmc
61. Liao WL, Lin MC, Wang TM, Chen CH. Risk factors for postdischarge growth retardation among very-low-birth-weight infants: a nationwide registry study in Taiwan. Pediatr Neonatol 2019;60:641–7.
crossref pmid
62. Visuthranukul C, Abrams SA, Hawthorne KM, Hagan JL, Hair AB. Premature small for gestational age infants fed an exclusive human milk-based diet achieve catch-up growth without metabolic consequences at 2 years of age. Arch Dis Child Fetal Neonatal Ed 2019;104:F242–7.
crossref pmid
63. Farooqi A, Hägglöf B, Sedin G, Gothefors L, Serenius F. Growth in 10- to 12-year-old children born at 23 to 25 weeks' gestation in the 1990s: a Swedish national prospective follow-up study. Pediatrics 2006;118:e1452–65.
crossref pmid
64. Egashira T, Hashimoto M, Shiraishi TA, Shichijo A, Egashira M, Mizukami T, et al. A longer body length and larger head circumference at term significantly influences a better subsequent psychomotor development in very-low-birth-weight infants. Brain Dev 2019;41:313–9.
crossref pmid
65. Taine M, Charles MA, Beltrand J, Rozé JC, Léger J, Botton J, et al. Early postnatal growth and neurodevelopment in children born moderately preterm or small for gestational age at term: A systematic review. Paediatr Perinat Epidemiol 2018;32:268–80.
crossref pmid
METRICS Graph View
  • 1 Web of Science
  • 1 Crossref
  • 1 Scopus
  • 7,498 View
  • 209 Download