


Introduction
Anemia is a common health problem that has been identified in one quarter of the global population [1]. Prevalence of anemia is particularly high in preschool children and women of childbearing age. The World Health Organization (WHO) reported that the prevalence of anemia is 48% in preschool-aged children, 25% in school-aged children, and 30% in nonpregnant women [1]. In growing children and adolescents, chronic anemia adversely affects growth and cognitive development [2]. In particular, iron deficiency anemia (IDA) is associated with low cognitive performance scores not only in infants, but also in school-aged children and adolescents [3,4].
Before 2000, several studies were conducted on the prevalence of anemia in adolescents in Korea. According to these studies, the prevalence of anemia in adolescents aged 10–24 years was 3.5%–4.5% for males and 7.9%–17.1% for females [5,6]. In 2018, there was a large-scale study on the prevalence of anemia in Korean over the age of 15 [7]. The prevalence of anemia was 0.33% in males aged 15–29 and 6.08% in females, showing a decrease in prevalence compared to that previously reported [7]. However, individuals younger than 15 years were not included in the study, and there was no further analysis of the clinical information.
The Korea National Health and Nutrition Examination Survey (KNHANES) has been conducted since 1998. This survey includes large-scale health data representing the Korean population. In this survey, blood tests are conducted on subjects 10 years of age or older. Using the KNHANES data from 1998 to 2018, we investigated the prevalence of anemia among adolescents at 10 years or older. In addition, we sought to identify factors associated with anemia.
Methods
1. Study population
This study was conducted using data from the KNHANES conducted by the Korea Centers for Disease Control and Prevention (KCDC). The KNHANES is a project that seeks to improve health by investigating health behaviors, nutritional status, and prevalence of chronic diseases. The KNHANES was initiated in 1998, and we conducted this study based on data spanning 21 years between 1998 and 2018: KNHANES I (1998), KNHANES II (2001), KNHANES III (2005), KNHANES IV (2007–2009), KNHANES V (2010–2012), KNHANES VI (2013–2015), and KNHANES VII (2016–2018). The KNHANES was implemented once every 3 years from 1998 to 2005, and has been conducted annually since 2007. Since 2007, this survey was conducted with approval of the Institutional Review Board (IRB) of the KCDC (2007-02CON-04-P, 2008-04EXP-01-C, 2009-01CON-03-2C, 2010-02CON-21-C, 2011-02CON-06-C, 2012-01EXP-01-2C, 2013-07CON-03-4C, 2013-12EXP-03-5C, 2018-01-03-P-A). KNHANES was implemented without approval from 2015 to 2017 in accordance with the opinion of the IRB of the KCDC.
During the study period, 25,692 adolescents aged 10–18 years were included in the survey. Among them, we analyzed the data from 11,782 adolescents who underwent blood tests.
2. Study variables and definition
We investigated differences in age, sex, residential area, household income, height, weight, waist circumference, and body mass index (BMI) of the subjects in the KNHANES I to VII. Residential area was divided into urban and rural areas. When the administrative district of residential area was ‘–dong’, the area was defined as an urban area, and ‘–eup/–myeon’ was defined as a rural area. Household income was divided into 4th quartiles of low, middle-low, middle-high, and high. BMI status was defined by sex- and age-specific percentiles using the 2017 Korean National Growth Charts: underweight (<5th percentile), normal (5th≤BMI<85th percentile), overweight (85th≤BMI <95th percentile), and obese (≥ 95th percentile) [8].
The changes in hemoglobin (Hb) level and the prevalence of anemia over time were investigated. According to the WHO guidelines, anemia was defined as a serum Hb level <11.5 g/dL in boys and girls aged 10–11 years; level <12 g/dL in boys aged 12–14 years and girls aged 12 years and over; and level <13 g/dL in boys aged 15 years and over [9]. Anemia was classified according to severity, mean corpuscular volume (MCV), and mean corpuscular hemoglobin (MCH). The severity of anemia was characterized as mild for Hb 11 g/dL or higher, moderate for 8–11 g/dL, and severe for Hb<8 g/dL [9]. The normal range of MCV was defined as 78–90.5 fL at age 10, 80–93.5 fL at age 11–14, and 81–95.5 fL at age 15–18 [10]. The normal range of MCH was defined as 26.3–31.2 pg at age 10, 26.6–31.9 pg at age 11–14, and 27–32.8 pg at age 15–18 [10].
In 2001, questions were added to KNHANES to ask female participants about their age at menarche and current menstruation status. Among those who responded to the survey between 2001 and 2018, 4,730 female participants were interviewed. We investigated whether there was a difference in prevalence of anemia according to menarche, years after menarche and whether or not the participants were menstruating. Additionally, the risk factors for anemia were identified in male participants and in female participants with a menstrual history.
3. Statistical analysis
These data were extracted from a complex stratified sample, and were analyzed by applying weights, stratification variables, and cluster variables. The prevalence of anemia was calculated by weighted prevalence. For statistical methods, complex sample crosstabs for categorical variables and complex sample generalized linear regression for continuous variables were used. The risk factors for anemia were analyzed through logistic regression analysis. Statistical significance was defined by P values <0.05. All statistical analyses were conducted using IBM SPSS Statistics ver. 25.0 (IBM Co., Armonk, NY, USA).
Results
1. Characteristics of the subjects
A total of 11,782 participants with a mean age of 14.3±0.0 years was included (Table 1). There were 6,250 male (53.3%) and 5,532 female (46.7%) participants. The proportion of urban residents was 83.8%, which increased from 80.4% in 1998 to 88.5% in 2016–2018 (P=0.046). The percentage of participants from low-income households decreased from 15.1% in 1998 to 10.6% in 2016–2018. The percentage of those from high-income households increased from 26.9% in 1998 to 33.9% in 2016–2018 (P<0.001). By survey year, there were differences in height, weight, waist circumference, and BMI of the subjects (Table 1).
2. Distribution of Hb levels
The mean Hb level of the subjects was 14.0±0.0 g/dL. The mean Hb level of males was 14.7±0.0 g/dL, and that of females was 13.2±0.0 g/dL (Fig. 1). The Hb level of males increased from 14.4±0.0 g/dL in 1998 to 14.9±0.0 g/dL in 2016–2018 (P<0.001). According to age, the mean level of 13.5±0.0 g/dL at 10 years increased to 15.5±0.0 g/dL at 18 years for males (P<0.001). In female adolescents, the Hb level increased slightly from 13.2±0.0 g/dL in 1998 to 13.3±0.0 g/dL in 2016–2018 (P<0.001). The mean Hb level in females decreased with age; the level was highest, 13.6±0.0 g/dL, at 11 years and was 12.9±0.0 g/dL at 18 years (P<0.001).
3. Prevalence of anemia in all subjects
Of all patients, 465 had anemia, a weighted prevalence of 4.0% (Table 2). The prevalence of anemia was 0.9% in males and 7.5% in females. The change in anemia prevalence over time significantly decreased in males, from 3.0% in 1998 to 0.5% in 2016–2018 (P<0.001). However, the prevalence of anemia in females did not change significantly over time, from 7.9% in 1998 to 8.5% in 2016–2018 (P=0.054). The prevalence of anemia in males decreased with age from 1.9% at 10 years to 0.4% at 18 years (P<0.001). In females, the prevalence of anemia was 0.9% at 10 years of age and gradually increased from 13 years to13.7% at 18 years (P<0.001). There were differences in the prevalence of anemia between the age of 10–12 years and 13–18 years in both males and females. In female adolescents, the prevalence of anemia was 1.7%, similar to that of males at the ages of 10–12 years; but the prevalence was significantly higher, 9.6%, at the ages of 13–18 years (Fig. 2).
There was no difference in anemia prevalence according to residential area. According to household income, the anemia prevalence was 5.4% for low household incomes and 2.8% for high household incomes. Therefore, the prevalence was significantly higher when the household income was low (P=0.001). There was no significant difference in males according to household income. However, there was a higher prevalence of anemia in females in the low-income group (P=0.002). There was no difference in prevalence of anemia according to BMI status.
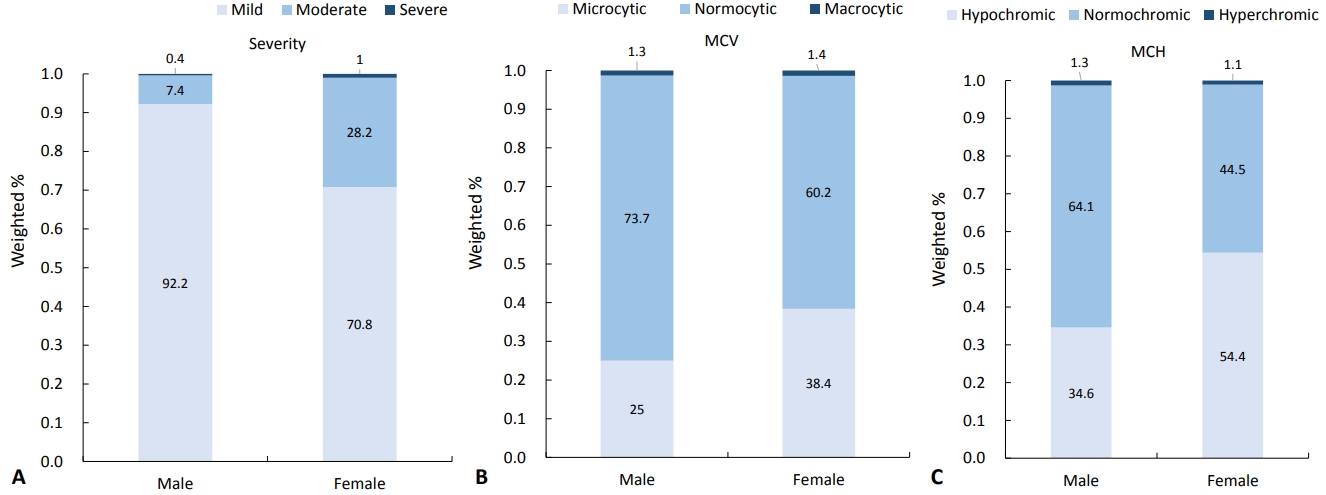
Regarding anemia severity, mild anemia was present in 73.4 %, moderate anemia occurred in 25.7%, and severely anemic individuals comprised 0.9% (Fig. 3). In males, 92.2% of cases were mild; in females 70.8% were mild and 28.2% were moderate (P<0.001). According to the MCV of patients with anemia, 36.8% of cases were microcytic anemia, 61.8% were normocytic, and 1.4% were macrocytic. There was no significant difference between males and females (P=0.092). According to the MCH of patients with anemia, 52.0% were hypochromic, 46.9% were normochromic, and 1.1% were hyperchromic anemic. Hypochromic anemia accounted for 34.6% of male cases and 54.4% of female cases. This difference was statistically significant (P=0.006).
4. Prevalence of anemia according to menstruation in female adolescents
A total of 4,730 female participants was identified from a survey on menstrual history between 2001 and 2018. The average age of menarche was 12.4±0.0 years and decreased from 13.3±0.1 in 2001 to 11.8±0.0 in 2016–2018 (P<0.001). The proportion of girls with a menarcheal experience was 6.7% at the age of 10, 28.8% at 11, 55.2% at 12, and above 80% after 13. In the 4,730 female participants, the proportion without menarcheal experience was 25.4%; of the others, 12.6% were on their menstruation period, and 61.9% were not on their period at the time of survey. The prevalence of anemia was 1.8% in premenarcheal girls, 8.8% in those not on their period, and 11.7% of those on their period (P<0.001). The mean number of years after menarche of all female participants was 2.5±0.1 years while that in anemic female participants was 3.0±0.1 years longer than the 2.0±0.0 years of the nonanemic group (P<0.001). The prevalence of anemia was 3.2%, 9.2%, and 14.4% when the number of years after menarche was less than 1 year, between 1–5 years, and more than 6 years, respectively (P<0.001).
5. Factors associated with anemia
Table 3 shows the results of univariate and multivariate analyses of factors associated with anemia in adolescents. In the multivariate analysis of anemia in all adolescents, the odds ratio (OR) for age was 1.22 (95% confidence interval [CI], 1.17–1.27; P<0.001), and the OR for female was 9.88 (95% CI, 7.19–13.57; P<0.001). In addition, the prevalence of anemia in individuals with high household income was significantly lower than that in those with low household income (OR, 0.75; 95% CI: 0.61–0.93; P= 0.009). Multivariate analysis in male adolescents showed that the prevalence of anemia decreased over time, with an OR for each 3 years of 0.76 (95% CI, 0.66–0.87; P<0.001), and the OR for age was 0.83 (95% CI, 0.73–0.95; P=0.006). In the univariate analysis of 4,730 female adolescents with a menstrual history, there was a significant correlation between age, household income, menarche experience, years after menarche, and current menstrual status. In multivariate analysis, the risk of anemia increased 26% as the age increased by 1 year (OR, 1.26; 95% CI, 1.15–1.38; P<0.001). The prevalence of anemia was lower when the household income was high (OR, 0.75; 95% CI, 0.59–0.95; P=0.020) and BMI status was overweight (OR, 0.67; 95% CI, 0.48–0.94; P=0.020). In addition, the prevalence of anemia was 3.7 times higher in females with menarche experience (OR, 3.65; 95% CI, 2.21–6.05; P<0.001).
Discussion
The prevalence of anemia is decreasing worldwide. DeMaeyer and Adiels-Tegman [11] reported a global prevalence of anemia of 30% in 1960–1985. In contrast, the prevalence of anemia between 1993 and 2005 according to the WHO decreased to 24.8% [1]. The Global Burden of Diseases, Injuries and Risk Factors (GBD) 2010 study reported a decrease in the prevalence of anemia from 40.2% to 32.9% between 1990–2010 [12]. In this study, we showed a decrease in prevalence of anemia in Korean adolescents 10–18 years old from 5.3% in 1998 to 4.3% in 2016–2018. However, the prevalence of anemia was 9 times higher in female adolescents than males. In addition, the prevalence of anemia decreased in male adolescents over time, while there was no change in females.
In this study, the major risk factors for anemia in female participants were age and menarche. The prevalence of anemia in girls younger than 13 years of age was similar to that of same-age boys but increased from the age of 13 years. Similar to our results, the National Health and Nutrition Examination Surveys (NHANES) data from the United States in 2003–2012 showed that the prevalence of anemia increased from 2.1% to 5.1% and 7.1% in females aged 5–11, 12–14, and 15–29 years, respectively [13].
In our study, the average age of menarche was 12.4 years. The Hb levels were highest at 11 years of age and decreased from 12 years of age. The prevalence of anemia increased after the average menarcheal age. In other studies in Korea, the prevalence of anemia among 10- to 18-year-old female adolescents without menarche was 2.5%–3.3% compared to 10.6%–14.9% in those with menarcheal experience [14,15]. In a previous study, the menarcheal age was 13.8 years in Korean female adolescents [16]. In our study, the age of menarche decreased from 13.3 to 11.8 years over the 21 years. In general, anemia is high in menstruating females older than 15 years [1]. However, anemia may develop in younger girls depending on age at menarche.
The main causes of anemia associated with menstruation include IDA and bleeding from obstetric or gynecologic problems. According to a GBD study, 45%–50% of the anemia in females aged 10–19 worldwide was caused by IDA, and 10% was caused by obstetric and/or gynecologic problems [12]. In developed countries, there is a larger proportion of IDA as a cause of anemia than in developing countries. The Biomarkers Reflecting Inflammation and Nutritional Determinants of Anemia (BRINDA) project examined the prevalence of anemia among women aged 15–49 years in 10 countries [17]. In the BRINDA project, IDA explained 71% of cases of anemia in low-infection burden countries compared to 35% in high-infection burden countries. Some reports suggest that IDA in women is associated with years after menarche. In the NHANES data, females aged 12–21 tended to have increased IDA risk when the time since menarche was longer than 3 years [18]. In women aged 22–49, the risk ratio of IDA was 1.9 when the years after menarche was longer than 25.
In our study, higher household income and overweight were associated with lower prevalence of anemia in female adolescents. According to the recent WHO report [1], the prevalence of anemia was 42.7% in low-income countries, 25.6% in medium-income countries, and 9.1% in high-income countries. In the BRINDA project [17], the prevalence of anemia was significantly different according to socioeconomic status in individual countries. In countries with low-infection burden, the prevalence of anemia was 10.0% and 4.1% in low- and high-socioeconomic status individuals, respectively. Our research showed similar results to previous studies. In female adolescents only, there was a difference in the prevalence of anemia according to household income. The low prevalence of anemia in overweight females has been reported in other studies [19-21]. It is presumed to be related to nutrition, and one study reported higher iron intake in overweight [19].
This is a large-scale study that investigated the prevalence of anemia and its possible risk factors in Korean adolescents. Our results reflect representative data from Korea. However, this study did not include children younger than 10 years. In addition, the KNHANES has limitations in collecting detailed information; the KNHANES contains a wide range of data for investigating public health behaviors. Therefore, we were unable to analyze the causes of anemia in our study. In our study, normocytic anemia was the most common type in both males and females, and microcytic anemia and hypochromic anemia were higher in females than males. This is similar to other studies, and it is speculated that the causes of anemia vary [7,22]. To reduce the prevalence of anemia, further studies are needed to determine the causes, and prevention and early diagnosis of disease are important.
As IDA is thought to be the major cause of anemia in female adolescents after menarche, there are recommendations for intake of iron-rich foods starting from the age of 12 and screening for IDA every 5–10 years [23]. Female adolescents are recommended to have a screening test for IDA every year in cases of heavy menstruation, bleeding, low iron intake, or past history of IDA. Patients with anemia who do not have iron deficiency or who do not respond to iron supplement therapy need to be actively evaluated for other causes. Although not common, diagnosis of hereditary spherocytosis and thalassemia is increasing in Korea, so attention should be paid to these conditions [24].
In conclusion, there was a significant decrease in the prevalence of anemia among male adolescents. In contrast, there was no change in the prevalence of anemia in female adolescents over the 21 years of our study. In female adolescents, age and menarcheal experience were identified as significant risk factors. Continuous attention to these factors is needed.


 PDF Links
 PubReader
 ePub Link
 PubMed
 Download Citation


