


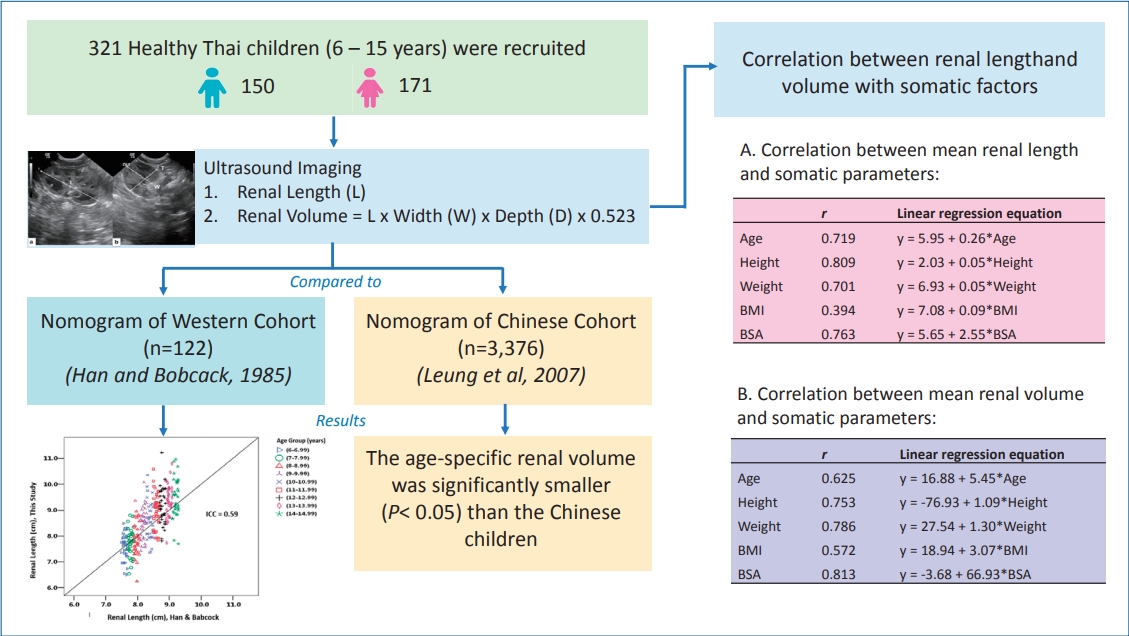
Graphical abstract. Sonographic renal length and volume of normal Thai children versus their Chinese and Western counterparts. BMI, body mass index; BSA, body surface area.
Introduction
Renal size assessment is vital in the evaluation, diagnosis, and follow-up of pediatric patients with KUB (kidney, ureters, and bladder) pathology, as well as for urinary tract infection (UTI) as many renal disorders will affect the kidneys growth and development [1-7].
Normative standards for assessing renal size are commonly used in clinical practice. These standards rely upon comparison of the renal lengths or calculated volumes, or both, with a variety of somatic factors such as body surface area (BSA), weight, height, sex, and chronological age [7].
Two-dimensional ultrasonography (2D-US) is a method of choice for measurement of kidney sizes in children due to its noninvasiveness, nonionizing, cost-effectiveness and can be performed at the hospital bedside [1-3,5,7-10]. Although renal volume is a more accurate parameter in reflecting the renal growth, renal length is more commonly used for diagnostic purposes because it can be easily measured and the results can be obtained in situ without complex calculations [6,8]. However, renal length measurement is prone to inter- and intraobserver errors, besides having poor consistency due to the complex shape of the kidney [4,6]. Measuring renal volume is a better way in detecting abnormalities, especially when biochemical tests show normal results or when the disease cannot be visualized on ultrasonic images. It is also an excellent predictor of renal function and correlates well with other body parameters [8,6].
Renal size and growth may or may not be significantly influenced by ethnicity. According to Leung et al. [11] who studied the nomogram of renal volume calculated using the ellipsoid formula of 2D-US in normal Chinese children, no significant difference was found in renal size and growth when compared to the data of Western children obtained by Schmidt et al. [5].
Currently, the growth chart of age-specific renal length proposed by Han and Babcock [12], which was derived from the Western population is used as a reference by many Thai radiologists and nephrologists in monitoring kidney development of their patients. To our knowledge, there was no study on the renal size and its relationship with somatic parameters among normal Thai children to date. This study, therefore, aimed to measure the renal length and volume of normal Thai children using the ellipsoid formula of 2D-US and to derive their growth chart. The data were then compared to the published data of the Western [12] and Chinese [11] cohorts. The correlations between the renal size (i.e., length and volume) and somatic parameters (i.e., sex, age, height, weight, BSA, and body mass index [BMI]) were also studied.
Methods
1. Subjects
This study was approved by the Medical Ethics Committee of the Siriraj Hospital, Mahidol University, Thailand. A total of 321 children, comprising 150 boys and 171 girls aged between 6 and 15 years were prospectively recruited from the central region of Thailand. The subjects were divided into respective age groups as shown in Table 1. The demographic data, i.e., sex, date of birth, height, weight, as well as renal profile of the subjects were collected before the 2D-US examination.
Subjects who had normal renal profile as evident from a blood test report and did not have current urinary symptom were recruited into the study. Exclusion criteria include a history of known renal disease, hematuria, UTI, increased levels of serum urea and creatinine, any history of renal surgery, and clinical symptoms of dysuria. Subjects were excluded if the 2D-US image quality was too poor to be interpreted or when abnormalities, such as congenital anomaly, renal mass, and hydronephrosis were detected. Children with abnormal renal length, such as the left kidney was significantly longer than the right (≥10 mm) or the right kidney was significantly longer than the left (≥7 mm), were also excluded due to the possibility of an underlying pathology [13]. Informed consent was obtained from the parents of all subjects.
2. Ultrasonographic data acquisition and volume measurement
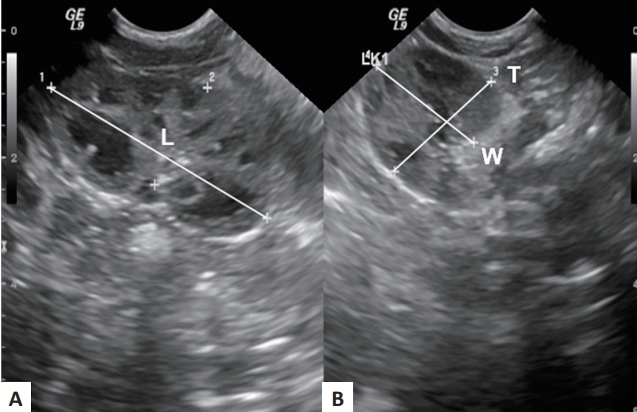
2D-US was performed by a pediatric radiologist with 13 years of experience using the Voluson E6 ultrasonography system with 2–5 MHz transducer (GE Healthcare, Chicago, IL, USA). The subjects were examined in supine oblique position. The maximum renal length was measured along the longitudinal axis of each kidney. The width and thickness were measured in the transverse plane perpendicular to the longitudinal axis of the kidney at the level of the hilum. A sample of the ultrasound image is shown in Fig. 1. The renal volume was calculated using the ellipsoid formula as following:
Renal volume = length × width × depth × 0.523
3. Statistical analysis
Sample size was presented at 95% confidence interval (CI) of the true mean. A previous study of children under age 18 showed that total renal volume increased as age increased with the mean of 124–230 mL (standard deviation [SD], 10.4–17.0) [11]. Using SD of 16.5 mL and a mean estimation error of 5.5 mL, this study required a sample size of at least 35 children in each age group as calculated by the nQuery Advisor software (Statsols, Boston, MA, USA). As this study comprised 9 age groups, the calculated total sample size was 315 subjects.
Renal dimensions (i.e., length, width, thickness, and calculated volume) were presented using descriptive statistics. Statistical analysis was performed using the IBM SPSS Statistics ver. 23.0 (IBM Co., Armonk, NY, USA). One-way analysis of variance was applied to determine the difference in mean renal length and volume among the age groups. Paired t test was used to study the difference in terms of renal length and volume between the left and right kidneys, and between sex in specific age groups. The Pearson correlation coefficient (r) and simple linear regression were used to assess the relationship between renal volume and length with somatic parameters (i.e., age, height, weight, BMI, and BSA). 95% CI was used in all the statistical analysis, whereby P value <0.05 was considered as significant different.
Results
1. Correlations between renal size and somatic parameters
Renal length between the left and right kidneys in each age group was not statistically significant difference (P>0.05) (Supplementary Table 1). Besides, the mean renal length of the left and right kidneys was not statistically significant difference (P>0.05) between boys and girls, except in the 12.00–12.99 age group (P=0.043) (Supplementary Table 2).
There was no statistically significant difference between the renal volume of the left and right kidneys, except in the 13.00–13.99 (P=0.003) and 14.00–14.99 (P=0.004) age groups, as shown in Table 2. There was also no statistically significant difference in terms of renal volume between boys and girls, except in the 7.00–7.99 age group (P=0.006) (Table 3).
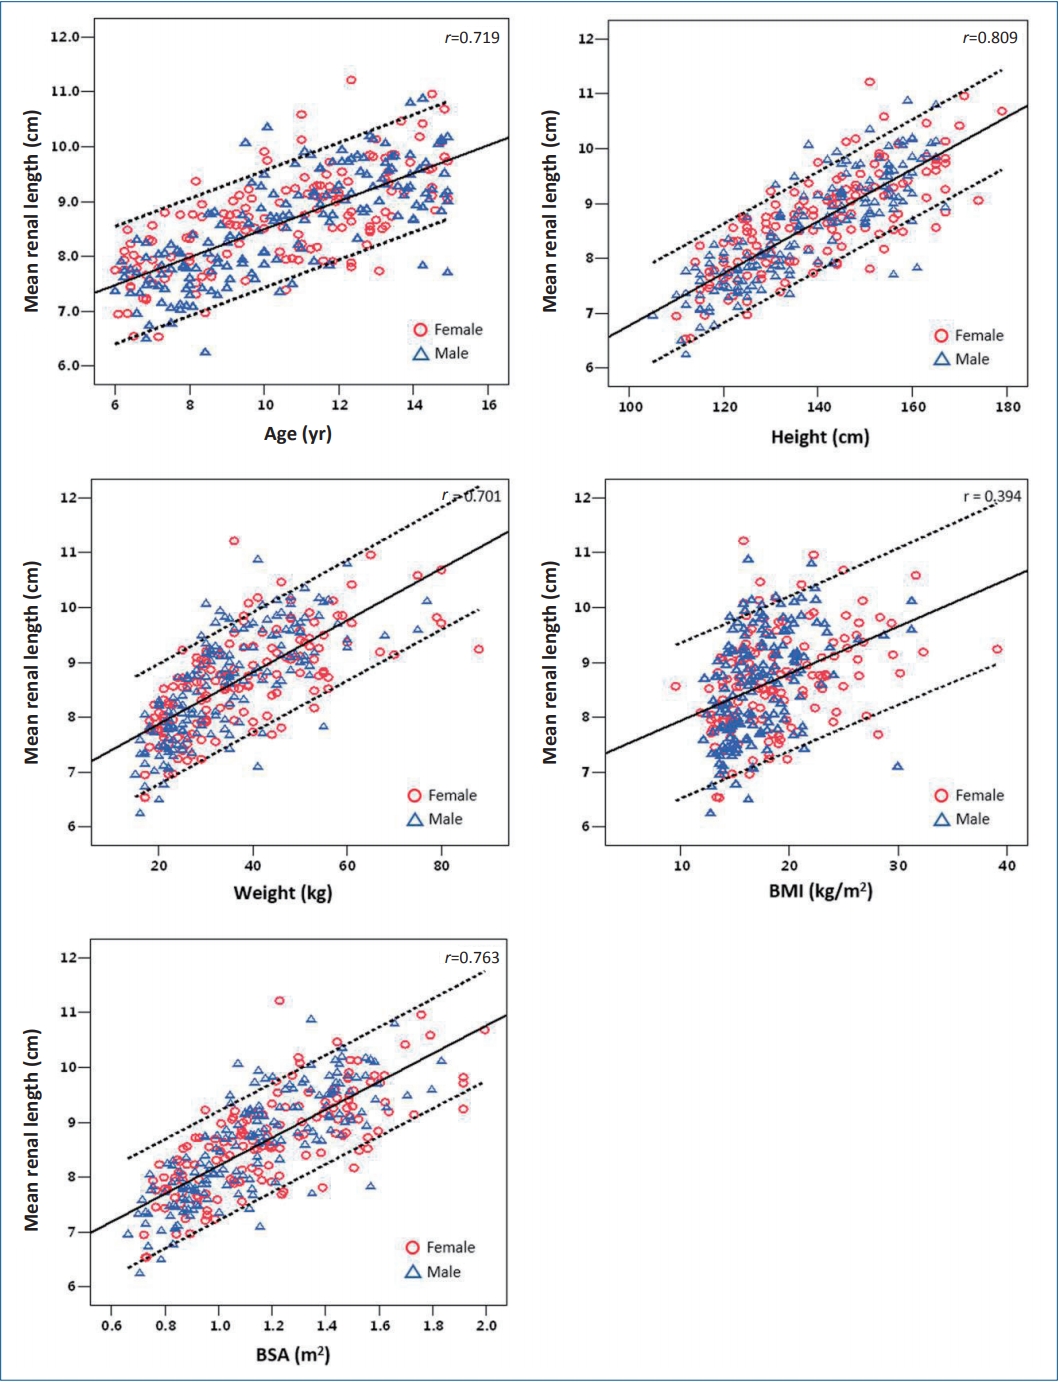
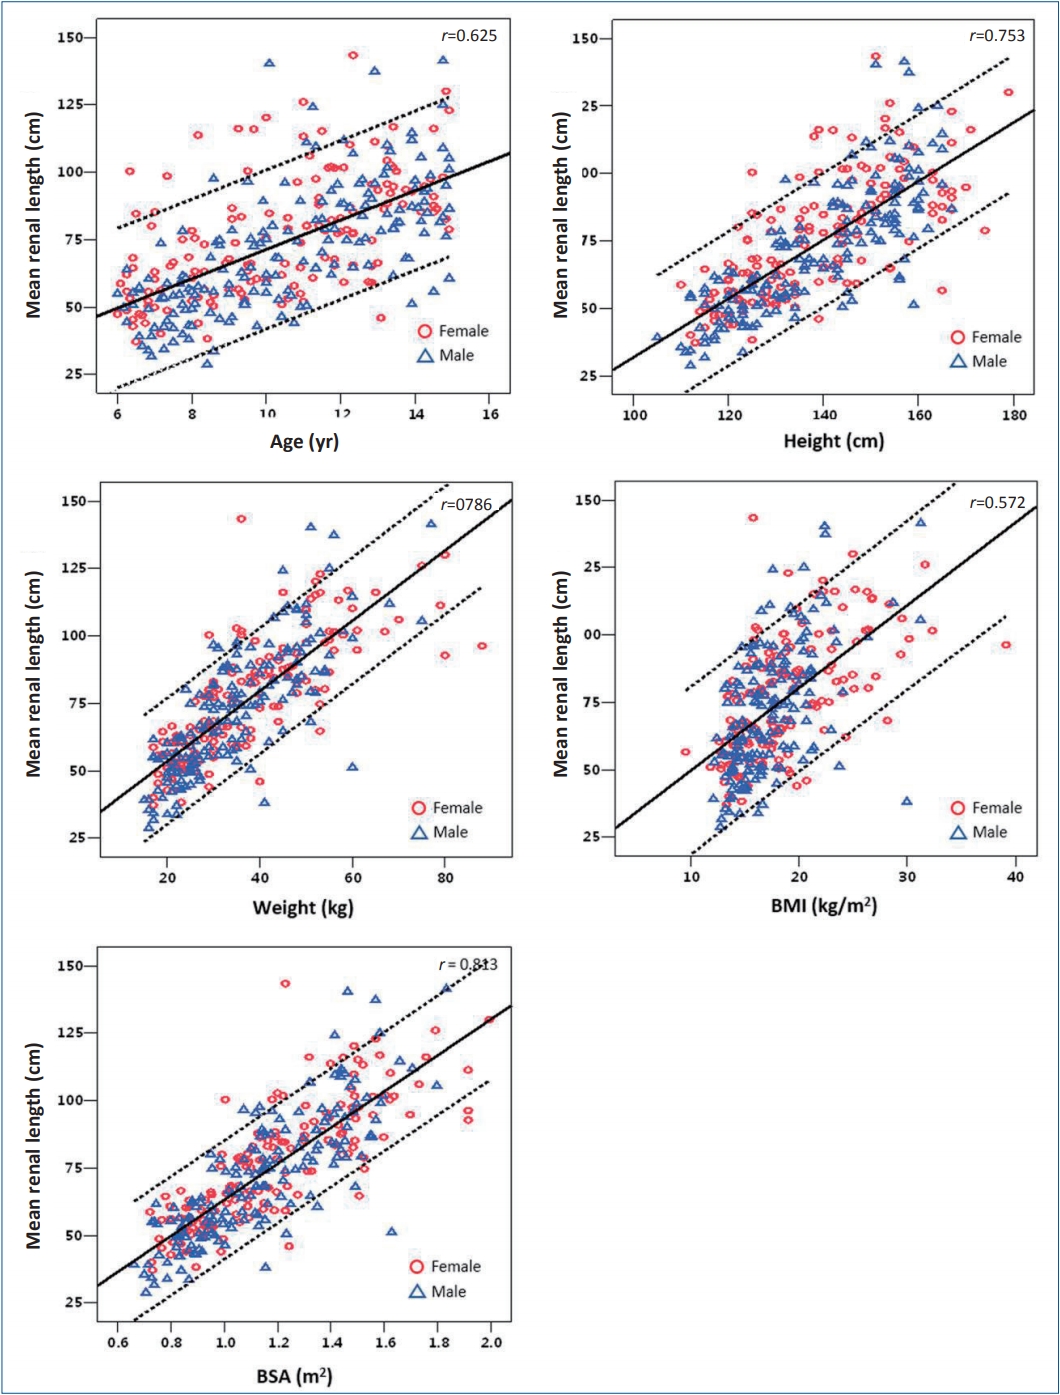
Figs. 2 and 3 show the correlations between renal length and volume with various somatic parameters. Results show that the renal length and volume showed good positive correlation with age, height, weight, and BSA, but weak correlation with BMI (r=0.394 for length and 0.572 for volume). The order of correlation coefficients, r from strongest to weakest for renal length was height (0.819), BSA (0.763), age (0.719), weight (0.701), and BMI (0.394); whereas for renal volume was BSA (0.813), weight (0.786), height (0.753), age (0.625), and BMI (0.572). All the P values obtained were <0.05, indicating that the correlations were significant. Tables 4 and 5 summarize the r values and linear regression equations derived from the simple linear regression analysis.
2. Comparison of age-specific renal length and volume
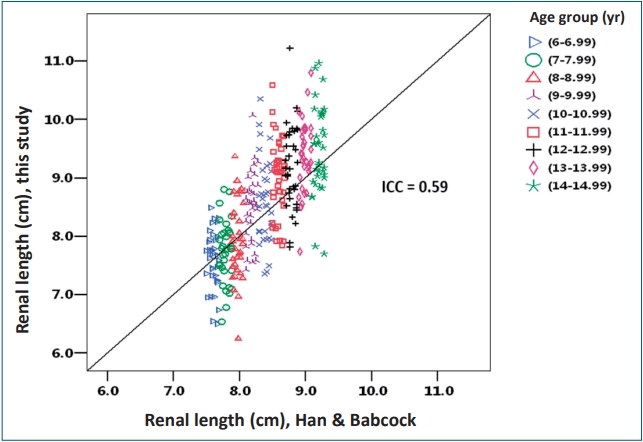
Comparison of the mean total renal volume in each age group between this study and the study of Leung et al. [11] is shown in Table 6. The age-specific total renal volumes in our study were significantly lower (P<0.05) than the data reported by Leung et al. [11], except for the age groups of 6.00–6.99 and 11.00–11.49 years. On the other hand, the correlation of renal length between our study and Han and Babcock [12] study was plotted in Fig. 4. The results showed a fair agreement (ICC=0.59).
Discussion
Similar to other studies, we did not find statistically significant difference in renal length and volume between sex [2,8,14,15] and between the left and right kidneys of the same subject [8,16]. Therefore, it is not necessary to concern about the child’s sex and side of the kidney when examining the kidney size in clinical practice.
This study revealed that renal length had the strongest correlation with height, which is in agreement with other studies [2,7,15,17-19], followed by BSA, age, and weight. On the other hand, renal volume correlates the strongest with BSA, followed by weight, height, and age. This finding is similar to the study of 1,000 Indian children carried out by Otiv et al. [15] and a study by Scholbach et al. [16] involving 624 children in Germany. BMI had weak and moderate correlations with renal length and volume, respectively. This finding is in agreement with many other published studies [18,20-22]. Therefore, it is suggested that the 4 somatic parameters (i.e., height, weight, BSA, and age) have strong positive correlation with the renal size, making them all applicable as predictors for normal renal size in children between 6- and 15-year-olds. Although height may statistically be the most reliable parameter to predict renal length, and BSA for volume, we believe that age would be the easiest and most practical approach to be used in clinical practice.
The age-specific renal length in Thai children showed only moderate correlation (ICC=0.59) with the nomogram reported by Han and Babcock [12]. Han and Babcock are one of the pioneers who assessed renal dimensions and appearance in normal children using ultrasonography. They highlighted that the dimensions and appearance of normal kidneys on sonogram in newborn and young children are unlike those of older children and adults. They have subsequently developed nomograms according to age, height, weight, and BSA for evaluating normal renal size in children with predicted means and 95% prediction intervals. Among all the parameters, the nomogram according to age is the most commonly used normative standards for evaluating renal size in clinical circumstances. Although the nomogram derived from the study of Han and Babcock was based on an American cohort of 122 healthy children, the nomogram has been widely referred in most of the hospitals in Thailand until today, primarily due to the lack of local data.
In addition, the age-specific renal volume of the Thai children was significantly lower than their Chinese peers [11]. This observation was in line with a preliminary study carried out on 101 Thai infants (median age of 1) in Siriraj Hospital, Thailand. Unfortunately, both studies from Han and Bobcock [12] and Leung et al. [11] did not reveal the somatic parameters such as height, weight, and BSA for the respective age groups in their publications, therefore we were unable to compare the somatic factors between our study and Leung et al. [11]. Nevertheless, according to a publication by Zong and Li [23], the weight of the Chinese boys was strikingly heavier than the World Health Organization (WHO) Child Growth Standards at age 6 to 10 years. Their height was also higher than the WHO Standards for boys below 15 years and for girls below 13, but was significantly lower when boys over 15 years and girls over 13. This finding has caught attention as many researchers have anticipated that Asian generally has smaller body habitus compared to other populations. The authors explained that the differences between China and WHO standards are mainly caused by the reference population of different ethnics and economy background. In another study [24], the authors investigated the physical growth of children and adolescents in China between 1975 and 2010. It was found that the growth of children and adolescents in China has improved in tandem with economic development over the past 35 years and therefore a new China reference should be developed. In comparison, Thai children have relatively smaller body habitus as shown in a recent publication [25]. The height and weight in our study population are also smaller than the WHO Standards. Hence, it can be determined that the nomogram of pediatric renal volume derived from Leung et al. [11] was not compatible with the Thai children. We, therefore, concluded that children of different ethnicity, nationalities, and other somatic factors may have different renal growth rates, indicating the need for establishing local reference values for clinical use. The linear regression equations developed from this study may be a useful reference to determine the renal length and volume of Thai children, although further studies should be conducted at different regions in the country.
There were several limitations in this study. Firstly, the number of subjects recruited was the minimum derived by statistical calculation, which would reflect the lowest limit in a growth chart. As this was the first prospective study of renal length and volume for normal Thai children in various age groups, the sample size should be increased in future studies. Secondly, 2D-US might not be the most accurate tool for renal volume measurement as it might underestimate the results, according to some publications [1,4]. Some studies have actually suggested that 3-dimensional US is a more reliable tool in measuring renal volume in children. In addition, children in Thailand are multiethnics and their renal size may vary between regions and ethnicities. Therefore, more localized studies are needed to compare the renal size between regions and ethnicities. In this study, we assumed that the mean body weight and height were representative of the average children body size across the country.
In conclusion, we found good positive correlations between renal sizes and somatic parameters such as BSA, height, weight, and age, except BMI. Height appeared to be the most reliable indicator for renal length and BSA for volume, however, age could also be used as a practical parameter in estimating the renal size in children between 6- and 15-year-olds. No statistically significant difference was found on renal length and volume between boys and girls, and between the left and right kidneys. The total renal volumes of normal Thai children in our study were significantly smaller than the Chinese cohort [11]. The renal length also showed moderate agreement (ICC=0.59) with the nomogram recommended by Han and Babcock [12]. Therefore, it can be concluded that the normal renal sizes in children varied from region to region and a local reference standard would be useful in determining the normal renal size in children within the population.
 PDF Links
 PubReader
 ePub Link
 PubMed
 Download Citation


