Warning: fopen(/home/virtual/pediatrics/journal/upload/ip_log/ip_log_2024-03.txt) [function.fopen]: failed to open stream: Permission denied in /home/virtual/pediatrics/journal/ip_info/view_data.php on line 82

Warning: fwrite(): supplied argument is not a valid stream resource in /home/virtual/pediatrics/journal/ip_info/view_data.php on line 83
Prevalence of hyperuricemia and its association with metabolic syndrome and cardiometabolic risk factors in Korean children and adolescents: analysis based on the 2016–2017 Korea National Health and Nutrition Examination Survey

Volume 62(8); August

< Previous     Next >

Article Contents

Clin Exp Pediatr > Volume 62(8); 2019
Lee: Prevalence of hyperuricemia and its association with metabolic syndrome and cardiometabolic risk factors in Korean children and adolescents: analysis based on the 2016–2017 Korea National Health and Nutrition Examination Survey

Abstract

Purpose

Investigating the prevalence of hyperuricemia and its association with metabolic syndrome (MetS) and cardiometabolic risk factors (CMRFs) in Korean children and adolescents.

Methods

This cross-sectional survey used data from the 7th Korea National Health and Nutrition Examination Survey (2016–2017); 1,256 males and females aged 10–18 years were included. Hyperuricemia was defined as serum uric acid levels were >6.6 mg/dL at 10–11 years of age (both sexes), >7.7 mg/dL for males at 12–18 years of age and >5.7 mg/dL for females at 12–18 years of age. MetS was defined by the International Diabetes Federation criteria. Logistic regression analysis was used to analyze hyperuricemia-associated risk factors.

Results

The prevalence of hyperuricemia was 9.4% (male, 8.4%; female, 10.5%) (P<0.281). After adjusting for sociodemographic factors and health behaviors in multivariate analysis (model 1), the odds ratio (OR) for hyperuricemia of MetS was 3.05 (95% confidence interval [CI], 1.17–7.92; P=0.022). After adjusting for the same variables in model 1 plus obesity and all MetS components (model 2), only abdominal obesity was significant, and the OR for hyperuricemia was 3.38 (95% CI, 1.72–6.63; P<0.001) After adjusting for the same variables in model 1 plus body mass index (BMI) z scores and all MetS components except abdominal obesity (model 3), only BMI z scores was significant, and the OR for hyperuricemia was 1.59 (95% CI, 1.34–1.89; P<0.001).

Conclusion

MetS, abdominal obesity, and BMI z scores were CMRFs significantly associated with hyperuricemia in Korean children and adolescents. Therefore, attention should be paid to hyperuricemia in patients with obesity or MetS.

Key message

Question: What is the prevalence of hyperuricemia and its association with MetS and CMRFs in Korean children and adolescents?
Finding: The prevalence of hyperuricemia in Korean children and adolescents is 9.4%. MetS, abdominal obesity, and BMI z scores were found to be the CMRFs significantly associated with hyperuricemia.
Meaning: Attention should be paid to hyperuricemia in patients with obesity or MetS.

Introduction

Metabolic syndrome (MetS) is a cluster of cardiometabolic risk factors (CMFRs) of abdominal obesity, hypertension, dyslipidemia, and impaired fasting glucose [1]. It can also occur in children and adolescents and affects adulthood [2]. Serum levels of uric acid, the metabolite of purine, are associated with MetS and CMRFs such as obesity in adults and children [3,4], and may be considered indirect findings of MetS [5].
The prevalence of hyperuricemia is increasing worldwide [6], and the prevalence of hyperuricemia in pediatric adolescents varies from 0.6% to 50.4% in several countries, depending on sex, age, ethnicity, and region [4,7-13], but there are no national reports on children and adolescents in Korea.
Korea National Health and Nutrition Examination Survey (KNHANES) is a nationwide survey conducted by the Korea Centers for Disease Control and Prevention (KCDC) to provide national statistics on national health and nutritional status. KCDC provides the basis for policy formulation and evaluation. A serum uric acid (SUA) test was added to participants aged 10 years or older in the 7th Survey conducted since 2016. The purpose of the present study was to investigate the prevalence of hyperuricemia and its association with MetS and CMRFs in Korean children and adolescents based on the data of KNHANES.

Materials and methods

1. Study participants

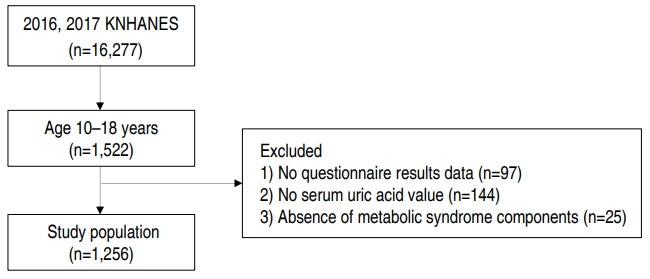
This study was conducted using data from 2016 and 2017 of the 7th KNHANES. A total of 1,522 children aged 10–18 years were in the 7th KNHANES. Among them, 97 children for whom there was not enough survey data, 144 who did not undergo uric acid test, and 25 whose MetS could not be evaluated were excluded. Finally, a total of 1,256 children were included in the study (Fig. 1). Written informed consent was obtained from all the participants or their parents, and this study was approved by the Institutional Review Board of the Kosin University Gospel Hospital (KUGH 2019-03-016).

2. Data collection and study variables

The participants’ sociodemographic factors (age, sex, residential regions, and household income) and health behaviors (smoking status, drinking status, and physical activity [sitting time] during the day) were checked through questionnaires. The areas of the participants’ residence were categories into 2 groups (rural or urban). Household income level was classified as low, middle-low, middle-high, and high with reference to the average monthly household equivalent income by the square root of the number of household members. Smoking status was categorized into 3 groups, according to their smoking habits or exposure to cigarette smoke in the past 30 days: nonsmokers (those who had never smoked), passive smokers (indoor exposure to smoking at home or public institutions), and current smokers (those who smoked at least 1 cigarette a day). Drinking status was divided into 3 groups, based on the frequency of alcohol intake in the past year: nondrinkers (<1 time per month), light drinkers (2–4 times per month), and heavy drinkers (≥2 times per week). The level of physical activity was self-reported, using the Global Physical Activity Questionnaire, in the KNHANES. Sitting time was defined as time (hr) of sitting for 1 day.
Anthropometric measurements were made by trained test takers in light clothing and naked shoes. Height was measured to the first decimal place (0.1 cm) using a stadiometer (Seca 225, Seca, Hamburg, Germany). Weight was measured to one decimal place (0.1 kg) using an electronic balance (GL600020, Gtech, Seoul, Korea). Body mass index (BMI) (kg/m2) was calculated by dividing body weight by the square of the body height. BMI status was defined by sex- and age-specific percentiles: normal (BMI<85th percentile), overweight (85th percentile≤BMI<95th percentile), and obesity (BMI≥95th percentile). Height, weight, and BMI were converted to z scores by using the 2017 Korean National Growth Charts [14]. Waist circumference (WC) was measured to one decimal place (0.1 cm) using a tape measure (Seca 220, Seca) at the midpoint between the bottom of the last rib and the iliac crest. After resting for 5 minutes in a sitting position, blood pressure (BP) was measured using a mercury sphygmomanometer (Baumanometer Desk model 0320 in 2011-2012 and Baumanometer Wall Unit 33 [0820], 2013–2016, Baum, NY, USA). The average of the last 2 values was used for the analysis. After 8-hour fasting, participants’ blood samples were collected by the trained medical staff. The levels of SUA (mg/dL), total cholesterol (TC) (mg/dL), triglyceride (TG) (mg/dL), high-density lipoprotein cholesterol (HDL-C) (mg/dL), and fasting plasma glucose (FPG) (mg/dL) were measured via colorimetry determination with the uricase-catalase system (Hitachi automatic analyzer 7600-210, Japan). Low-density lipoprotein cholesterol (LDL-C) level was calculated by the Friedewald formula (TC minus HDL-C minus TG/5 in mg/dL) [15]. All laboratory tests were conducted at a central laboratory. Hyperuricemia was defined when SUA levels were >6.6 mg/dL at 10–11 years of age (both sexes), and >7.7 mg/dL for males and >5.7 mg/dL for females both at 12-18 years of age [16].
MetS was confirmed via the International Diabetes Federation criteria [17], when a participant had abdominal obesity and 2 or more of the other 4 components of MetS: abdominal obesity (WC≥90th percentile in those aged 10–15 years, ≥90 cm in males and ≥80 cm in females aged 16–18 years), high TG (≥150 mg/dL), low HDL-C (<40 mg/dL in males aged 10–18 years and females aged 10–15 years, and <50 mg/dL in females aged 16–18 years), high BP (systolic BP [SBP]≥130 mmHg or diastolic BP [DBP]≥85 mmHg), and impaired FPG (≥100 mg/dL). WC≥90th percentile for age and sex was estimated using reference data from the 2007 Korean National Growth Charts [18].

3. Statistical analysis

This data was analyzed by applying weighted, stratified, and clustered variables to the data extracted from the complex stratified sample. Weights were calculated using the integrated weights in 2016 and 2017 using ‘itvex,’ which is the weight at the health interview and health examination. Statistical methods for comparing the general features of hyperuricemia and non-hyperuricemia were categorical variables using the complex sample crosstabs method and continuous variables using the complex sample generalized linear model. Values were presented as weighted mean±standard error or number of cases (weighted percent). Complex sample logistic regression analysis was used to analyze the risk factors associated with hyperuricemia in previous studies [4,19,20]. Three multivariate logistic regression models were performed. Model 1 was performed to determine the association between MetS and hyperuricemia with adjusting for sociodemographic factors and health behaviors. Model 2 was examined with adjustment for the same variables in model 1 plus obesity and all MetS components. Model 3 was analyzed with adjusting for the same variables in model 1 plus BMI z scores, and all MetS components except abdominal obesity. Statistical significance was defined as P<0.05. All statistical analyzes were performed using IBM SPSS Statistics ver. 25.0 (IBM Co., Armonk, NY, USA).

Results

1. SUA levels and prevalence of hyperuricemia by sex

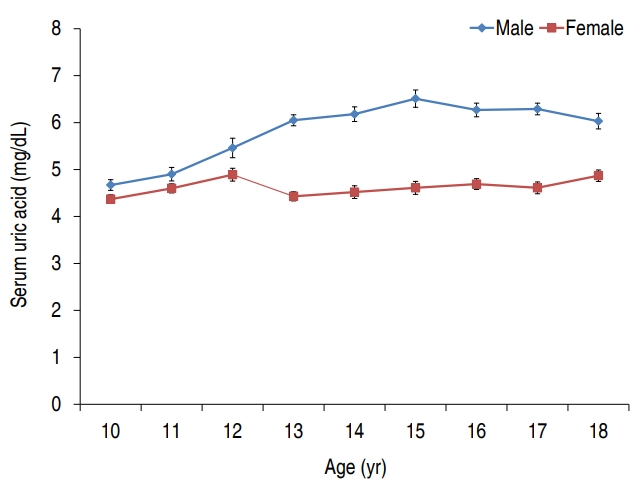
The mean SUA levels was 5.3±0.1 mg/dL, and the mean SUA levels in males and females were 5.9±0.1 mg/dL and 4.6±0.1 mg/dL, respectively (P<0.001) (Table 1, Fig. 2). Male SUA levels tended to increase significantly with age (P<0.001), while female age-based SUA levels were not statistically significant but showed an increasing tendency (P=0.052).
Of the total 1,256 patients, 115 had hyperuricemia and its prevalence was 9.4%. The prevalence of males and females were 8.4% (55 of 655) and 10.5% (60 of 601), respectively (P=0.281) (Table 1).

2. General characteristics of participants with versus without hyperuricemia

The mean age was 14.8±0.1 years (15.2±0.2 years in hyperuricemic and 14.4±0.1 years in nonhyperuricemic participants) (P=0.001) (Table 2). There was no difference between the 2 groups in terms of residential regions, household income, smoking status, drinking status, sitting time, height z scores, TC and LDL-C (Table 2).
In hyperuricemic groups, age, weight, weight z scores, height, WC, BMI, BMI z scores, SBP, and DBP were higher than those of nonhyperuricemic group, and HDL-C was lower than those of nonhyperuricemic group (Table 2).

3. Prevalence by BMI status, MetS, and metabolic components in participants with versus without hyperuricemia

The 2 groups had significant differences in BMI status (Table 3). The prevalence of hyperuricemia was 22.4% in obese and 7.7% in nonobese participants (17.0% [20 of 128] in overweight participants and 6.5% [59 of 988] in participants with normal weight). Of the total children, 30 (2.5%) had MetS. The prevalence of MetS in the hyperuricemic group was 6.3%, which was higher than that in nonhyperuricemic group (P=0.034) (Table 3). The prevalence of abdominal obesity, high TG, low HDL-C, and high SBP, which are the components of MetS, was significantly higher in the hyperuricemic group (Table 3).

4. Logistic regression analysis of risk factors associated with hyperuricemia

Univariate and multivariate logistic regression analysis was performed to identify CMRFs associated with hyperuricemia (Table 4). In model 1 multivariate analysis, the odds ratio (OR) for hyperuricemia of MetS was 3.05 (95% confidence interval [CI], 1.17–7.92; P=0.022) (Table 4). In model 2, only abdominal obesity was significant, and the OR for hyperuricemia was 3.38 (95% CI, 1.72–6.63; P<0.001) (Table 4). In model 3, all MetS components except abdominal obesity were not statistically significant and the OR for hyperuricemia of BMI z scores was 1.59 (95% CI, 1.34–1.89; P<0.001) (Table 4).

Discussion

In this study, the mean SUA levels of Korean children and adolescents differed by 5.9±0.1 mg/dL and 4.6±0.1 mg/dL for males and females, respectively. These differences were also reported in prior studies in other countries, and studies in Brazil and Japan for children and adolescents also found that males have higher SUA levels than females [7,8]. In this study, male SUA levels increased significantly with age, whereas female SUA levels according to age was not statistically significant but showed an increasing tendency. This is similar to the reported increase in SUA levels with age in previous studies [8,21]. Generally, the SUA concentration increases gradually with age from birth to puberty, and is the same in men and women, due to decreased urinary excretion of the kidney to adult levels and increased body mass [22]. By midpuberty, body weight and SUA levels in men overtake those of women, and plateau in both sexes during late puberty because of the effects of sex hormones [22]. Testosterones make the body maturation more prominent and increase SUA levels [23], and estrogens inhibit reabsorption of uric acid in kidneys [24].
The prevalence of hyperuricemia is known to be higher in men than in women, and a study in Korean adults have also shown more prevalence in men than in women [6,20], but the results of this study were different. These results are similar to those of various studies of children and adolescents in Korea and abroad. Choi et el. [25] applied a similar cutoff value to a study of Korean middle school students (n=3,615) aged 14-15 years in 2003. In the study of Choi et al. [25], the prevalence of hyperuricemia was estimated to be about 7.3% (8.1% in males and 9.1% in females), which was higher in females than in males. Similarly, among the United States adolescents, the prevalence of hyperuricemia was 6% in males and 9% in females, and was also higher in females when the cutoff value of hyperuricemia was applied to the same values as in this study [4]. In a study of children and adolescents in Taiwan [9], a cutoff value similar to that used in this study was used. The prevalence rate was very high, 50.4% for males and 37.7% for females, and the prevalence was lower in females [9]. Thus, the prevalence of hyperuricemia can vary depending on age, sex, and race.
The prevalence of obesity and MetS was higher in hyperuricemic participants. Moreover, the prevalence of hyperuricemia in obese participants was higher than in nonobese participants. BMI z scores were a significant associated with hyperuricemia in multivariate analysis. These results are consistent with reports of a significant association between obesity and hyperuricemia in a study of overweight or obese children and adolescents [11,12]. In a study of children and adolescents in the United States, the risk of MetS was higher in those with higher SUA levels; in a study of adults in the United States, the risk of MetS increased with increasing SUA levels [3,4]. The results are consistent with the results of this study.
The most powerful CMRF associated with hyperuricemia among the components of the MetS used in this study was abdominal obesity assessed by WC measurements. Also, the prevalence of abdominal obesity was higher in children with hyperuricemia than in those without hyperuricemia, consistent with the results of children and adolescent studies in the United States, Italy, and Taiwan [4,12,26]. Abdominal obesity and insulin resistance are the main pathogenesis of MetS and are related to each other [27,28]. Insulin resistance increases the level of insulin in the blood, and increased insulin stimulates the resorption of uric acid in the kidneys, thereby increasing SUA levels [4,12,29]. The process of transferring free fatty acid from visceral fat to the liver promotes uric acid production, and when the uric acid concentration increases, nitric oxide activity decreases and insulin resistance is promoted again [30]. Thus, hyperuricemia, insulin resistance, and abdominal obesity are related to each other.
The prevalence of hypertriglyceridemia and low HDL-C were high in children and adolescents with hyperuricemia. These results are consistent with previous reports. The results of studies on children aged 3–6 years in China also show a high prevalence of hypertriglyceridemia when hyperuricemia was present [13]. Wun et al. [31] suggested that nicotinamide adenine dinucleotide phosphate, which is required for the synthesis of TG, increases the production of uric acid. Low HDL-C has a positive correlation with SUA concentration [32]. Hypertriglyceridemia and Low HDL-C have been reported to be associated with insulin resistance [33].
In children and adolescents with hyperuricemia, the proportion of high SBP, which is a component of MetS and a CMRF, was higher. Hyperuricemia is also associated with hypertension in studies on children and adolescents in Brazil and the United States [7,10]. The Bogalusa Heart Study reported that the SUA level in childhood is a risk of developing adult hypertension after a 12-year follow-up period [34]. The mechanism by which uric acid induces hypertension is explained by endothelial dysfunction due to direct vascular toxicity of uric acid and activation of the renin-angiotensin system [35].
There are several limitations to this study. First, as it is a cross-sectional study, the causal relationship of factors related to hyperuricemia could not be clarified. Second, there was no data on sex hormone levels and sexual maturity; therefore, the exact trend of changes in SUA levels and incidence of hyperuricemia with changes in pubertal stages was not revealed. Third, no blood insulin test was performed, and the correlation between hyperuricemia and insulin resistance could not be quantified accurately. However, this study is relevant as it is the first report, to the best of my knowledge, on the prevalence of hyperuricemia in Korean children and adolescents based on the data of the KNHANES. Second, this study confirmed that hyperuricemia is associated with MetS and CMRFs.
In conclusion, MetS, abdominal obesity, and BMI z scores were CMRFs significantly associated with hyperuricemia in Korean children and adolescents. Therefore, attention should be paid to hyperuricemia in patients with obesity or MetS.

Conflicts of interest

No potential conflict of interest relevant to this article was reported.

Acknowledgments

I thank the Korea Centers for Disease Control and Prevention for providing the data.

Fig. 1.
Flow chart showing study population. KNHANES, Korea National Health and Nutrition Examination Survey.
kjp-2019-00444f1.jpg
Fig. 2.
Serum uric acid levels in Korean children and adolescents by sex and age.
kjp-2019-00444f2.jpg
Table 1.
Serum uric acid levels and prevalence of hyperuricemia by sex
Variable Total (n=1,256) Hyperuricemia (n=115) No hyperuricemia (n=1,141) P value
Serum uric acid (mg/dL)
 Male 5.9±0.1 8.3±0.1 5.7±0.1 <0.001
 Female 4.6±0.1 6.3±0.1 4.4±0.0 <0.001
Overall 5.3±0.1 7.3±0.1 5.1±0.1 <0.001
Prevalence 0.281a)
 Male 655 55 (8.4) 600
 Female 601 60 (10.5) 541
 Overall 1,256 115 (9.4) 1,141

Values are presented as weighted mean±standard error or number of cases (weighted percent).

Boldface indicates a statistically significant difference with P<0.05.

a) Comparison of prevalence of male and female children in the hyperuricemia group.

Table 2.
General characteristics of participants with versus without hyperuricemia
Characteristic Total (n=1,256) Hyperuricemia (n=115) No hyperuricemia (n=1,141) P value
Age (yr) 14.8±0.1 15.2±0.2 14.4±0.1 0.001
Male sex 655 (53.2) 55 (47.5) 600 (53.8) 0.281
Residential regions 0.664
 Urban 1,096 (88.8) 100 (87.4) 996 (88.9)
 Rural 160 (11.2) 15 (12.6) 145 (11.1)
Household income 0.914
 Low 130 (11.2) 13 (13.0) 117 (11.0)
 Middle-low 285 (23.8) 24 (23.2) 261 (23.8)
 Middle-high 398 (31.0) 41 (31.2) 357 (31.0)
 High 443 (34.1) 37 (32.7) 406 (34.2)
Smoking status 0.910
 None 857 (66.1) 76 (65.1) 781 (66.2)
 Passive 348 (29.0) 34 (30.6) 314 (28.8)
 Current 51 (4.9) 5 (4.3) 46 (5.0)
Drinking status 0.079
 None 1,161 (90.3) 104 (86.4) 1,057 (90.7)
 Light drinker 80 (8.1) 11 (13.6) 69 (7.5)
 Heavy drinker 15 (1.6) 0 (0) 15 (1.7)
Sitting time (hr/day) 11.2±0.1 11.2±0.4 11.2±0.1 0.997
Weight (kg) 55.9±0.5 64.8±1.6 54.9±0.5 <0.001
Weight z scores 0.23±0.04 1.01±0.16 0.15±0.04 <0.001
Height (cm) 162.5±0.4 164.7±1.0 162.3±0.4 0.029
Height z scores 0.27±0.04 0.27±0.13 0.26±0.04 0.968
WC (cm) 70.6±0.4 77.7±1.3 69.8±.4 <0.001
BMI (kg/m2) 20.9±0.1 23.8±0.5 20.6±0.1 <0.001
BMI z scores 0.08±0.05 1.01±0.17 -0.02±0.04 <0.001
SBP (mmHg) 108.7±0.4 111.9±1.0 108.3±0.4 0.001
DBP (mmHg) 66.8±0.3 68.9±0.7 66.6±0.3 0.002
TC (mg/dL) 164.8±0.9 167.9±3.0 164.5±1.0 0.275
TG (mg/dL) 84.9±1.7 95.9±6.1 83.7±1.6 0.050
HDL-C (mg/dL) 51.9±0.3 49.2±1.0 52.2±0.3 0.004
LDL-C (mg/dL) 95.9±0.8 99.5±2.5 95.5±0.8 0.138
FPG (mg/dL) 91.5±0.3 90.0±0.8 91.7±0.3 0.042

Values are presented as weighted mean±standard error or number of cases (weighted percent).

WC, waist circumference; BMI, body mass index; SBP, systolic blood pressure; DBP, diastolic blood pressure; TC, total cholesterol; TG, triglycerides; HDL-C, high-density lipoprotein cholesterol; LDL-C, low-density lipoprotein cholesterol; FPG, fasting plasma glucose.

Boldface indicates a statistically significant difference with P<0.05.

Table 3.
Prevalence by body mass index status, metabolic syndrome, and metabolic components in participants with versus without hyperuricemia
Variablea) Total (n=1,256) Hyperuricemia (n=115) No hyperuricemia (n=1,141) P value
BMI status
 Normal 988 (78.9) 59 (55.0) 929 (81.3) <0.001
 Overweight 128 (9.5) 20 (17.3) 108 (8.7)
 Obesity 140 (11.6) 36 (27.7) 104 (10.0)
Metabolic syndrome 30 (2.5) 7 (6.3) 23 (2.1) 0.034
Metabolic components
 Abdominal obesity 143 (11.5) 38 (30.4) 105 (9.5) <0.001
 High TG 106 (8.1) 16 (14.4) 90 (7.4) 0.030
 Low HDL-C 190 (15.5) 31 (28.5) 159 (14.2) 0.001
 High BP 46 (3.8) 9 (6.1) 37 (3.5) 0.178
  High SBP 34 (2.5) 9 (6.1) 25 (2.2) 0.022
  High DBP 16 (1.6) 1 (0.7) 15 (1.6) 0.358
 Impaired FPG 154 (11.8) 10 (9.7) 144 (12.0) 0.496

Values are presented as number of cases (weighted percent).

BMI, body mass index; TG, triglycerides; HDL-C, high-density lipoprotein cholesterol; BP, blood pressure; SBP, systolic blood pressure; DBP, diastolic blood pressure; FPG, fasting plasma glucose; WC, waist circumference.

Boldface indicates a statistically significant difference with P<0.05.

a) BMI status was defined by sex- and age-specific percentiles: normal (BMI< 85th percentile), overweight (85th percentile≤BMI<95th percentile), and obesity (BMI≥95th percentile). Abdominal obesity (WC≥90th percentile in those aged 10–15 years, ≥90 cm in males and ≥80 cm in females aged 16–18 years), high TG (≥150 mg/dL), low HDL-C (<40 mg/dL in males aged 10–18 years and females aged 10–15 years, and <50 mg/dL in females aged 16–18 years), high BP (SBP≥130 mmHg or DBP≥85 mmHg), and impaired FPG (≥100 mg/dL). WC≥90th percentile for age and sex was estimated using reference data from the 2007 Korean National Growth Charts.

Table 4.
Logistic regression analysis of risk factors associated with hyperuricemia
Variablea) Univariate
P value Multivariate model 1b), 2c)
P value Multivariate model 3d)
P value
OR 95% CI OR 95% CI OR 95% CI
Age 1.13 1.05–1.23 0.002 0.95 0.82–1.09 0.448 0.95 0.81–1.10 0.478
Female sex 1.29 0.81–2.04 0.281 1.31 0.83–2.08 0.244 1.31 0.82–2.11 0.261
Residential regions (rural) 1.15 0.61–2.19 0.659 1.22 0.63–2.39 0.555 1.17 0.57–2.42 0.669
Household income
 Low ref ref ref
 Middle-low 0.82 0.38–1.78 0.615 0.95 0.41–2.20 0.907 0.88 0.37–2.08 0.771
 Middle-high 0.85 0.42–1.75 0.663 0.88 0.40–1.94 0.741 0.95 0.41–2.19 0.902
 High 0.81 0.40–1.63 0.548 0.95 0.43–2.08 0.894 0.92 0.41–2.06 0.842
Smoking status
 None ref ref ref
 Passive 1.08 0.67–1.75 0.747 0.84 0.48–1.44 0.516 0.83 0.47–1.46 0.520
 Current 0.88 0.32–2.48 0.814 0.49 0.15–1.64 0.247 0.53 0.16–1.82 0.315
Drinking status
 None ref ref ref
 Drinker 1.55 0.74–3.24 0.247 1.55 0.67–3.61 0.308 1.66 0.68–4.06 0.266
Sitting time (hr/day) 1.00 0.90–1.11 0.997 1.01 0.91–1.11 0.899 1.01 0.91–1.11 0.890
BMI z scores 1.65 1.42–1.90 <0.001 1.59 1.34–1.89 <0.001
BMI status
 Nonobesity ref ref ref
 Obesity 3.47 2.12–5.69 <0.001 1.17 0.59–2.36 0.650
Metabolic syndromeb) 3.16 1.21–8.26 0.019 3.05 1.17–7.92 0.022
Metabolic components
 Abdominal obesity 4.14 2.58–6.67 <0.001 3.38 1.72–6.63 <0.001
 High TG 2.09 1.12–3.90 0.021 1.61 0.83–3.14 0.159 1.63 0.84–3.18 0.152
 Low HDL-C 2.41 1.46–3.98 0.001 1.42 0.80–2.52 0.234 1.23 0.66–2.30 0.515
 High BP 1.76 0.81–3.84 0.153 1.04 0.39–2.77 0.935 1.00 0.36–2.76 0.997
 Impaired FPG 0.78 0.38–1.61 0.507 0.61 0.25–1.51 0.287 0.60 0.25–1.44 0.249

OR, odds ratio; CI, confidence interval; BMI, body mass index; TG, triglycerides; HDL-C, high-density lipoprotein cholesterol; BP, blood pressure; FPG, fasting plasma glucose; WC, waist circumference.

Boldface indicates a statistically significant difference with P<0.05.

a) Obesity (≥95th percentiles, sex- and age-specific), abdominal obesity (WC≥ 90th percentile in those aged 10–15 years, ≥90 cm in males and ≥80 cm in females aged 16–18 years), high TG (≥150 mg/dL), low HDL-C (<40 mg/dL in males aged 10–18 years and females aged 10–15 years, and <50 mg/dL in females aged 16–18 years), high BP (systolic BP≥130 mmHg; diastolic BP≥85 mmHg), and impaired FPG (≥100 mg/dL). WC≥90th percentile for age and sex was estimated using reference data from the 2007 Korean National Growth Charts.

b) Adjusted for age, sex, residential regions, household income, smoking status, drinking status, and sitting time. Only the results of metabolic syndrome are shown.

c) Adjusted for the same set of variables in model 1 plus obesity and all components of metabolic syndrome.

d) Adjusted for the same set of variables in model 1 plus BMI z scores and all metabolic components except abdominal obesity.

References

1. Alshehri AM. Metabolic syndrome and cardiovascular risk. J Family Community Med 2010;17:73–8.
crossref pmid pmc
2. Morrison JA, Friedman LA, Wang P, Glueck CJ. Metabolic syndrome in childhood predicts adult metabolic syndrome and type 2 diabetes mellitus 25 to 30 years later. J Pediatr 2008;152:201–6.
crossref pmid
3. Choi HK, Ford ES. Prevalence of the metabolic syndrome in individuals with hyperuricemia. Am J Med 2007;120:442–7.
crossref pmid
4. Ford ES, Li C, Cook S, Choi HK. Serum concentrations of uric acid and the metabolic syndrome among US children and adolescents. Circulation 2007;115:2526–32.
crossref pmid
5. Clausen JO, Borch-Johnsen K, Ibsen H, Pedersen O. Analysis of the relationship between fasting serum uric acid and the insulin sensitivity index in a population-based sample of 380 young healthy Caucasians. Eur J Endocrinol 1998;138:63–9.
crossref pmid
6. Rho YH, Zhu Y, Choi HK. The epidemiology of uric acid and fructose. Semin Nephrol 2011;31:410–9.
crossref pmid pmc
7. Reis LN, Reuter CP, Pollo Renner JD, Burgos LT, Rech Franke SI, Burgos MS. High urate concentration is associated with elevated blood pressure in schoolchildren. J Pediatr Endocrinol Metab 2018;31:1207–12.
crossref pmid
8. Oyama C, Takahashi T, Oyamada M, Oyamada T, Ohno T, Miyashita M, et al. Serum uric acid as an obesity-related indicator in early adolescence. Tohoku J Exp Med 2006;209:257–62.
crossref pmid
9. Ko YC, Wang TN, Tsai LY, Chang FT, Chang SJ. High prevalence of hyperuricemia in adolescent Taiwan aborigines. J Rheumatol 2002;29:837–42.
pmid
10. Loeffler LF, Navas-Acien A, Brady TM, Miller ER 3rd, Fadrowski JJ. Uric acid level and elevated blood pressure in US adolescents: National Health and Nutrition Examination Survey, 1999-2006. Hypertension 2012;59:811–7.
crossref pmid pmc
11. Tang L, Kubota M, Nagai A, Mamemoto K, Tokuda M. Hyperuricemia in obese children and adolescents: the relationship with metabolic syndrome. Pediatr Rep 2010;2:e12.
crossref pmid pmc
12. Luciano R, Shashaj B, Spreghini M, Del Fattore A, Rustico C, Wietrzykowska Sforza R, et al. Percentiles of serum uric acid and cardiometabolic abnormalities in obese Italian children and adolescents. Ital J Pediatr 2017;43:3
crossref pmid pmc pdf
13. Li N, Zhang S, Li W, Wang L, Liu H, Li W, et al. Prevalence of hyperuricemia and its related risk factors among preschool children from China. Sci Rep 2017;7:9448
crossref pmid pmc pdf
14. Kim JH, Yun S, Hwang SS, Shim JO, Chae HW, Lee YJ, et al. The 2017 Korean National Growth Charts for children and adolescents: development, improvement, and prospects. Korean J Pediatr 2018;61:135–49.
crossref pmid pmc pdf
15. Friedewald WT, Levy RI, Fredrickson DS. Estimation of the concentration of low-density lipoprotein cholesterol in plasma, without use of the preparative ultracentrifuge. Clin Chem 1972;18:499–502.
crossref pmid
16. Michael AP. Reference ranges for laboratory tests and procedures. Kliegman RM, Behrman RA, Jenson HB, Stanton BF, editors. Nelson textbook of pediatrics. 18th ed. Philadelphia (PA): Elsevier Saunders, 2007;:2949

17. Zimmet P, Alberti KG, Kaufman F, Tajima N, Silink M, Arslanian S, et al. The metabolic syndrome in children and adolescents - an IDF consensus report. Pediatr Diabetes 2007;8:299–306.
crossref pmid
18. Moon JS, Lee SY, Nam CM, Choi JM, Choe BK, Seo JW, et al. 2007 Korean National Growth Charts: review of developmental process and an outlook. Korean J Pediatr 2008;51:1–25.
crossref
19. Feig DI, Kang DH, Johnson RJ. Uric acid and cardiovascular risk. N Engl J Med 2008;359:1811–21.
crossref pmid pmc
20. Kim Y, Kang J, Kim GT. Prevalence of hyperuricemia and its associated factors in the general Korean population: an analysis of a population-based nationally representative sample. Clin Rheumatol 2018;37:2529–38.
crossref pmid pdf
21. Shatat IF, Abdallah RT, Sas DJ, Hailpern SM. Serum uric acid in U.S. adolescents: distribution and relationship to demographic characteristics and cardiovascular risk factors. Pediatr Res 2012;72:95–100.
crossref pmid pdf
22. Wilcox WD. Abnormal serum uric acid levels in children. J Pediatr 1996;128:731–41.
crossref pmid
23. Harlan WR, Cornoni-Huntley J, Leaverton PE. Physiologic determinants of serum urate levels in adolescence. Pediatrics 1979;63:569–75.
crossref pmid pdf
24. Nicholls A, Snaith ML, Scott JT. Effect of oestrogen therapy on plasma and urinary levels of uric acid. Br Med J 1973;1:449–51.
crossref pmid pmc
25. Choi TI, Rhee HJ, Ko KM, Yoo SM, Kim KN, Lee SY, et al. The prevalence of obesity and obesity-related metabolic complications in Korean Adolescents. J Korean Acad Fam Med 2006;27:175–81.

26. Lee MS, Wahlqvist ML, Yu HL, Pan WH. Hyperuricemia and metabolic syndrome in Taiwanese children. Asia Pac J Clin Nutr 2007;16 Suppl 2:594–600.
pmid
27. Eckel RH, Grundy SM, Zimmet PZ. The metabolic syndrome. Lancet 2005;365:1415–28.
crossref pmid
28. Steinberger J, Daniels SR, Eckel RH, Hayman L, Lustig RH, McCrindle B, et al. Progress and challenges in metabolic syndrome in children and adolescents: a scientific statement from the American Heart Association Atherosclerosis, Hypertension, and Obesity in the Young Committee of the Council on Cardiovascular Disease in the Young; Council on Cardiovascular Nursing; and Council on Nutrition, Physical Activity, and Metabolism. Circulation 2009;119:628–47.
crossref pmid
29. Quiñones Galvan A, Natali A, Baldi S, Frascerra S, Sanna G, Ciociaro D, et al. Effect of insulin on uric acid excretion in humans. Am J Physiol 1995;268(1 Pt 1): E1–5.
crossref pmid
30. Nakagawa T, Hu H, Zharikov S, Tuttle KR, Short RA, Glushakova O, et al. A causal role for uric acid in fructose-induced metabolic syndrome. Am J Physiol Renal Physiol 2006;290:F625–31.
crossref pmid
31. Wun YT, Chan CS, Lui CS. Hyperuricaemia in Type 2 diabetes mellitus. Diabetes Nutr Metab 1999;12:286–91.
pmid
32. Yoo TW, Sung KC, Shin HS, Kim BJ, Kim BS, Kang JH, et al. Relationship between serum uric acid concentration and insulin resistance and metabolic syndrome. Circ J 2005;69:928–33.
crossref pmid
33. Ryu S, Chang Y, Zhang Y, Kim SG, Cho J, Son HJ, et al. A cohort study of hyperuricemia in middle-aged South Korean men. Am J Epidemiol 2012;175:133–43.
crossref pmid pdf
34. Alper AB Jr, Chen W, Yau L, Srinivasan SR, Berenson GS, Hamm LL. Childhood uric acid predicts adult blood pressure: the Bogalusa Heart Study. Hypertension 2005;45:34–8.
crossref pmid
35. Feig DI, Nakagawa T, Karumanchi SA, Oliver WJ, Kang DH, Finch J, et al. Hypothesis: uric acid, nephron number, and the pathogenesis of essential hypertension. Kidney Int 2004;66:281–7.
crossref pmid
METRICS Graph View
  • 21 Crossref
  • 26 Scopus
  • 10,729 View
  • 329 Download