


Key message
Question: Do eosinophil peroxidase (EPO) values correlate with nasal eosinophil counts?
Finding: EPO values of groups with eosinophil counts above and below reference counts of 2, 5, 10, and 20 were significantly different. Count of 2 was most significant. The EPO cutoff value was 17.57 ng/μg for ROC curves for 2, 5, 10, and 20 eosinophils.
Meaning: EPO and eosinophil counts are strongly correlated. Nasal eosinophils >2 may suggest nasal eosinophilia.
Introduction
Eosinophilia and eosinophil degranulation in target tissues are major pathological mechanisms in allergic diseases such as allergic rhinitis, asthma, and atopic dermatitis [1,2]. Allergic rhinitis is characterized by inflammation associated with eosinophilia in the nasal mucosa and secretions. Hence, measurements of nasal eosinophils have been suggested as a useful diagnostic tool in patients with allergic rhinitis and chronic rhinitis [3-5]. However, the need for more sensitive and reproducible tests for eosinophilic inflammation has been raised since eosinophil counts can vary depending on the experience and skills of the investigator [6,7]. In addition, it was suggested that nasal eosinophilia was not a sensitive or useful diagnostic tool for allergic rhinitis in children demonstrating the limitations of measuring of nasal eosinophil in clinical practice for children [8].
To address these limitations, researchers have tried to identify eosinophilic inflammation by measuring the eosinophil-specific toxic granules released into lesion tissues instead of measuring the eosinophil counts [9,10]. Eosinophils have toxic granules containing major basic proteins 1 and 2, eosinophil peroxidase (EPO), eosinophil derived neurotoxin (EDN), and eosinophil cationic protein (ECP). These granules are released and are deposited in lesion tissues [2]. EDN and ECP are secreted by neutrophils and eosinophils. Whereas, EPO, the most abundant cationic protein in toxic granules, is a toxic protein secreted only by eosinophils and used as an eosinophil specific marker [11]. EPO level was suggested as a relatively accurate marker for eosinophilia and eosinophil activity in the sputum because EPO compared to EDN and ECP has a higher correlation to sputum eosinophilia [6]. Eosinophil count in sputum also showed a close correlation with nasal eosinophil count and nasal EPO level as well as sputum EPO [12-14]. Eosinophil granules, such as EPO, are released in the target tissue by degranulation and cause injury and pathogenic effect [15,16]. Moreover, most patients with allergic rhinitis showed extensive eosinophilic degranulation in the nasal mucosa. Therefore, an important consideration beyond the mere presence of eosinophilia is whether eosinophils degranulate in target tissues. However, appropriate method to measure EPO is limited and relationship of nasal EPO and eosinophilia in children is little known. In addition, the diagnostic cutoff values of EPO level representing eosinophilic inflammation have not been established.
Hence, we measured the eosinophil counts, eosinophil percentage, and EPO in nasal secretions of children and adolescents with rhinitis to determine the association of nasal eosinophil and EPO, and diagnostic cutoff value of EPO representing eosinophilic inflammation in children.
Methods
1. Study subjects
We recruited patients below 18 years of age with rhinitis for more than 2 weeks or recurring more than twice a year whose nasal eosinophil and EPO were measured between January and November 2017 at the Allergy Clinic of a single, tertiary hospital-in Seoul, Korea. Patients had at least one nasal symptom: itching, runny nose, obstruction, sneezing, or other nasal symptoms. Clinical diagnosis was based on the patient’s symptoms, physical examination, specific IgE existance and X-ray of chest or paranasal sinus. Allergic rhinitis was diagnosed when at least one specific IgE-positive for inhalant allergen was detected with rhinitis symptoms lasting more than 2 weeks and physical examination of pale and edematous nasal mucosa. If there were no specific IgE test evaluated, we diagnosed the patients as suspected allergic rhinitis. Acute or chronic sinusitis was diagnosed when sinus pain or tenderness, purulent nasal secretions, congested nasal mucosa, productive cough, and symptoms with associated sinusitis such as persistent headache and positive X-ray finding of paranasal sinus were detected. Acute sinusitis combined with lower respiratory infection such as bronchitis or pneumonia was also included in this case group. Immunosuppressed patients or whose specimens had not been properly tested were excluded.
We excluded 32 patients: 31 whose specimens were refrigerated for a day instead of being frozen immediately, and one who was immunosuppressed. The results of 67 patients who met the inclusion criteria were analyzed.
2. Measurement of nasal eosinophil
The nasal mucosa of the lower turbinate area was rubbed with a cotton swab, and nasal secretions were smeared onto microscope slides and stained with Wright stains. The total cell and eosinophil counts were counted with a light microscope at ×1,000 magnification. The eosinophil percentage was calculated by dividing the eosinophil count by the number of total leukocyte [17]. The nasal eosinophil counts were marked as 0, 0–1, 1–3, 4–9,10–19, 20–29, 30–49, and 50–99. The median value of each range was rounded to attain representative values. Nasal eosinophil counts were classified into 8 groups: 0, 1, 2, 7, 15, 25, 40, and 75.
3. Measurement of EPO
The cotton swab was placed in a 15-mL falcon tube, following which it was smeared on to the slide. One milliliter of normal saline was added to the tube and mixed at the maximum intensity in a vortex mixer. It was then left at room temperature for 30 minutes to 1 hour.
The solution obtained was divided into microtubes and stored at -70℃. Measurements were taken as per the manufacturer's instructions using the Human Eosinophil Peroxidase ELISA Kit (LifeSpan BioSciences, Inc., Seattle, WA, USA). EPO values were divided into proteins quantified by the Bradford method. Only protein-corrected EPO values were used.
4. Protein quantification by the Bradford method
A bovine serum albumin (BSA) solution was prepared to react with the Bradford indicator. For administration into 6 microtubules, 2 mg/mL of the solution was divided such that the tubes received 0, 1, 2, 4, 8, and 16 μL of BSA. Distilled water is added to each microtube such that they reached volumes of 20 mL, each. The absorbance was measured according to the BSA protein concentration using a spectrophotometer. The relationship between protein concentration and absorbance was determined by linear regression analysis. The protein concentration of the secretion was determined by confirming the absorbance of the sample.
5. Statistical analysis
Statistical analysis was performed using IBM SPSS Statistics version 18.0 (IBM Co., Armonk, NY, USA). Continuous variables were evaluated by the Kolmogorov-Smirnov method and are shown as medians (range). The difference in the nasal eosinophil percentage and EPO value according to the nasal eosinophil count was assessed using the Kruskal-Wallis test. The correlation between the nasal eosinophil count, percentage and the EPO was assessed by the Spearman correlation analysis. The association between nasal eosinophil counts and groups of clinical diagnosis was analyzed by the chi-square test. The Mann-Whitney U test was used to compare the group differences for continuous variables. R-statistics was used to estimate the cutoff value of EPO according to the number of nasal eosinophils. P value of <0.05 was considered statistically significant.
This study was approved by the Institutional Review Board (IRB) at Seoul Saint Mary’s Hospital, the Catholic University of Korea (IRB No. KC17RESI0138).
Results
1. Characteristics of the study subjects
The mean age was 8.2±4.0 years. Forty-one subjects were males (61.2%), and 26 were females (38.8%). The median nasal eosinophil count was 1. Eleven (16.4%), 37 (55.2%), 5 (7.5%), 2 (3.0%), 4 (6.0%), 4 (6.0%), 3 (4.5%), and 1 (1.5%) subjects had 0, 1, 2, 7, 15, 25, 40, and 75 nasal eosinophils, respectively. The mean age (±standard deviation) for 67 subjects was 8.2±4.0 years, 41 subjects were male (61.2%), 26 were women (38.8%). The median nasal eosinophil percentage was 1% (0% to 8%). The median protein-corrected EPO value was 12.5 ng/μg (0 to 31 ng/μg; Table 1). There was a statistically significant difference in the eosinophil percentages between the groups based on the eosinophil counts. However, there was no statistically significant difference in the EPO values between the groups. Patients with allergic rhinitis and suspected allergic rhinitis regardless of the accompanying infection, made up two-thirds of the patients. And this group was classified as the allergic rhinitis group (group A) whereas all others were classified as nonallergic rhinitis group (group B) (Table 1).
2. Correlation between nasal eosinophil and other parameters
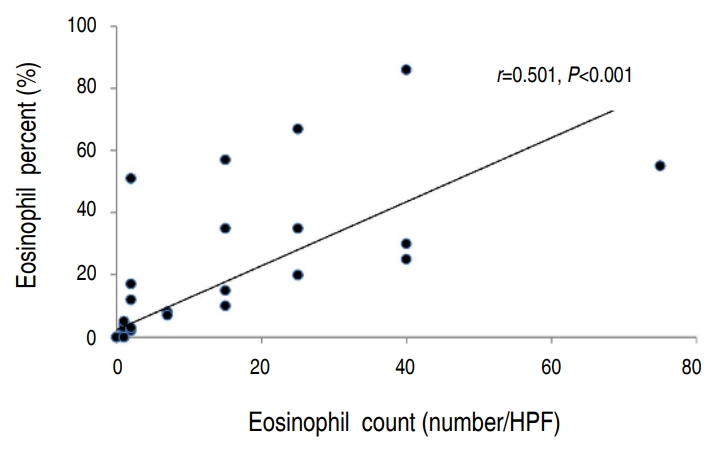
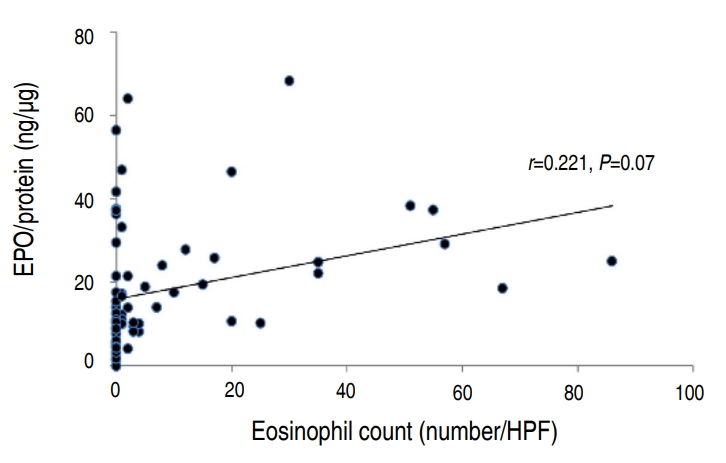
There was a statistically significant correlation between the eosinophil count and percentage (P<0.001) (Fig. 1). However, the eosinophil percentage and EPO did not correlate (Fig. 2). The eosinophil count and EPO had a statistically significant correlation (Fig. 3).
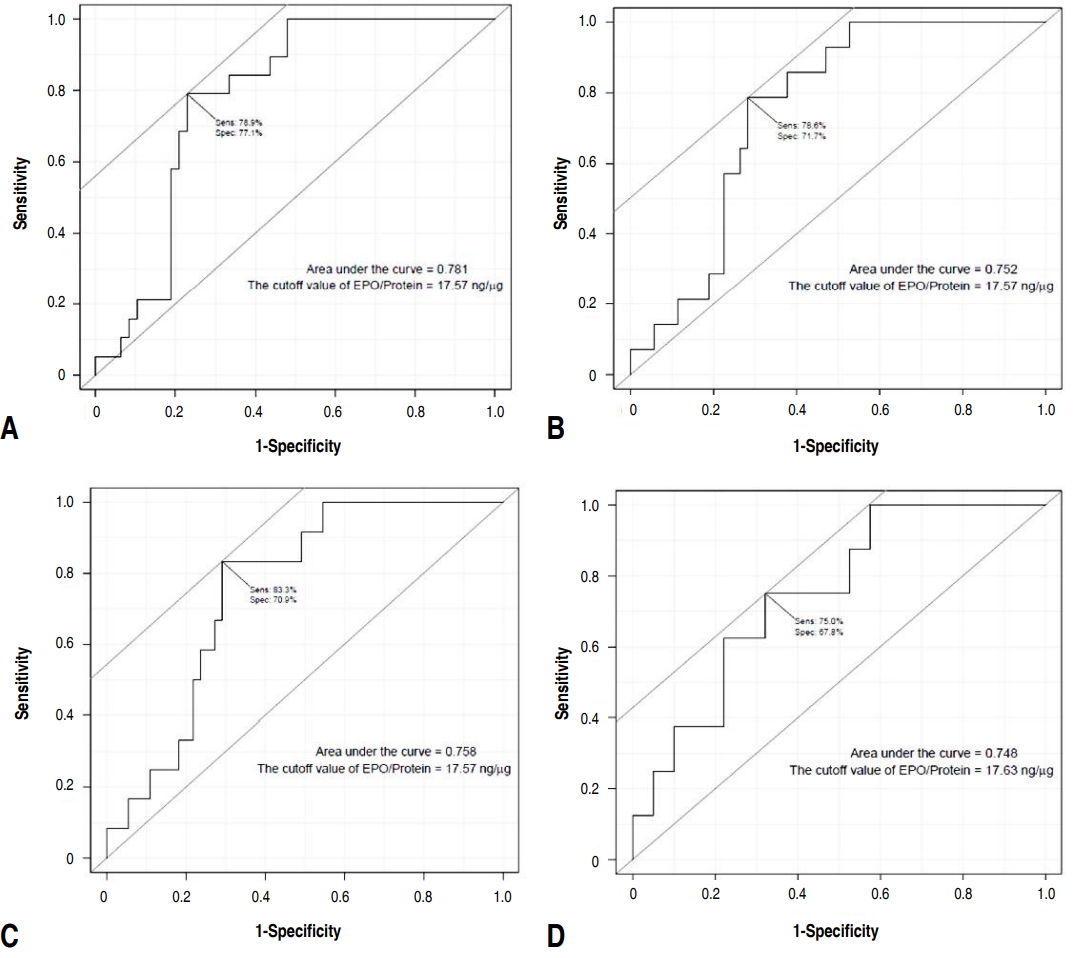
Group A showed a statistically higher eosinophil count (P=0.024) and percent (P=0.011) compared to group B. However, there was no statistically significance of EPO between these groups even though median EPO value was higher in group A. The number of subjects that has a nasal eosinophil counts above 2 and 5 were 19 and 14, respectively. Among them, the number of subjects belonging to group A was 17 (89.5%) and 13 (92.9%), respectively, which was statistically higher than group B (Table 2). The difference in EPO values between the groups above and those below the nasal counts of 2, 5, 10, and 20 were statistically significant (Table 3). The EPO cutoff value examined for nasal eosinophil counts were 2, 5, 10, and 20 was 17.57 ng/μg regardless of the reference count. The largest area under curve value was obtained when the receiver operating characteristic curve was drawn using the eosinophil count of 2 (Fig. 4).
Discussion
Nasal eosinophils reflect allergic inflammation in the nose [4,18-20]. In one study, nasal mucosal biopsy was performed from patients with seasonal allergic rhinitis sensitized to grass pollen before administration, and 1 hour, 24 hours, and 1 week after administration of the allergen. The nasal eosinophil count significantly increased after provocation with the allergen when compared to the count before provocation [18]. The nasal eosinophil percentage in patients with allergic rhinitis was significantly higher than that in healthy controls and patients with other nasal diseases [19]. Our result also showed that nasal eosinophil count and percentage was higher in group A. However, EPO was not significantly higher in group A than group B. This may suggest that even if eosinophils increase in allergic rhinitis, it does not reflect the activation of eosinophilic inflammation. There are insufficient absolute criteria for nasal eosinophilia to predict allergic inflammation. Several studies use different criteria for nasal eosinophilia. Nasal eosinophilia has been defined as eosinophils greater than 5% by Amorim et al. [12], 10% by Mygind [21], Lee et al. [17], and Crobach et al [22], 20% by Lans et al. [5], and 25% by Burrows et al. [23] Meltzer classified nasal eosinophils according to their count at ×1,000 magnification and assigned the following grades: grade 0 for count of 0, grade 0.5+ for count of 0.1 to 1, grade 1+ for counts of 1.1 to 5, grade 2+ for counts of 5.1 to 15, grade 3+ for counts of 15.1 to 20, and grade 4+ for counts more than 20 [24]. Grade 1+ and above were defined as nasal eosinophilia [24]. Our study showed that it would be appropriate to consider the criteria for nasal eosinophilia in children as nasal eosinophil count of more than 2 or 5, because a significant statistical difference was shown between group A and group B, according to below and above nasal eosinophil counts of 2 and 5. In our study, 48 patients (71.6%) had nasal eosinophil counts of less than 1. The maximum percentage of nasal eosinophils was only 8%. These results suggest that it may be reasonable to apply the criteria for nasal allergic inflammation according to the nasal eosinophil count, as in the study of Meltzer [24], rather than previous studies [12,17,21-23] which suggest that percentages of 10%, 20%, or 25% represent nasal eosinophilia. In addition, EPO values had a stronger correlation with nasal eosinophil counts than percentages (Fig. 2), suggesting that the count is more sensitive to allergic inflammation than the percentage. Eosinophilic toxic granules such as ECP or EPO, which indicate eosinophil activation, have been studied [6,7,9,10,15,16]. In one study, the eosinophil count and EPO of the bronchoalveolar lavage solution did not increase in patients with asthma after saline administration, but increased 24 hours after allergen challenges [25]. In patients with seasonal allergic rhinitis, eosinophil counts were significantly increased in the nasal mucosal biopsies, and extracellular EPO and ECP were more frequent after allergen provocation tests than before [15]. This indicates a close correlation between nasal eosinophil counts and eosinophil-specific EPO concentrations, suggesting that EPO can replace nasal eosinophil counts and represent activated states of allergic inflammation well.
The aim of the present study was to evaluate the correlation between nasal eosinophil counts and EPO values in patients with repeated nasal symptoms without defining a limited disease category, such as allergic rhinitis because allergic rhinitis is based on a clinical diagnosis and even in allergic rhinitis, nasal eosinophil counts and EPO may or may not have increased depending on the timing of the tests. We also investigated the cutoff value of nasal EPO for nasal eosinophilia using reference nasal eosinophil counts established as nasal eosinophilia. Since there are not many studies on this subject, especially in pediatric patients, it is meaningful to be able to confirm the expression patterns of eosinophils and EPO in the presence of rhinitis. In addition, we presented the use of EPO as a practical diagnostic test by using an enzyme-linked immunosorbent assay method which makes it easier and less costly to test EPO and compare with the EPO value corrected by proteins in nasal discharge to calibrate the amount of nasal discharge. This method can reduce the possibility of errors that can be associated with measuring EPO higher or lower than the real value by the amount of nasal discharge.
In this study, a significant correlation was found between the nasal eosinophil count and EPO value (Table 2). There were a statistically significant differences in the EPO values between the groups above and below the reference levels when the nasal eosinophil counts were 2, 5, 10, and 20. This suggests that if EPO values reflect allergic inflammation, nasal eosinophils of 2 or more represent nasal eosinophilia.
Different criteria for nasal eosinophilia are suggested in various studies. Hence, the cutoff value of EPO in our study was evaluated without a single reference of nasal eosinophil count corresponding to nasal eosinophilia. The cutoff values of EPO derived were the same for different nasal eosinophil counts. However, there are some limitation. This may have occurred by chance because the number of subjects was small. Moreover, the correlation between the nasal eosinophil counts and EPO values was evaluated without confirming the presence of allergic inflammation of the nose by comparing the EPO values before and after allergen challenge tests. Furthermore, the nasal eosinophil counts and percentages might have been influenced by the technique and experience of the investigator. The reproducibility of the measurements needed to be confirmed by continuously measuring the nasal eosinophil count and EPO values in the same patient. To overcome these limitations, the criteria for nasal eosinophilia should be determined by examining both the nasal eosinophil counts and EPO values before and after sensitized allergen challenge tests in patients with allergic rhinitis and further research is needed. In conclusion, this study showed a close relationship between nasal eosinophil counts and EPO values suggesting that 2 or more nasal eosinophils may represent nasal eosinophilia, and the diagnostic cutoff value of EPO for nasal eosinophilia may be 17.57 ng/μg. This study may be a reference for future studies on EPO as a diagnostic tool for eosinophilic inflammation.

 PDF Links
 PubReader
 ePub Link
 PubMed
 Download Citation


