


Introduction
Respiratory symptoms are a leading reason for pediatric Emergency Department (ED) visits. Pneumonia reportedly accounts for 15.1%-22.7% of the patients who present at the ED with respiratory disease1,2). While the overall prevalence and mortality of this highly infectious disease are decreasing due to socioeconomic development, improved hygiene, and vaccine distribution, mortality remains high in developing nations, particularly among infants and young children, with 2 million deaths annually3). Pneumonia is an inflammatory disease involving terminal bronchioles and lung parenchyma. While infectious agents such as viruses, mycoplasma bacteria, and other microbes are the typical causes of pneumonia, it can also occur due to noninfectious causes such as aspiration of food particles or other foreign bodies, exposure to inhaled allergens, or irradiation. Its etiology varies widely depending on individual sensitivities, epidemiological features of the local community, and seasonal factors3). For the most part, physicians rely on an empirical diagnosis and therapy due to the difficulty in obtaining samples for laboratory diagnosis. Epidemiological data on the clinical features and etiologies of pediatric pneumonia are essential for improving diagnostic and therapeutic efficacy4). In this study, we identified symptomatic patterns and incidences of pneumonia by analyzing clinical findings based on 2012 ED data of children and adolescents (Ōēż18 years of age) diagnosed with pneumonia among all children and adolescents presenting at EDs in South Korea.
Materials and methods
The study subjects included children and adolescents (Ōēż18 years of age) diagnosed with pneumonia among all children and adolescents brought to 146 EDs nationwide across South Korea from January to December 2012. National ED data were provided by the National Emergency Department Information System (NEDIS) of the National Medical Center.
Data from 146 EDs (21 regional emergency medical centers, 2 specialized emergency medical centers, 113 local emergency medical centers, and 10 local emergency medical institutes) were collected from the NEDIS in 20125). By analyzing diagnosis codes corresponding to pneumonia, when they visited the ED or were hospitalized as a result of the ED visit. We extracted pertinent data such as the number of patients by gender, age, month of visit, comorbidities, pathogen and etiology, as well as hospitalization rates after presenting at the ED. Korea Standard Classification of Diseases codes were used to identify pneumonia cases (Table 1). Statistical data analysis was performed using SAS 9.4 (SAS Institute Inc., Cary, NC, USA). Frequencies and percentages were used to compare general characteristics such as gender and month of visit, while differences in frequency were assessed using the chi-square test. Odds ratios (ORs) and 95% confidence intervals (CIs) obtained from logistic regression analyses were used to identify associations between month of ED visit and hospitalization, using hospitalization and month of ED visit as dependent and independent variables, respectively. P<0.05 was considered statistically significant.
Results
1. Study population
Among 1,503,239 pediatric patients presenting at EDs across the nation during the study period, 38,415 (2.6%) were diagnosed with pneumonia (male, 20,990; female, 17,425; male-to-female ratio=1:0.8). Their mean age was 2.9 years; 6,916 (18.0%) were younger than 1 year of age, 20,914 (54.4%) were 1ŌĆō3 years of age, 6,450 (16.8%) were 4ŌĆō6 years of , 2,841 (7.4%) were aged 7ŌĆō12 years, and 1,294 (3.4%) were aged 13ŌĆō18 years. The 1ŌĆō3 and 13ŌĆō18 year groups had the highest and lowest percentages of patients, proportionally (P<0.0001). Among infant ER visits (<1 year, n=6,916), 519 were <1 month of age, 3,150 were aged 1ŌĆō6 months, and 3,247 were aged 7ŌĆō12 months (Table 2).
2. Main symptoms and diagnostic outcomes
The most frequent symptom at the time of ED admission was fever (61.5%), followed by cough (17.2%), dyspnea (2.1%), seizures (1.7%), and abdominal pain (1.3%). Fever and cough were most frequent in all age groups, seizures among those 4-6 (2.8%) and 1ŌĆō3 (2.1%) years of age, abdominal pain among those 7ŌĆō12 years of age (3.3%), and dyspnea tended to increase with age (P<0.0001) (Fig. 1).
The overall rate of post-ED hospitalization of pediatric patients with pneumonia was 43.5%. The percentages by age group were 61.8% (<1 year), 41.5% (1ŌĆō3 years), 32.4% (4ŌĆō6 years), 37.0% (7ŌĆō12 years), and 47.6% (13ŌĆō18 years). The overall average duration of hospitalization was 6.7 days (interquartile range, 4ŌĆō7 days), and 6.3 days after excluding patients admitted to intensive care units (ICUs) (interquartile range, 4ŌĆō7 days). Seven patients died of pneumonia after ED admission. Deaths were 1 (<1 year), 1 (1ŌĆō3 years), 2 (4ŌĆō6 years), 2 (7ŌĆō12 years), and 1 (13ŌĆō18 years); based on etiology, 4 deaths were due to aspiration pneumonia and 3 were due to pneumonia of unknown origin (Table 3).
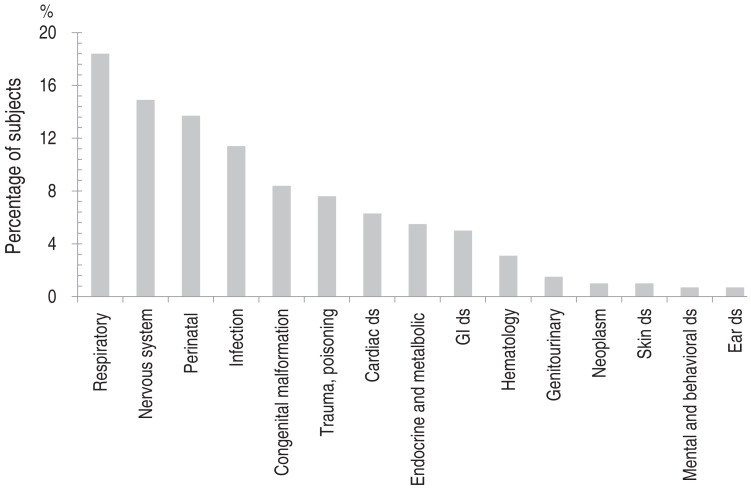
Among hospitalized children, 437 (2.6%) were admitted to the ICU. ICU admission rates were highest in the youngest and oldest age groups (<1 and 13ŌĆō18 years) (Table 3). The most common comorbidities suffered by ICU patients were respiratory conditions (n=111; 18.4%), including asthma and bronchiolitis, followed by neurological disorders including epilepsy (n=90; 14.9%), perinatal diseases (n=83; 13.7%), and infectious diseases such as sepsis (n=69; 11.4%) (Fig. 2).
3. Classification of pneumonia by etiology
The major types of pneumonia diagnosed in this study (n=38,415) were viral pneumonia (n=11,146; 29.0%), bacterial pneumonia (n=2,039; 5.3%), mycoplasmal pneumonia (n=1,732; 4.5%), aspiration pneumonia (n=490; 1.3%), and tuberculosis (n=173; 0.5%). The remaining cases (59.3%) were pneumonia of undetermined origin (Table 4). By subtype, viral pneumonia included influenza pneumonia (n=8,819; 77.3%), respiratory syncytial virus pneumonia (n=865; 7.6%), parainfluenza virus pneumonia (n=235; 2.1%), adenovirus pneumonia (n=70; 0.6%), and human metapneumovirus pneumonia (n=69; 0.6%).
4. Monthly distribution of visits
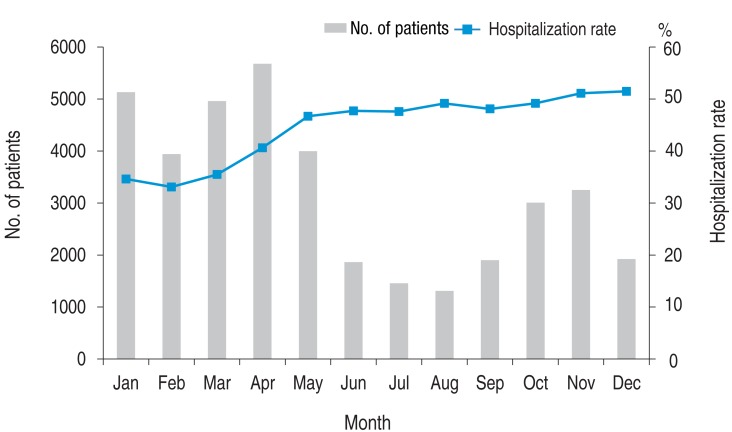
There was an average of 3,200 monthly ED visits, with the highest number (n=5,677; 14.8%) in April, followed by January (n=5,132; 13.4%), March (n=4,960; 12.9%), May (n=3,996; 10.4%), and February (n=3,941; 10.3%), with the summer months (June through August) showing the lowest number of ED visits. The average monthly rate of post-ED hospitalization was 44.6%, with the highest rates in December (51.5%), November (51.1%), and October (49.2%). Although January through April had high numbers of ED visits, they had relatively low rates of hospitalization (33.1%ŌĆō40.6%) (Fig. 3). These month-dependent differences between the number of ED visits and hospitalization rates were statistically significant (P<0.0001).
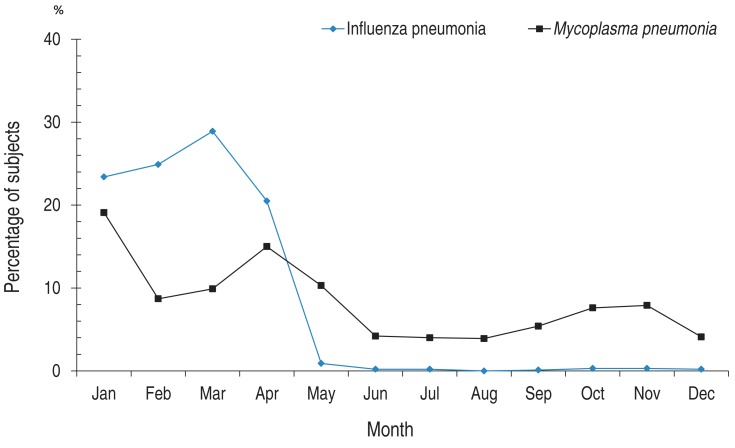
Analysis of the monthly distribution of ED visits of patients diagnosed with influenza pneumonia revealed the highest number of visits in March (n=2547; 28.9%), followed by February (n=2,200; 24.9%) and January (n=2,061; 23.4%). The peak months for mycoplasmal pneumonia visits were January (n=331; 19.1%), April (n=259; 15.0%), and May (n=178; 10.3%) (Fig. 4).
Discussion
The annual pneumonia incidence in the United States is an estimated 15.7 cases per 10,000 children, and 62.2 per 10,000 children under 2 years of age6). In South Korea, a recent study published by the Health Insurance Review & Assessment states, according to the 5-year (2009ŌĆō2013) data collected, 44.9% of all the pneumonia patients were children (<10 years)7). A study of pediatric ED visits conducted in a tertiary general hospital in South Korea reported that respiratory diseases accounted for 22.8% of cases, second only to injury and poisoning (30.4%); pneumonia comprised 15.1% of respiratory disease cases2).
In this study, the overall gender ratio was 1:0.8, with boys slightly outnumbering girls. Boys were also found to slightly outnumber girls in other studies, such as 1:0.8 in a study of patients hospitalized with pneumonia by Jain et al.6) and 1:0.9 in a study of pneumonia patients visiting the ER by Neuman et al.8,9). In interpreting these apparent gender-dependent incidences of pneumonia, the gender ratio in the entire youth population (Ōēż18 years) must be considered, which is 1:0.9 according to 2012 Statistics Korea10).
Although this study is limited to 2012 data, children 1ŌĆō3 years of age accounted for 34,281 of pediatric ED presentations (54.4%), while including children up to 6 years of age accounted for 38,415 additional cases (90% aggregate). A domestic study of children with pneumonia visiting the ER by Hong et al.11) reported the highest proportion of admissions (40.1%) among children 2ŌĆō5 years of age; Jain et al.6) and Neuman et al.9) reported the highest proportion in infants younger than 2 years (45%ŌĆō46%). In other studies, children younger than 5 years accounted for 60%ŌĆō75% of pediatric admissions6,8,9,12).
Among all symptoms, Lee et al.2) reported fever to be the most common reason for pediatric (Ōēż18 years) ED visits in South Korea (25.3%), irrespective of disease. A study on ED-admitted pediatric pneumonia patients also identified fever (92.8%) as the most frequent symptom11). Similarly, fever was also the most common symptom in the current study (61.5%), followed by cough (17.2%), and dyspnea (2.1%). Cough (95%), fever (91%), and anorexia (75%) were the most common symptoms in the study by Jain et al.6). At the time of ED admission, seizures occurred more frequently in the 1- to 6-year age group than the other age groups; the proportion of patients reporting dyspnea and abdominal pain as major symptoms increased with age. Febrile seizures were diagnosed in 3.6% of those 1ŌĆō6 years of age, compared to 2.7% for the entire group.
The rate of hospitalization of pneumonia patients admitted to the ED ranges from 20%ŌĆō25.8% in other nations, but was 81.3% in a study conducted at a tertiary general hospital in South Korea 8,9,11,13). In the present study, 16,284 of 38,415 (42.4%) of pediatric patients were hospitalized, although the rate varied by age group. The especially high rate of hospitalization in the South Korean study may be explained by the fact that it was conducted in a tertiary general hospital, and may also reflect the fact that hospitalization criteria differ between healthcare institutions11). In addition, different insurance criteria in individual counties can also influence hospitalization rates. The length of hospital stay ranged from 2 to 5 days in the United States (US), less than the average stays observed in the current study 7 days6,12,14,15). One US study attributed these variations to health insurance status, with public health insurance cases tending to have increased hospital stays compared to those with private health insurance or those without health insurance15). In the previous study, hospital accessibility was also identified as a factor contributing to longer hospital stays (urban vs. suburban)15). Based on this observation, the higher rate of health insurance subscription in South Korea and adequate hospital accessibility may have been positive factors. The rate of ICU cases among hospitalized patients differed significantly, with 0.7%ŌĆō21% reported in nations such as the US, compared to 2.6% in our study6,14). The rate of ICU admission in our study varied greatly with age groups, with those <1 and 13ŌĆō18 years of age showing particularly high admission rates. Infants<1 year of age also had high rates of ED visits and post-ED hospitalization, presumably due to factors related to their age.
The morbidity in our study was 0.02% (n=7), similar to a US report, which studied outpatients and ED patients with pneumonia, and lower than a Brazilian report, which studied ED patients with pneumonia13,14). Aspiration pneumonia was most common among these fatal cases (n=4); the remaining cases were of undetermined origin.
Pneumonia of undetermined origin was the most frequent diagnosis (59.3%) among pediatric pneumonia cases. This lack of diagnosis is assumed to arise from the typical ED setting of limited time and space and inherent difficulties related to accurate diagnosis of pneumonia. Viral pneumonia was more prevalent than bacterial pneumonia overall (11,146 of 38,415 [29.0%] vs. 2,039 of 38,415 [5.3%]). This reflects the high proportion (60%) of viral causes of acute lower respiratory tract infections, including pneumonia, and the easier identification of viral infections compared to bacterial infections16). Moreover, many children who are administered antibiotics due to suspected bacterial pneumonia are often given diagnosis codes for pneumonia of unclear origin. Decreased bacterial infections due to increased vaccine rates and improved hygiene may also have contributed to the relatively low rate of bacterial pneumonia17).
Although respiratory virus detection rates show regional and seasonal variations in South Korea, many South Korean studies on pediatric patients hospitalized for lower respiratory tract infections most often reported respiratory syncytial virus (35.5%-56.3%), which accounted for 24%-54% of pediatric patients diagnosed with pneumonia16,18). The viral pneumonia cases reported in our study included influenza pneumonia (77.2%), respiratory syncytial virus pneumonia (7.6%), and parainfluenza viral pneumonia (2.1%). The prevalence of influenza pneumonia may be ascribed to the availability of simple-to-perform influenza virus assay kits that yield results within 20-30 minutes, a test easy to conduct even in ED settings.
Mycoplasmal pneumonia is a major cause of community-acquired pneumonia in schoolchildren and adolescents. In South Korea, it has had an outbreak cycle of 3-4 years since the 1980s; and, the age of onset has gradually decreased19). In particular, small children(<5 years of age) are more often affected during outbreak periods than during nonoutbreak periods20). Kim et al.21) analyzed South Korean studies, and reported that cases among small children tended to increase after 1998, particularly among those <3 years of age, from 23.4% to 28.3%. In the current study, despite its limitation as a one-year study and excluding outpatients, the proportion of small children <3 years of age among the total number of children with mycoplasmal pneumonia was relatively high (1,000 of 1,732; 57.7%). In addition, a domestic study conducted by a single medical institution evaluating the mycoplasma IgM antibody positivity rate among pediatric patients <10 years of age from October 2011 to March 2013 reported a higher rate from January to April 2012, suggesting that this period was an outbreak22). Our study also observed higher rates of ED visits between January and May, compared to other months.
Aspiration pneumonia is typically caused by repeated aspiration of small volumes of stomach, nasal, and oral cavity contents into the airway. It occurs more frequently in newborns and infants as well as in patients with neurological disorders such as cerebral palsy because of their physiological tendency for gastroesophageal reflux or dysphagia23,24). In the present study, newborns and infants <1 year of age accounted for the highest proportion (47.3%; 232 of 490) of pediatric patients diagnosed with aspiration pneumonia (data not shown). Neurological disorders were the most frequent comorbidities among the remaining patients with aspiration pneumonia (28.9%) (data not shown).
Tuberculosis accounted for 173 of the investigated pneumonia cases (0.5%). Adolescents 13-18 years of age had the highest tuberculosis rate (n=138; 79.8%). Despite a steadily decreasing tendency in tuberculosis prevalence and mortality in South Korea, surveys since 2000 show a constant rate until 2008, followed by an increasing trend25). Adolescents 15-18 years of age were especially affected in the 2012 survey of new tuberculosis cases (n=1,630; 84.5%)26). A study conducted on children and adolescents (Ōēż15 years) hospitalized in a South Korean university hospital between 1998 and 2007 revealed an increase in the median age of pediatric patients from 5 years (1988-2002) to 12 years (2003-2007) amidst the steadily decreasing occurrence and prevalence rates, a finding consistent with our study results27).
Although this study is limited to 2012 data, the proportion of pediatric patients brought to the ED for pneumonia was highest in April (14.8%), followed by January (n=5,132; 13.4%) and March (n=4,960; 12.9%); the summer months had the lowest number of ED visits. A South Korean study conducted by Hong et al.11) reported a similar trend, with December showing the highest proportion (14.8%) of visits, followed by October (13.5%) and April (12.5%), and summer months showing lower proportions, which is largely consistent with the pattern exhibited in our study. In particular, a study of hospitalized patients by Jain et al.6) showed the highest detection rate for respiratory syncytial virus primarily during fall and winter months. In contrast, influenza pneumonia occurred most frequently in our study. According to the 2012 data on respiratory virus infection patterns from the Korea Centers for Disease Control and Prevention28), the influenza outbreak occurred from January to April, while the parainfluenza outbreak occurred from May to September, and the respiratory syncytial virus outbreak occurred from October to December. Although the number of ED visits for pneumonia was highest during the influenza outbreak period (January through April), the hospitalization rate was highest between May and December consistent with the outbreak of parainfluenza and respiratory syncytial virus28). Jain et al.6) also reported increased number of patients in the fall and winter months. These observations suggest there are many causes of pneumonia which affects the severity of the disease as well as the hospitalization rate of pneumonia patients. Thus, depending on the outbreak of a respiratory virus during a particular time of the year may affect the rate of outpatients and inpatients.
The limitations of this study include its short duration (one year; 2012); its sample population of pediatric patients presenting at EDs across the nation not necessarily reflect outpatients or hospitalized patients who did not seek treatment from ERs; and its analysis of ED data from the NEDIS lacked detailed information on diagnosis and treatment. By analyzing diagnosis codes corresponding to pneumonia, when they visited the ED or were hospitalized as a result of the ED visit. There is a difference in the time of diagnosis. Diagnoses in most domestic EDs have limited credibility because diagnosis and treatment are performed by either medical interns or resident doctors.
Despite these limitations, this study is significant in that it is based on a large-scale dataset of 38,415 pediatric patients with pneumonia presenting at 146 EDs across the nation, including university and general hospitals; thus, reflecting pneumonia outbreak patterns nationwide. Our results are therefore expected to serve as basic data for future studies on children and adolescents seeking ED treatment for pneumonia.

 PDF Links
 PubReader
 ePub Link
 PubMed
 Download Citation


