


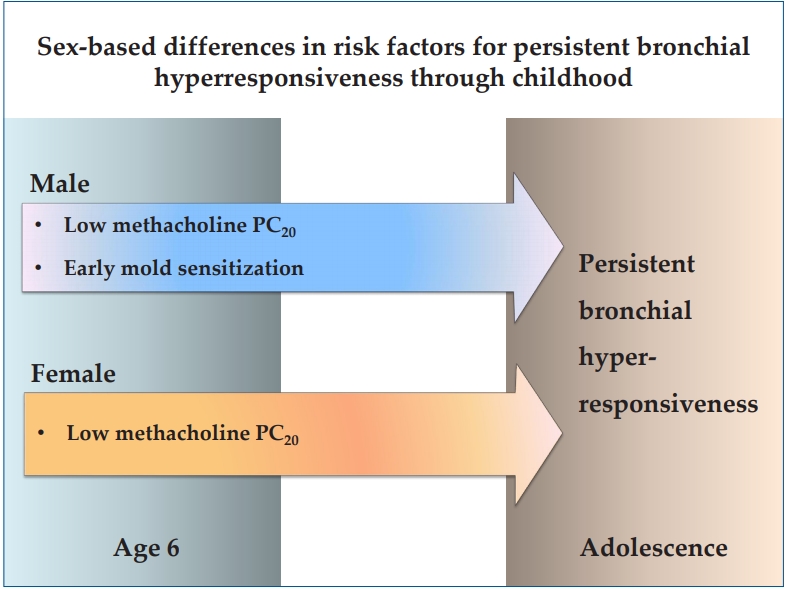
Graphical abstract. PC20, provocative concentration of methacholine causing a 20% fall in forced expiratory volume in 1 second.
Introduction
Bronchial hyperresponsiveness (BHR) is characterized by excessive airway narrowing in response to provoking stimuli, which is the most important pathophysiologic feature of asthma [1]. Assessment of BHR is a main diagnostic criterion of asthma, and it can be an indicator related to the severity and prognosis of asthma [2,3].
Adolescence is a time of remission in many children with asthma. However, previous longitudinal studies have reported that symptom remission does not reflect remission of underlying airway pathology and asymptomatic patients still have abnormal lung function and/or persisting BHR [4-6]. Asthma cohort studies reported that BHR that was already present in preschool age was a predictor of newly diagnosed asthma in early adulthood [7], and that asthma relapse in adulthood was associated with asymptomatic BHR in adolescence [8]. Adolescence is a critical link between childhood and adulthood when childhood asthma may change significantly, but published literature examining the transition process in the adolescents with childhood asthma is not much yet [9,10].
Methacholine challenge test (MCT) is the most frequently used method to asses BHR. According to American Thoracic Society (ATS) guideline, BHR to diagnose pediatric asthma is considered as the level of methacholine for the forced expiratory volume in 1 second (FEV1) to drop 20% from baseline (provocative concentration of methacholine causing a 20% fall in FEV1, PC20) to be less than or equal to 16 mg/mL [11]. BHR is known to decrease with age through childhood [12,13], and a previous Korean study has suggested that the application of different cutoff values of methacholine PC20 depending on age might be practical for the diagnosis of asthma in adolescence [14]. In a recent report from the Childhood Asthma Management Program (CAMP), absence of BHR in adolescence was defined at a methacholine PC20 of 25 mg/mL or greater [15].
In the present study, we performed MCTs in the adolescents who had childhood asthma and examined the factors associated with BHR and investigated if there were sex-specific differences. In the subjects whose baseline data at age 6 including the results of the initial MCTs were available, we examined longitudinal change of BHR through childhood and also analyzed sex-specific differences in the factors associated with the persistent BHR into adolescence. Our study aimed to investigate the factors that might be involved in asthma transition from childhood into adolescence and adulthood.
Methods
1. Subjects
In the present study, 215 adolescents (age of 13 years or more) who were previously diagnosed and treated with asthma during childhood were enrolled. They performed MCTs during the period between January 2017 and December 2019 at Daegu Catholic University Hospital. They had been diagnosed as having childhood asthma by their physicians; they had recurrent wheezing which persisted after 3 years of age and showed BHR upon direct or indirect bronchial challenge tests carried out during childhood. Asthma severity of the patients was assessed according to Global Initiative for Asthma criteria as suggested in a recent study [16] and graded from 1 to 4 in this study; 1; mild-intermittent, 2; mild-persistent, 3; moderate-persistent, 4; severe-persistent.
The subjects were divided into 2 groups based on the presence of BHR defined according to CAMP criteria [15]: BHR group (<25 mg/mL of methacholine PC20, n=113) and non-BHR group (≥25 mg/mL of methacholine PC20, n=102). We also divided each sex group, 149 males and 66 females, by the presence of BHR. Patients with congenital heart disease, chronic respiratory disease other than asthma, or any underlying disease were excluded.
In the present study, 108 subjects performed the first bronchial challenge tests at age 6 with methacholine and were diagnosed as having BHR (defined as PC20≤16 mg/mL). Among those subjects, 40 showed persistent BHR into adolescence and 68 showed no more BHR. We divided the subjects by the persistence of BHR within each sex group, 71 males and 37 females, and analyzed the relationship between the baseline data at age 6 and persistent BHR through childhood.
Flow chart of the study is presented in Fig. 1. Informed consents were obtained from all patients and their parents, and this study was approved by the Daegu Catholic University Medical Center Institutional Review Board (CR-20-078).
2. Clinical characteristics of the subjects
Medical records of the subjects were reviewed retrospectively. Clinical characteristics such as age at the 1st wheeze started, hospitalization related to lower respiratory tract infection before age 3, combined other allergic diseases, family history of allergy, atopic sensitization, sensitized allergens, and body mass index were examined.
Current asthma was defined as having episodes of wheeze verified by pediatric specialists or asthma exacerbation in the previous year at the time of MCT.
3. Pulmonary function test and MCT
Pulmonary function tests were performed using SU 6000 SuperSpiro Spirometer (Micro Medical Ltd., Chatham, UK). FEV1, forced vital capacity (FVC), and FEV1/FVC ratio were measured. In this study, reduced FEV1/FVC was defined at a ratio of <90%, and well-preserved FEV1/FVC was defined at ≥90% as suggested in the previous study from CAMP cohort [15].
MCTs were conducted according to ATS guidelines using KoKo-MSM dosimeter (nSpire Health Inc., Louisville, CO, USA). Provocholine (Methacholine chloride USP, Methapharm Inc., Brantford, ON, Canada) solutions were prepared in buffered normal saline at concentrations of 0.0625, 0.25, 1, 4, 16, 25 mg/mL, and the subjects inhaled the methacholine solution with stepwise increasing concentration at 5-minute interval. The degree of BHR was categorized into 3 levels based on ATS criteria (moderate-to-severe <1 mg/mL, mild 1-4 mg/mL, borderline>4 mg/mL) [11]. MCTs were performed when the subjects were free from acute respiratory infection and had no asthma symptoms within the previous 4 weeks. The patients were instructed to withhold asthma medications, long-acting β2 agonists, inhaled corticosteroids, and leukotriene antagonists for at least 72 hours prior to testing.
4. Investigation of atopic sensitization
Atopic sensitization was assessed by skin prick test or serum allergen-specific IgE test. The skin prick test was performed on 53 common allergens using commercially available reagents (Lofarma SpA, Milan, Italy), and allergen-specific IgE was meaured for house dust mite (HDM) (Dermatophagoides farinae, Dermatophagoides pteronyssinus), tree pollen mixture, grass pollen mixture, weed pollen mixture, mold mixture, cat, dog, and food allergens (egg, milk, soybean, peanut) using ImmunoCAP (Pharmacia Diagnostics, Uppsala, Sweden). Atopic sensitization was defined when the patients had at least one positive reaction to skin prick test or an allergen-specific IgE >0.35 kU/L.
5. Statistical analysis
For statistical analysis, IBM SPSS Statistics ver. 25.0 (IBM Co., Armonk, NY, USA) was used. The chi-square test or Fisher exact test was used to compare categorical variables between the 2 groups. When comparing continuous variables with normal distribution between the 2 groups, Student t test was used and the data were expressed as mean and standard deviation. Mann-Whitney U test was used for nonnormally distributed data, which were expressed as median and interquartile range. Multivariate logistic regression analysis was performed to obtain the adjusted odds ratio (aOR) for factors associated with presence or persistence of BHR. The confidence interval (CI) was set to 95% and P value less than 0.05 was considered statistically significant.
Results
1. The factors associated with BHR in the adolescents who had childhood asthma
Table 1 presents the clinical characteristics of 2 adolescent groups defined by the presence of BHR on univariate analyses. There were no differences between the 2 groups in mean age, sex distribution, age at the 1st wheeze started, and hospitalization for lower respiratory tract infection before age 3.
The prevalence of combined allergic rhinitis was high in both groups. The prevalence of atopic dermatitis was higher in BHR group, which did not reach statistical significance (P=0.092). Although the rate of atopic sensitization was high in both patient groups, pet sensitization rate was significantly higher (P=0.009), and HDM and mold sensitization rate tended to be higher (P=0.054, P=0.050, respectively) in BHR group compared with non-BHR group. Total serum IgE level was not different between the 2 groups, but peripheral blood eosinophil count was significantly higher in BHR group (P=0.007). Asthma severity was significantly higher in BHR group than in non-BHR group (P=0.001).
Current asthma was more common in BHR group (P=0.000), but 38 subjects (34%) in BHR group had no current asthma. Current asthma in BHR group was significantly related with the severity of BHR. The subjects with PC20 less than 1 or 1–4 mg/mL (moderate-to-severe or mild BHR) presented current asthma more commonly compared to those with PC20 greater than 4 mg/mL (borderline BHR) (P=0.001).
Pulmonary function test results showed significantly lower FEV1%predicted and FEV1/FVC ratio in BHR group than in non-BHR group (P=0.013, P=0.042, respectively). The subjects with reduced FEV1/FVC ratio (<90%) were more frequently observed in BHR group, and those with well-preserved FEV1/FVC ratio (defined as ≥90% in the previous study from CAMP cohort [15] ) were more common in non-BHR group (P=0.002).
In the multivariate analyses, sensitization to mold allergens remained to be independently associated with the presence of BHR (aOR, 4.038; 95% CI, 1.572–10.373; P=0.004). The risk of BHR increased by 1.001 times with each 1 increase of peripheral blood eosinophil count (95% CI, 1.000–1.001; P=0.018). Reduced FEV1/FVC ratio (<90%) (aOR, 3.106; 95% CI, 1.000-1.174-8.219; P=0.022) and current asthma (aOR, 2.496; 95% CI, 1.118–5.568; P=0.026) were independently associated with BHR (Table 2).
2. Sex-specific differences in the factors associated with BHR
Univariate analyses of the factors associated with BHR in each sex group are presented in Table 3.
Atopic dermatitis showed a tendency to be related with the presence of BHR in the male subjects (P=0.082), but not in female subjects. In the male subjects, atopic sensitization rate showed a tendency to be higher (P=0.091), and sensitizations to mold and pet allergens were significantly higher in BHR group than in non-BHR group (P=0.047, P=0.041, respectively). However, in the female subjects, no relationship was observed between those atopic factors and the presence of BHR.
The median values of methacholine PC20 in BHR groups showed no difference between the male and female subjects (male: 5.6; interquartile range [IQR], 1.3–16 mg/mL vs. female: 5.0; IQR, 2.3–16 mg/mL; P=0.72). In the male subjects, values of FEV1%predicted and FEV1/FVC ratio were not related with the presence of BHR. However, in the female subjects, FEV1% predicted and FEV1/FVC ratio were significantly lower in BHR group than in non-BHR group. (P=0.024, P=0.041, respectively). The subjects with reduced FEV1/FVC ratio (<90%) were also more frequently observed in the female subjects with BHR than in those without (P=0.005).
In multivariate analyses, in the male subjects, the odds of BHR decreased by 32% with each 1-year increase in age (aOR, 0.683; 95% CI, 0.510–0.914; P=0.010), mold sensitization was independently associated with the presence of BHR (aOR, 5.569; 95% CI, 1.702–18.221; P=0.005), and the odds of BHR increased by 1.002 times with each 1 increase of peripheral blood eosinophil count (95% CI, 1.000–1.003; P=0.026). In the female subjects, only reduced FEV1/FVC ratio (<90%) was independently associated with the presence of BHR (aOR, 7.5; 95% CI, 1.715–32.796; P=0.007) (Table 4).
3. Longitudinal change of BHR and sex-specific differences in the risk factors for persistent BHR through childhood into adolescence
Among 108 subjects whose baseline data at age 6 including the results of the initial MCTs were available, 40 (37%, 25 males and 15 females) showed persistent BHR in adolescence. Table 5 shows the baseline data at age 6 in 2 sex groups classified by the persistence of BHR into adolescence.
BHR decreased through childhood in both male and female adolescents. In male group, median value of methacholine PC20 increased from 2.3 mg/mL at age 6 to 15.2 mg/mL in adolescence, and in female group, from 2.6 mg/mL to 14.7 mg/mL. Follow-up level of methacholine PC20 in the adolescents with persistent BHR showed no difference between the 2 sex groups (male: 15.2; IQR, 3.7–19.2 mg/mL vs. female: 14.7; IQR, 4.1–20.3 mg/mL; P=0.826).
In both sex groups, baseline methacholine PC20 values at age 6 were significantly lower in the subjects with persistent BHR compared with those with no more BHR: (persistent BHR: 2.3; IQR, 1.2–6.5 mg/mL vs. no more BHR: 10.5; IQR, 6.3–13.8 mg/mL; P=0.000) in males and (persistent BHR: 2.6; IQR, 1.8–5.8 mg/mL vs. no more BHR: 9.8; IQR, 6.4–14.3 mg/mL; P=0.007) in females. In both sex groups, the subjects with low baseline methacholine PC20 (≤4 mg/mL) were more frequently observed in the adolescents with persistent BHR.
In both sex groups, the baseline factors at age 6, such as, atopic sensitization, combined allergic diseases, total serum IgE levels, and blood eosinophil count were not associated with the persistent BHR in adolescence. However, in males, early sensitization to mold allergens at age 6 was significantly higher in the subjects with persistent BHR than in those with no more BHR (P=0.013). In females, mean value of FEV1 %predected was significantly lower in the subjects with persistent BHR compared with those with no more BHR (P=0.015).
In multivariate analyses, sensitization to mold allergens at age 6 remained to be independently associated with the persistence of BHR in male adolescents (aOR, 7.718; 95% CI, 1.243–41.440; P=0.028). Low baseline methacholine PC20 at age 6 was significantly associated with the persistence of BHR in both sex groups. The odds of persistent BHR in adolescence decreased by 19.5% with each 1 increase of methacholine PC20 at age 6 in males (aOR, 0.805; 95% CI, 0.715–0.905; P=0.000) and by 29% in females (aOR, 0.710; 95% CI, 0.541–0.932; P=0.014) (Table 6)
Discussion
Our study showed sex-specific differences in the factors associated with BHR in adolescence and also in the risk factors for persistent BHR through childhood. Mold sensitization and increased blood eosinophil count were independently associated with BHR only in the male adolescents, but reduced FEV1/FVC ratio was associated with BHR only in the female adolescents. Early mold sensitization at age 6 was an independent risk factor for persistent BHR only in the male subjects.
More than 90% of the adolescents enrolled in our study had atopic sensitization. This finding is consistent with the results of previous epidemiologic studies that showed sensitization to allergens during early childhood is the most important determinant of persistent asthma by school-age and adolescence [6-10]. In the present study, sensitization to HDM, pet, and mold allergens was more prevalent in the subjects with BHR than in those without, but there was no difference in pollen allergy between the 2 groups. Similar to our study, some previous studies have shown that perennial indoor allergens are more influential allergens associated with BHR than seasonal allergens [17-20]. Moreover, in our study, multivariate analyses showed that mold sensitization was independently associated with BHR in adolescence with more than 4 times odds. A previous study showed a significant relation between mold sensitization and BHR in Korean children with asthma [21]. The prevalence of mold sensitization in those school-age children was 12.2%, which was comparable to 25% in our adolescents with childhood asthma. There was another Korean study that showed a significant association between sensitization to Alternaria and BHR in adult patients [20]. Together with the 2 previous Korean studies, our findings suggest that mold sensitization might be a risk factor in transition of childhood asthma into adolescence and adulthood.
In the present study, increased blood eosinophil count was independently associated with BHR in adolescence. The previous studies have reported the relationship between elevated blood eosinophil count and BHR [22-25], and one of them showed that blood eosinophil count was significantly higher in asymptomatic adolescents with BHR than in those without [25]. Our study showed that the adolescents with BHR had more severe airflow limitation compared with those without, and in multivariate analyses, reduced FEV1/FVC ratio (<90%) was independently associated with BHR. A recent report from CAMP study showed that the severity of airflow obstruction in asthmatic children, presented as FEV1/FVC ratio, was the greatest predictor of asthma remission in young adulthood [15] and our findings seem to support it. In our study, current asthma was independently associated with the presence of BHR, but 34% of the adolescents with BHR showed no current asthma. A previous study has reported that asymptomatic BHR in adolescence was associated with relapse of asthma in adulthood [8]. Taken together with the results of the previous studies, our results suggest that evaluation of BHR and airflow limitation is needed in the adolescents who had childhood asthma.
In addition to these overall findings, our study showed sex-specific differences in the factors associated with BHR in the adolescents with childhood asthma. In multivariate analyses, increased blood eosinophil count was independently associated with BHR in the male subjects, but not in the female subjects. Our finding seems to support the results of CAMP study which showed that a significant association between low blood eosinophil count and asthma remission in adulthood was observed only in the male subjects [15]. It is well known that atopy is closely associated with BHR. The male subjects of our study showed a positive relationship between sensitization to some inhalant allergens and BHR, and especially, mold sensitization was independently associated with BHR. However, the female subjects showed no relationship between atopic sensitization and BHR. Similar to our findings, there was a general population study which reported that atopy was a significant risk factor of BHR in boys during puberty, but not in girls [26]. Our results suggest that there might be difference in the impact of atopy on BHR between male and female adolescents.
In the present study, multivariate analyses showed that the risk of BHR decreased by 32% with each 1 year increase of age in males, which was not observed in females. Our findings seem to be consistent with those of a previous study which showed a greater increase of postpubertal methacholine PC20 with age in boys compared with girls [27]. In our study, more severe airflow limitation was observed in the female subjects with BHR than in those without, and multivariate analyses showed that reduced FEV1/FVC ratio (<90%) was independently associated with BHR only in the female subjects. Many studies have reported that surges in endogenous sex hormones across adolescence could affect BHR and lung function [9,10,28-32]. Female sex hormones are known to play a regulatory role in asthma pathophysiology, but many conflicting results have been described about pro- or anti-inflammatory effects of estrogen and progesterone [33]. A recent study in adolescents with asthma showed that androgens positively, but estrogens negatively associated with lung function [28]. In that study, lung function in females became worse compared with males during adolescence, which might be associated with dysanaptic pattern of airway growth, that is to say, differential growth of airway caliber and lung volume, due to female sex hormone [28]. Our results showed that the relationship between airflow limitation and BHR was different between the male and female adolescents, and seem to support those previous findings.
In the present study, we observed the longitudinal decrease in BHR through childhood and adolescence, and 37% of the asthmatic children who had BHR at age 6 showed persistent BHR. Multivariate analyses showed that low baseline methacholine PC20 at age 6 was an independent risk factor for the persistence of BHR in both male and female adolescents. Previously, Tucson Children's Respiratory Study reported that sensitization to Alternaria, an important asthma-associated allergen in Tucson area, at age 6 was an independent predictor of chronic asthma at age 22 [7]. In our study, HDM was the major allergen and sensitization rate to mold allergens was relatively low at age 6. However, multivariate analyses revealed that early sensitization to mold allergens at age 6 was an independent risk factor for persistent BHR through childhood, and this relationship was observed only in the male subjects. Many studies have shown the close relationship between atopy and BHR in both childhood and adolescent asthma. Our study also showed that almost 90% of the asthmatic children with BHR at age 6 had atopic sensitization. However, to the best of our knowledge, our results suggest first that we need to pay more attention to the boys who had early mold sensitization at age 6 because they might have persistent BHR in adolescence.
There are several limitations in the present study. First, as it was a single-center study, the number of the enrolled adolescents who had childhood asthma was relatively small and may have selection bias. Second, we observed that mold sensitization was independently associated with BHR, but we could not investigate the effect of individual mold species in this study. Although Alternaria and Aspergillus are known to be the most common mold allergens in Korea, we think further studies are needed to clarify the association between sensitization to specific mold allergen and BHR in adolescents. Lastly, we could not analyze the effect of environmental tobacco smoke or active smoking on the presence or persistence of BHR in the adolescents.
In conclusion, our study showed sex-specific differences in the factors associated with BHR in the adolescents who had childhood asthma and also in the risk factors for persistent BHR through childhood. Independent association between mold sensitization and BHR in adolescence was observed only in the male subjects on both cross-sectional and longitudinal analyses. Our results suggest the risk factors that might be involved in the transition of asthma from childhood into adolescence and adulthood.

 PDF Links
 PubReader
 ePub Link
 PubMed
 Download Citation


