Peripheral blood cell counts of prematurely born, small for gestational age neonates
Article information

Abstract
Background
Neonates born small for gestational age (SGA) are at an increased risk of multiple severe complications, including infections. This suggests that immune cells and other peripheral blood cells may be affected.
Purpose
Here we aimed to investigate whether SGA severity affects complete blood count and leukocyte differentiation of preterm neonates with a gestational age (GA) of <35 weeks and identify clinical factors that influence cell counts.
Methods
This retrospective cohort study investigated the complete blood count sampled within 72 hours after birth in 1,940 preterm neonates admitted to the neonatal intensive care unit of Leiden University Medical Center. The neonates were divided into extreme SGA (<3rd birth weight percentile), moderate SGA (>3rd to <10th birth weight percentile), and controls (>10th birth weight percentile).
Results
After multivariate analysis, extremely SGA neonates showed significantly decreased neutrophil, monocyte, lymphocyte, and thrombocyte counts. Thrombocyte counts were significantly lower in moderately SGA neonates than controls. In contrast, SGA status had no significant effect on erythrocyte count or hemoglobin concentration.
Conclusion
Blood cell counts of extremely SGA neonates were decreased, mainly in the white blood cell line. The mechanisms underlying these decreased counts in SGA infants, especially their clinical effects, remain unclear.
Key message
Question: As small for gestational age (SGA) neonates are more susceptible to infections, we hypothesized that their complete blood count and leukocyte differentiation might be affected.
Finding: The counts of multiple blood cells of extreme SGA neonates were affected as illustrated by multivariate analyses, which showed significant decreases in neutrophil, monocyte, lymphocyte, and thrombocyte counts.
Meaning: The mechanisms underlying this phenomenon and its clinical effects require further elucidation.
Introduction
Neonates that are small for gestational age (SGA) have a birthweight below the 10th percentile for their gestational age (GA) [1]. The cohort of SGA neonates is highly varied, as SGA classification does not take into account whether low birthweight is related to fetal growth restriction (FGR), which is in itself multifactorial in origin, or if the neonate is constitutionally small [2-6]. The clinical definition of FGR is in utero growth retardation, based on the percentile of weight, head circumference and abdominal circumference below the 10th percentile for GA used as cutoff [5,6]. SGA neonates have an increased risk of both short-term complications, such as increased risk of infections, brain injury and respiratory insufficiency, as well as long-term complications such as neurodevelopmental dysfunction and metabolic complications [7-9]. These complications could be related to the delayed development and chronic inflammation caused by the restricted growth that can occur in SGA. Additionally, other factors influencing the development of SGA such as genetics, maternal factors like preeclampsia or diabetes, placental insufficiencies or an interplay of these factors, may increase the risk of specific complications [10].
The development of the fetal immune system goes through distinct phases, starting with the primitive immune cells from the yolk sac, to the expansion of innate immune cells in the fetal liver, ending with the development of the adaptive immune cells from the fetal liver and thymus [11]. Hematopoiesis starts around the third week of gestation in the yolk sac with the production of primitive erythrocytes, megakaryocytes and macrophages, as well as hematopoietic stem cells (HSCs) [11,12]. The HSCs from the yolk sac mesoderm move towards the liver after the fourth week of gestation and start producing definitive erythrocytes, monocytes and lymphoid progenitors after 7 weeks of gestation [11,13,14]. Definitive megakaryocytes start to produce thrombocytes in the fetal liver at this stage [15]. The development of definitive lymphocytes occurs at a GA of twelve weeks, with B cells emerging from the fetal liver and T cells developing in the thymus [11]. In this same period, the HSCs start seeding the bone marrow, and full hematopoiesis from the bone marrow develops until the twentieth week of gestation [16,17]. From the bone marrow, the matured neutrophils arise. Disturbances in the maturation of the different cell types might lead to malfunctioning depending on the stage of development or the timing and severity of the growth restriction.
In 2 small cohort studies, SGA newborns had lower levels of leukocytes, including neutrophils and lymphocytes, compared to average birthweight controls [18,19]. However, these studies were not able to study the effect of the severity of the SGA on peripheral cell counts. Additionally, correcting for potential confounding factors might have been hampered by the small number of participants (n=49 [18], n=20 [19]). We hypothesized that in neonates with SGA compared to neonates with an average birthweight, multiple blood cell types might be affected, being either increased or decreased depending on the cell type and even more so in the case of extreme SGA. We aim to extend the current knowledge regarding the complete blood count of SGA neonates by including a large cohort of SGA neonates and controls, including the full differentiation of leukocytes measured at a singular timepoint per neonate and by studying additional clinical variables which may impact cellular levels.
Methods
1. Study population
All neonates with a GA at birth <35 weeks hospitalized at the Leiden University Medical Center neonatal intensive care unit between January 2010 and December 2022 were included in the study. Part of this cohort has previously been included in a study investigating the occurrence of thrombocytopenia in SGA neonates [20]. From this cohort, all neonates with a complete blood count sampled at a single timepoint within the first 72 hours after birth were selected. Neonates without a complete blood count within 72 hours after birth were excluded. Neonates who presented with clinical signs of infection for whom a C-reactive protein (CRP) >10 mg/L was measured were excluded to remove infection as a cause for altered complete blood count. Monochorionic twins diagnosed with twin-twin transfusion syndrome or twin anemia polycythemia sequence were excluded from the study, as were neonates diagnosed with polycythemia, hemolytic disease of the fetus and newborn, fetal and neonatal alloimmune thrombocytopenia and congenital anomalies to reduce confounding. Neonates were grouped based on birthweight, with neonates with a birthweight <3rd percentile for GA and sex classified as extreme SGA, neonates with a birthweight >3rd percentile and <10th percentile for GA and sex classified as moderate SGA, and those with higher birthweights as controls. Birthweight curves from Perined, the Dutch national organization for perinatal care registration, were used as reference [21]. For this retrospective study, the requirement of review and approval by the Medical Ethical Review Committee was waived by non-WMO Review Committee of the LUMC, as the Medical Research Involving Human Subjects Act did not apply (reference number 23-3064).
2. Clinical data
Clinical data was extracted from electronic patient files and included pre- and perinatal records and care, mortality, neonatal morbidities and interventions. Peripheral full blood counts and CRP measurements were performed as part of routine care within the first 3 days after birth. A neonate was diagnosed with asphyxia after meeting one of the following criteria: Apgar score <5 after 5 minutes, umbilical cord or peripheral blood pH<7.0, base excess < -16 mmol/L in umbilical cord or peripheral blood, umbilical cord or peripheral blood lactate > 10.0 mmol/L, resuscitation or ventilation for at least 10 minutes after birth.
3. Statistical analysis
A Kruskal-Wallis test was used for analysis of continuous variables between the 3 groups. P values of <0.05 were considered statistically significant. For cell types with significant Kruskal-Wallis test results, a Dunn test pairwise analysis with Bonferroni multiple comparisons adjustment was performed. After this, multiple linear regression analyses were performed to determine the effect of clinical variable on blood parameters. Eight clinical variables possibly influencing the blood parameters were used in univariable linear regression, namely sex, GA, birthweight, SGA group, multiple pregnancy, birth method, asphyxia and time between birth and blood sampling. The variables with a P value of <0.1 were included in the multivariable linear regression, to ensure no potentially relevant clinical variables were missed. There, P values of <0.005 were considered to be statistically significant, as an adjustment for multiple testing was applied. For the regression model of the neutrophils, monocytes and lymphocytes, the cell counts were transformed using a natural logarithmic transformation. For the interpretation of the effect sizes, the estimate is exponentiated to calculate the percent change in cell count per unit change of the clinical variable. The leukocyte, basophil and eosinophil counts were not included in the multiple linear regression. The leukocytes were excluded as its subsets were analyzed individually, whereas the basophil and eosinophil counts contained natural zeros, making transformation difficult. Since we hypothesized basophils and eosinophils not essential to explain the clinical differences between SGA neonates and controls, these were excluded. Z scores were calculated for birthweight and used in the regression models to reduce collinearity with both the SGA grouping and GA at birth. The birthweight z score was calculated using the following formula: (birthweight–mean birthweight)/birthweight standard deviation. The mean birthweight and standard deviation per sex and GA at birth from the Perined birthweight curves were used [21]. All statistics and visualizations were performed using R ver. 4.4.0 (R Foundation for Statistical Computing, Austria). Results from the Kruskal-Wallis test were represented in violin plots. These are an extension of the summary statistics displayed box-and-whisker plot to also include local density estimates [22]. These plots were chosen to better display the distribution of the cell count data per SGA group.
Results
1. Clinical characteristics
Perinatal characteristics of the included 1,940 neonates are presented in Table 1. The neonates in the extreme and moderate SGA groups differ from the control group by birthweight, as expected, as well as the GA at birth. The number of births in current pregnancy and the method of delivery also differed between the SGA groups and controls. The extreme and moderate SGA groups had fewer neonates with a GA<27 weeks than the control group, which may explain the significant difference between these groups (Supplementary Fig. 1). It is likely that neonates who are both extreme SGA and extremely preterm have decreased chances of survival, explaining this phenomenon in our cohort.
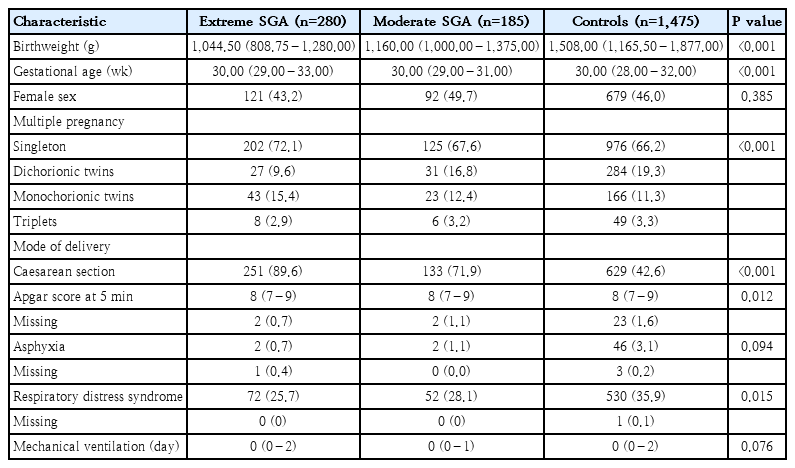
Perinatal characteristics of included preterm neonates
2. Leukocyte count and differentiation
We analyzed the leukocyte and leukocyte differentiation cell counts in the 3 SGA groups. As expected from previous literature, the leukocyte numbers were lowest in the extreme SGA group, increasing through the moderate SGA and control groups (Fig. 1A; Supplementary Table 1) [18,19]. Similarly, the lowest number of neutrophils occurred in the extreme SGA group, with cell numbers increasing slightly although non-significantly in the moderate SGA group and highest in the controls, as expected based on literature (Fig. 1B; Supplementary Table 1) [18,19,23]. The neutrophil count in both the moderate and extreme SGA groups was found to be significantly decreased compared to controls. When looking at the monocyte and lymphocyte counts, their cell number increased from extreme to moderate SGA, with highest numbers in the control group (Fig. 1C and D; Supplementary Table 1). With regard to both basophils and eosinophils, while no significant differences were found between the extreme and moderate SGA groups, cell numbers were lower in both SGA groups when compared to controls (Fig. 1E and F; Supplementary Table 1).
Violin plot of leukocyte count and differentiation in neonates with a GA<35 weeks.
Leukocyte (A), neutrophil (B), monocyte (C), lymphocyte (D), basophil (E), and eosinophil (F) counts (×109 cells/L) measured in venous blood collected within 3 days after birth of neonates with extreme SGA (n=280), neonates with moderate SGA (n=185) and controls (n=1,475) depicted on the x-axis. GA, gestational age; SGA, small for gestational age. Pairwise significances are represented above the brackets, with ns indicating nonsignificant, *P<0.05, **P<0.01, ***P<0.001, and ****P<0.0001. Median values are depicted to the right of each violin.
3. Influence of clinical variables on leukocyte differentiation
1) Neutrophils
In Table 2, both the estimate after log transformation and the exponentiated estimate of the multivariable analyses are shown. In the univariable regression analysis, 7 clinical variables were associated with the neutrophil count, all except asphyxia. When combining these clinical variables in multivariable regression analysis, the moderate SGA group was no longer significantly associated with neutrophil percentage, indicating that the effect of moderate SGA may have been confounded by the other clinical variables. The extreme SGA group remained significantly associated with lower neutrophil counts in the multivariable analysis, showing a 30.5% decrease compared to the control group. Some of the other clinical variables associated with the number of neutrophils were the time between birth and blood sampling, with each hour increase causing a 1.67% increase in neutrophils, and delivery via Caesarean section (C-section), which decreased the number of neutrophils by 19.0%. The rest of the clinical variables significantly associated with the neutrophil count were sex, GA, and dichorionic as well as monochorionic twin pregnancy.
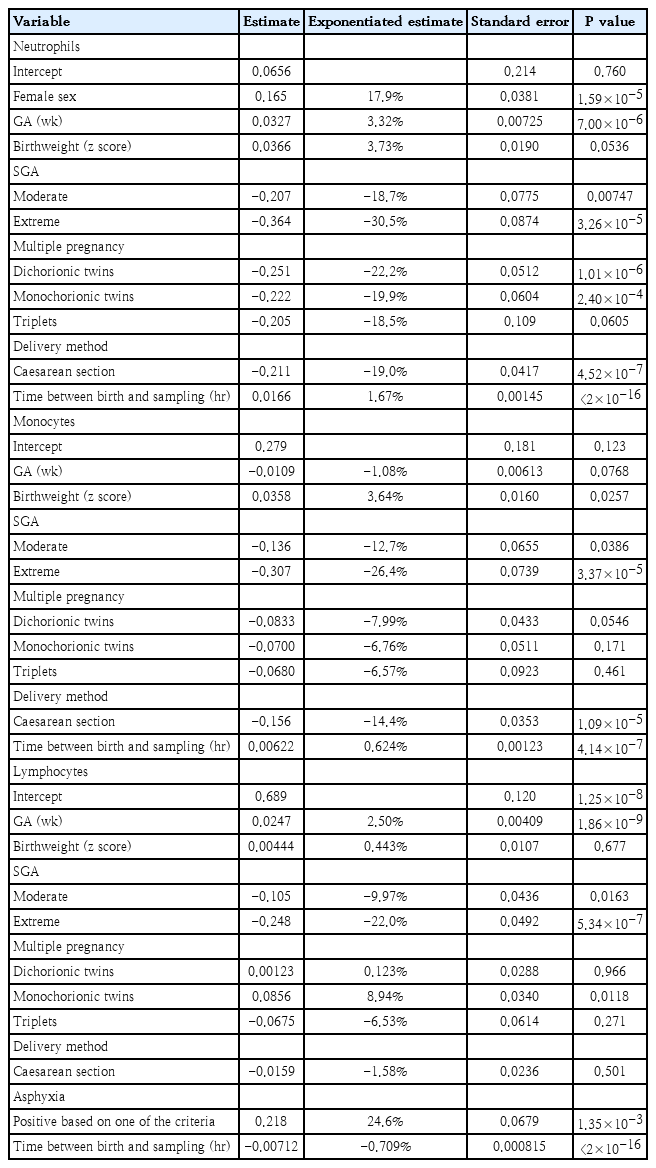
Influential clinical variables of log-transformed neutrophil, monocyte, and lymphocyte counts in neonates with a GA<35 weeks
2) Monocytes
In univariable analysis of log-transformed monocyte count, 6 clinical variables were associated with the monocyte count of preterm neonates: GA at birth, birthweight z score, SGA grouping, multiple pregnancy, delivery method and the time between birth and blood sampling in hours. Sex and asphyxia were not significantly associated with monocyte count. As seen with the neutrophils, the moderate SGA group did not have a significant (P<0.005) association with the monocyte count after multivariable regression analysis, while the extreme SGA group’s significant effect on monocyte number remained even after multivariable analysis (26.4% decrease). The rest of the clinical variables which had a significant effect on monocyte count after multivariable analysis were also significantly associated with the neutrophil count: delivery method and time between birth and blood sampling (Table 2).
3) Lymphocyte
After univariable regression analysis of log-transformed lymphocyte counts, 7 clinical variables were associated with lymphocyte count: GA at birth, birthweight z score, SGA grouping, multiple pregnancy, delivery method, asphyxia and time between birth and blood sampling. In multivariable regression analysis, the clinical variables which remained significantly associated with lymphocytes were GA at birth, extreme SGA, asphyxia and time between birth and blood sampling (Table 2). Once again, it is noted that while the moderate SGA group did not have a significant association with the lymphocyte count after multivariable analysis, the neonates in the extreme SGA group had a lower lymphocyte count, being 22.0% lower. Notably, asphyxia significantly affected the lymphocyte count, whereas the delivery method, significantly associated with the neutrophil and monocyte counts, was not associated with the lymphocyte count.
4. Erythrocyte count, hemoglobin concentration, and thrombocyte count
We did not find a significant difference between any of the groups in the number of erythrocytes in the Kruskal-Wallis test (Fig. 2A; Supplementary Table 2). In contrast, the concentration of hemoglobin (Hb) was significantly higher in both SGA groups compared to controls, but not between the SGA groups (Fig. 2B; Supplementary Table 2). Because of this disparity between erythrocyte count and Hb concentration in SGA groups compared to controls in our cohort, we also analyzed the mean corpuscular Hb (MCH) and mean corpuscular volume (MCV). Both the MCH and MCV were significantly increased in neonates with either extreme or moderate SGA compared to controls (Fig. 2C and D; Supplementary Table 2). The increased MCH of SGA neonates may explain why the Hb concentration was increased while no differences were seen in erythrocyte counts between SGA groups. Finally, when investigating thrombocytes, it was determined that the neonates with extreme SGA had the lowest count, increasing in neonates with moderate SGA and highest in controls (Fig. 2E; Supplementary Table 2).
Violin plot of blood cell counts in neonates with a GA<35 weeks.
Erythrocyte count (A), hemoglobin concentration (B), mean corpuscular hemoglobin (C), mean corpuscular volume (D), and thrombocyte count (E) measured in venous blood collected within 3 days after birth of neonates with extreme SGA (n=280), neonates with moderate SGA (n=185), and controls (n=1,475) depicted on the x-axis. GA, gestational age; SGA, small for gestational age. Pairwise significances are represented above the brackets, with ns indicating nonsignificant, *P<0.05, **P<0.01, ***P<0.001, and ****P<0.0001. Median values are depicted to the right of each violin.
5. Influence of clinical variables on erythrocyte count, Hb concentration and thrombocyte count
1) Erythrocytes
Five clinical variables were associated with the erythrocyte count in univariable analysis: sex, GA, birthweight z score, asphyxia and the time between birth and blood sampling in hours. The clinical variables not associated with erythrocyte count in univariable analysis were SGA grouping, as expected from the pairwise analysis (Fig. 2A), multiple pregnancy, and delivery method. In the multivariable linear regression model GA at birth and asphyxia were significantly associated with the erythrocyte count (Table 3).
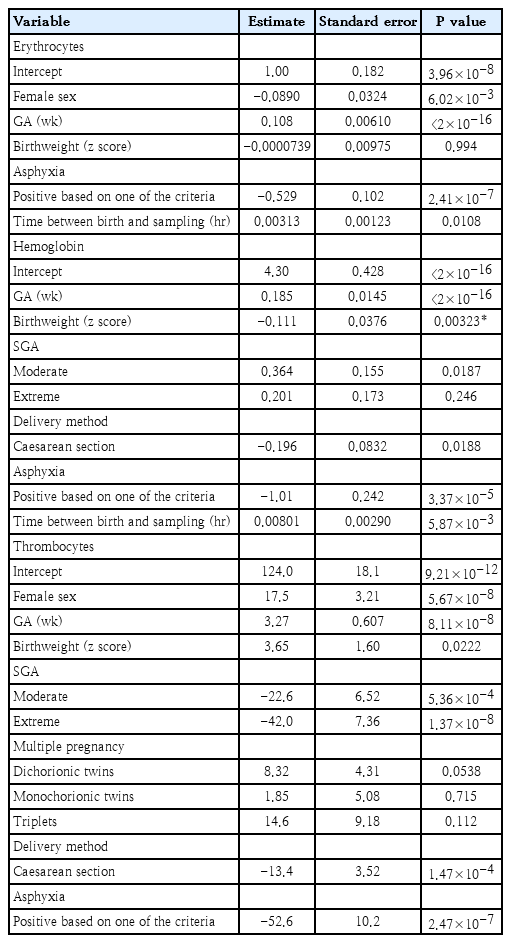
Influential clinical variables of erythrocyte count, hemoglobin concentration, and thrombocyte count in neonates with a GA<35 weeks
2) Hemoglobin
Six clinical variables were associated with the Hb concentration in univariable analysis: GA at birth, birthweight z score, SGA grouping, delivery method, asphyxia and the time between birth and blood sampling in hours. When including these in the multiple variable model, SGA grouping was no longer significantly associated with Hb concentration, indicating that the clinical variables have confounded the univariable association. Using multivariable analysis, GA at birth, birthweight z score and asphyxia remained significantly associated with the Hb concentration (Table 3).
3) Thrombocytes
Seven clinical variables were associated with the number of thrombocytes in univariable analysis: sex, GA at birth, birthweight z score, SGA grouping, multiple pregnancy, delivery method and asphyxia. In the multivariable linear regression model, sex, GA, moderate SGA, extreme SGA, C-section birth and asphyxia were significantly associated with the thrombocyte count (Table 3). While the thrombocyte count in both the moderate and extreme SGA groups remained significantly lower than in controls, it is evident that the effect of extreme SGA on the thrombocyte count is larger (-42.0×10⁹ thrombocytes/L) than in cases of moderate SGA (-22.6×10⁹ thrombocytes/L). This finding is in line with previous research within our department [20].
Discussion
In this study, in a large population of neonates born at a GA <35 weeks with complete blood count data within 72 hours after birth as well as a detailed clinical dataset, we have shown that extreme SGA is associated with significant decreases in cell counts in the first days after birth, including leukocytes, neutrophils, monocytes, lymphocytes and thrombocytes.
In the univariable analyses performed on the leukocyte differentiation cell types, it was noted that neutrophil counts were influenced by most of the included clinical variables. This was in line with our expectations, as the neutrophils are the first line response of the immune system, and are therefore likely to be influenced by many clinical factors [24]. When performing multivariable analyses on the leukocyte differentiation, only the extreme SGA group continued to be significantly associated with a decreased cell count, suggesting that the time between birth and blood sampling as well as the delivery method confounded the results of the univariable analysis. It has been reported that the neutrophil count increases and the lymphocyte count decreases over the first days after birth and that C-sections are associated with lower neutrophil and monocyte numbers, as vaginal birth is associated with increased levels of trauma in the neonate [25-28]. We found the same patterns of cell changes for these clinical variables. By correcting for these confounders, we were able to clarify that extreme SGA in itself is associated with decreased neutrophil, monocyte and lymphocyte counts.
The decreased number of leukocytes seen in the extreme SGA group could be an explanation for some of the complications seen in SGA neonates. Preterm neonates with leukopenia or neutropenia have an increased risk of infection and sepsis [29,30]. Preterm neonates with extreme SGA are therefore likely at increased risk of these complications. By defining the baseline of different blood cell types for multiple neonatal populations at birth, the changes that occur in neonates who develop both short-and long-term complications may be mapped more precisely. Studying the bone marrow output of neonates born SGA with assays of hematopoietic regulators and following cell differentiation over time may further clarify the pathophysiological changes and might lead to preventive options for this specific population.
Regarding the red blood cell line and thrombocytes, findings from our cohort were mostly in line with previous research. In short, it was noted that erythrocyte count and Hb concentrations followed the same trends across SGA groups, and thrombocyte count significantly increased with reducing level of SGA [20,31,32]. A notable difference between previous research and our findings was seen in both erythrocyte counts and Hb concentration, which has been reported to be increased in SGA neonates, contrary to our findings [23]. This may be related to differences in cohorts tested or samples analyzed.
There are multiple possible explanations for the fact that not all blood cells are similarly associated with SGA. One option may be that hematopoiesis starts with the development of red blood cells and the immune system develops later in gestation [33]. This may cause the development of neutrophils, monocytes and lymphocytes to be more impacted by reduced growth at a later stage [34]. The delay in the development of the immune system compared to the red blood cell line is only marginal, but may have a larger impact in preterm neonates with lower GA at birth [11]. This does, however, not explain why thrombocytes are so strongly impacted by SGA, as these also develop early during embryonic development [15]. Another possibility is that in cases of SGA caused by FGR, the stress resulting from the reduced blood flow causes the fetus to prioritize the erythrocytes, putting the production of immune cells and thrombocytes on the back burner, as these are less vital while in utero. Finally, the underlying pathophysiology of FGR can play a role. If the growth becomes restricted due to an infection or another cause, immune cells may get transported into the affected tissues and thrombocytes get used up.
Our current research design has some methodological limitations which may impact the study. The retrospective nature of the study limits the availability of data, such as regarding the cause and timing of development of the SGA, as well as restricting follow up blood counts or patient outcome data. This also causes risk of selection bias, as we selected blood sampling data from a single timepoint, causing any changes in care or measurement may influence the outcomes of our study. Additionally, residual confounders may exist within our cohort. Finally, the complete blood cell counts do not directly assess the bone marrow output and may be influenced by multiple mechanisms such as increased peripheral destruction or redistribution. In future research, we aim to perform studies in which the bone marrow output of SGA neonates is more directly investigated, further immune cell differentiation is included, and data is collected regarding timing of growth retardation during pregnancy as well as maternal factors.
The design of our study also provides strengths. The large size of our study populations increased the power of our analyses. Additionally, this size and the availability of a full blood cell count from a consistent timepoint establishes a reliable baseline for the 3 SGA groups, and the clinical data recorded ensures that the impact of multiple factors could be investigated.
In conclusion, we found that extreme SGA is associated with altered complete blood counts, with decreased levels of neutrophils, monocytes, lymphocytes and thrombocytes. Future research into the mechanisms leading to these changes in cell counts following SGA and the clinical consequences of decreased immune cells is necessary to improve the care for these neonates. This study in preterm neonates might be a start to create a complete overview of the development and differentiation of blood cell types and the impact of SGA on these processes.
Supplementary materials
Supplementary Tables 1-2 and Supplementary Fig. 1 are available at https://doi.org/10.3345/cep.2025.02978.
Leukocyte and leukocyte differentiation cell counts in neonates with a GA<35 weeks measured within 3 days after birth
Bone marrow output in neonates with a GA<35 weeks measured within 3 days after birth
Violin plot of GA at birth in weeks in included neonates. X-axis depicts the neonate groups, extreme SGA (n=280), moderate SGA (n=185), and controls (n=1,475). GA, gestational age; SGA, small for gestational age. Pairwise significances are represented above the brackets, with ns indicating nonsignificant (ns), **P<0.01 and ****P<0.0001.
Notes
Conflicts of interest
No potential conflict of interest relevant to this article was reported.
Funding
This study received no specific grant from any funding agency in the public, commercial, or not-for-profit sectors.
Author contribution
Conceptualization: MHDS, VB, MOZ; Data Curation: SG, EL, VB; Methodology: MHDS, VB, MOZ; Formal Analysis: MOZ; Visualization: MOZ; Investigation: MHDS, VB, MOZ; Project Administration: MHDS, VB, MOZ; Writing – Original Draft: MHDS, MOZ; Writing – Review & Editing: SG, EL, VB