Relationship between inflammatory biomarkers and insulin resistance in excess-weight Latin children
Article information

Abstract
Background
Excess weight, inflammation, and insulin resistance (IR) are associated, but the prevalence of and biomarkers for IR in Latin children are unknown.
Purpose
This study aimed to determine the prevalence of IR in prepubertal and pubertal Latin children with excess weight and explore the usefulness of different biomarkers of low-grade inflammation for identifying IR status.
Methods
Sixty-eight children (31 boys, 37 girls; approximately 11 years of age) with excess weight (overweight and obese) and 20 healthy normal-weight children (12 boys, 8 girls; approximately 12 years of age) were included. Anthropometric parameters, insulin, neutrophil/lymphocyte ratio, platelet/lymphocyte ratio, tumor necrosis factor- α (TNF-α), interleukin (IL)-6, monocyte chemoattractant protein-1 (MCP-1), soluble CD40 ligand (sCD40L), high-sensitivity C-reactive protein (hs-CRP), and myeloperoxidase were assessed and IR was determined by homeostasis model assessment index (cutoff points: 2.67 and 2.22 in prepubertal boys and girls and 5.55 and 3.82 in pubertal boys and girls, respectively). Intergroup differences were compared, correlations were investigated using Pearson correlation coefficient, and stepwise multiple linear regression analyses were performed to estimate the relationship between inflammatory biomarkers and IR.
Results
The prevalence of IR among overweight children was 62%. IL-6 levels differed between overweight and obese boys, while erythrocyte sedimentation rate, MCP-1, TNF-α, IL-6, hs-CRP, and sCD40L differed between obese and normal-weight boys. In contrast, sCD40L levels were increased in overweight versus normal-weight girls, while MCP-1, TNF-α, IL-6, and sCD40L differed between obese and normal-weight girls. Furthermore, MCP-1 and sCD40L levels and erythrocyte sedimentation rate were positively correlated with IR; however, a stepwise regression analysis that adjusted for the body mass index (BMI) z score, sex, and age showed that none were good predictors of IR status.
Conclusion
The prevalence of IR is high among Latin children with excess weight. Although some inflammatory biomarkers differed among groups, none robustly predicted IR.
Key message
Question: What is the prevalence of insulin resistance (IR) in excess-weight Latin children, and can proinflammatory biomarkers predict it?
Finding: IR prevalence was elevated and tumor necrosis factor- α, interleukin-6, monocyte chemoattractant protein- 1, soluble CD40 ligand, and high-sensitivity C-reactive protein levels were increased in excess-weight Latin children. However, none predicted IR status.
Meaning: These inflammatory biomarkers were unable to predict IR status. Therefore, further investigations are necessary.
Graphical abstract. TNF-α, tumor necrosis factor-α; IL-6, interleukin 6; MCP1, monocyte chemoattractant protein-1; sCD40L, soluble CD40 ligand; hs-PCR, high-sensitivity C-reactive protein; MPO, myeloperoxidase; NLR, neutrophil-tolymphocyte ratio; PLR, platelet-to-lymphocyte ratio.
Introduction
Obesity is a chronic, epidemic, preventable and high-cost disorder, characterized by excessive or abnormal adipose tissue accumulation that carries health risks and implications. Childhood obesity, as in adults, has reached alarming dimensions all over the world. Evidence has shown that childhood obesity increases risks of hyper-insuliniaemia, insulin resistance (IR) and also chronic diseases, such as diabetes, hypertension and cancer [1].
Normal adipose tissue contains multiple immune cells which maintain and monitor adipocyte integrity and hormone sensitivity. In obese subjects, macrophages suffer drastic changes showing a proinflammatory phenotype and cytokine secretion such as tumor necrosis factor-α (TNF-α) and interleukin 6 (IL-6). Additionally, elevated lipid species due to diet or obesity can promote inflammation by increasing chemokine synthesis and secretion, like monocyte chemoattractant protein-1 (MCP-1) from adipocytes, leading to macrophage infiltration [2]. Hypertrophy and hyperplasia of fat tissue result in adipocytes hypoxia, thus increasing cellular stress levels. In consequence, local proinflammatory substances are released, leading to an inflammatory process [3]. These changes result in a cellular dysfunction and systemic process that alters insulin sensitivity and glucose homeostasis, increasing the release of systemic free fatty acids (FFA) and lipid deposition in mainly glucoregulatory organs. The process causes excessive systemic proinflammation and oxidative stress leading to the onset IR. IR mechanisms are varied, complex and interrelated, and although not fully elucidated it is accepted that one of the key alterations is serine residues modification of the insulin receptor substrate protein and impaired tyrosine phosphorylation, as well as the upregulation of proteins that can deregulate insulin receptor function [4].
In this sense, obesity is associated with IR, however, up to 30% of obese patients are metabolically healthy with insulin sensitivity similar to that of normal-weight individuals. In addition, in Latin America, information on the IR prevalence in overweight children is scarce. Knowledge about the IR prevalence rates and its clinical consequences during childhood is important, since it could be used as a tool for the future metabolic complications detection, such as type 2 diabetes mellitus or cardiovascular disease. Furthermore, it could increase the awareness of doctors and other health professionals in overweight and obese populations [5].
In the management of excess weight patients (overweight and obese subjects), finding simple and cheap markers to determine the disease progression in order to reduce the associated complications is essential, such as neutrophil-to-lymphocyte ratio (NLR) and platelet-to-lymphocyte ratio (PLR). In this context, different inflammatory biomarkers have been studied. In fact, several researchers have reported a positive association between different molecules and inflammatory parameters (MCP-1, high-sensitive C- reactive protein [hs-CRP], NLR, PLR and others), overweight and obesity degree [6]. However, most of these studies have been focused on adults. There is therefore a need to further our knowledge about the association of these parameters in pediatric population because obesity chronic complications begin at this time [7].
Despite the obesity pandemic and the subsequent increase in related pediatric chronic diseases, the number of studies addressing the involvement of cytokines as IR biomarkers in childhood is limited. Our current knowledge about the particular pathways for obesity-linked inflammation related to human obesity, is still limited especially in children population. For this reason, experts highlight the importance of identifying new pathways and specific candidate targets for obesity associated inflammation and IR. There are many inflammatory markers that could promote IR. Although this hypothesis could not be confirmed in the pediatric population, some inflammatory markers could be significantly associated with IR in children such as TNF-α, IL-6, IL-1β, IFNγ, and Fetuin A. Unfortunately, none have been proven of prognostic value. Therefore, their value for routine clinical purposes remains to be elucidated as well as to study new biomarkers [8].
In this context, the aim of this study was to determine the IR prevalence in excess weight prepubertal and pubertal and puberal Latin children and explore the usefulness of low-grade inflammation different biomarkers to identify IR status.
Methods
1. Study design
An observational, analytic, and cross-sectional design was conducted with patients who visited the Endocrinology Department of a pediatric hospital in Tucumán (Argentina) from August 2018 to March 2020.
2. Study population
A total of 68 children (31 boys and 37 girls) with excess weight (overweight and obesity) were included in the study. All children were between Tanner stage I and II and had normal blood pressure levels for their age and sex. The World Health Organization (WHO) criteria were used to diagnose overweight and obesity. For children aged 5–19 years, normal weight was defined as body mass index (BMI) between 15th and 84th percentile; overweight between 85th and 97th percentile, and obesity >97th percentile for age and gender. Percentiles were calculated using the reference tables recommended by the WHO [9]. Patients, with obesity-related complications, chronic disorders, infectious diseases, incomplete data, and children whose parents refused to sign the informed consent form, were excluded from this protocol.
3. Control groups
The control group included 20 healthy, normal-weight subjects of similar age and sex to the study group and without obesity family history (12 boys and 8 girls).
4. Anthropometric measurements
All subjects underwent a full clinical evaluation, including weight, height, waist circumference (WC), BMI and family history of diabetes and/or cardiovascular disease.
• Weight and height were measured by mechanical scale (p-1003-k, Cam, Buenos Aires, Argentina), with light clothing and no shoes, with ankles together, relaxed shoulders and both arms at the sides of the bodies.
• BMI was estimated by the Quetelet index (weight/size2), using the BMI Calculator of Baylor College of Medicine. This calculator provides the BMI and the corresponding BMI percentile for age based on the WHO growth charts, which were used to define obesity and overweight.
• WC was measured with an anthropometric tape measure (Lufkin W606PM, New York, NY, USA) at the site of maximum circumference midway between the lower ribs and the anterior superior iliac spine.
• In addition, BMI z score and Height z score (Htz) were calculated using the BMI Calculator of Baylor College of Medicine [10].
5. Biochemical parameters
1) Hematological and Blood chemistry data
Blood samples were obtained between 8 and 10 AM by venipuncture after 12 hours fast. Blood count (complete blood cell) and erythrocyte sedimentation rate (ESR) were assessed with anticoagulated blood collected with a 10% ethylenediaminetetraacetic acid additive using a blood cell counter (Sysmex KX 21, Kobe, Japan) and Westergren method, respectively. Blood parameters evaluated were: fasting blood glucose, triglycerides, total cholesterol, high-density lipoprotein cholesterol (HDL-C), low-density lipoprotein cholesterol (LDL-C), non–high-density lipoprotein cholesterol (non–HDL-C) and transaminases, using a Mindray BS-380 chemistry analyzer (Mindray Bio-Medical Electronics CO., Ltd., Shenzhen, China).
2) Insulin resistance
IR was measured by the index homeostasis model assessment (HOMA). For this, plasma insulin was determined (ECLIA method, Roche, Rotkreuz, Switzerland), and HOMA was calculated using the Matthews formula.In this research the HOMA cutoff values for IR in the prepubertal period were 2.67 in boys and 2.22 in girls, and in the pubertal period, they were 5.22 in boys and 3.82 in girls [11].
3) Proinflammatory biomarkers
We evaluated inflammatory molecules such as TNF-α, IL-6, MCP-1 (ELISA method, R&D Systems, Minneapolis, MN, USA), soluble CD40 ligand (sCD40L, ELISA method, PeproTech, Cranbury, NJ, USA), hs-CRP (chemiluminescence method, Immunolite 2000, Siemens, Berlin, Germany) and myeloperoxidase (MPO ELISA method, Binding Site Ltd., Birmingham, UK). In addition, we calculated NLR and PLR ratios (calculated by dividing the neutrophil count and platelet count by the lymphocyte count, respectively).
6. Statistical analysis
Statistical analysis was performed using IBM SPSS Statistics ver. 25.0 (IBM Co., Armonk, NY, USA). Kolmogorov-Smirnov test was used to determine quantitative variable distribution. All data were expressed as frequency and percentage for categorical data and as mean±standard deviation or median with Q1 and Q3 for numeric data. Differences in study participants’ characteristics were compared across subgroups with chi-square test for categorical variables and differences in mean levels of continuous variables between subgroups were determined using 1-way analysis of variance with Bonferroni and Games-Howell post hoc test as appropriate for multiple comparisons. Three-way group analysis of variance was used to examine the differences within IR by Tarner and sex. Pearson coefficient to investigate the correlations and multiple linear regression analyses step-by-step were conducted to estimate the relationship between inflammatory biomarkers and HOMA. A P value <0.05 was considered statistically significant. For the statistical power estimating, the G* Power software ver. 3.1.9.6 (Franz Faul, University Kiel, Germany) was used.
7. Ethical statement
All parents/caregivers signed the informed consent for their children. The study was approved by the Ethics Committee (No. 1699-410-2021) and was conducted in accordance with the declaration of Helsinki with good clinical practice as defined by the International Conference on Harmonization.
Results
1. Clinical characteristics and IR of the studied groups
Patients studie dincluded : Overweight, obese and normal-weight children groups. The mean age was: for overweight: 11 (9–12) years, obese: 10 (9–12) years and normal weight: 12 (9–13) years. The analysis of the variance test was performed to evaluate the differences between them. On the one hand, significant differences (P<0.05) were only found for BMI, BMI z score, height z score,Insulin, HOMA, triglycerides, HDL-C, alanine aminotransferase (ALT), and aspartate aminotransferase (AST). In particular, children with overweight showed significantly higher BMI z score (P<0.001, β=0.99), Height z score (P<0.001, β=0.49), and Insulin (P<0.001, β=0.67) compared to normal-weight group; and high BMI z score (P<0.001, β=0.99) and ALT (P<0.001, β=0.55) in respect to obesity group. On the other hand, obesity group had significant differences in BMI (P<0.001, β=0.90), BMI z score (P<0.001, β=0.99), Height z score (P<0.001, β=0.49), Insulin (P<0.001, β=0.67), HOMA (P<0.001, β=0.95), HDL-c (P<0.05, β=0.70), Triglycerides (P<0.001, β=0.50), ALT (P<0.001, β=0.55) and AST (P< 0.01, β=0.50) compared to normal-weight group. IR prevalence in children with excess weight was 62%. In the analysis by sex and Tanner stage, prepuber and puber, the prevalence of IR was 56% and 73%, respectively (Table 1).
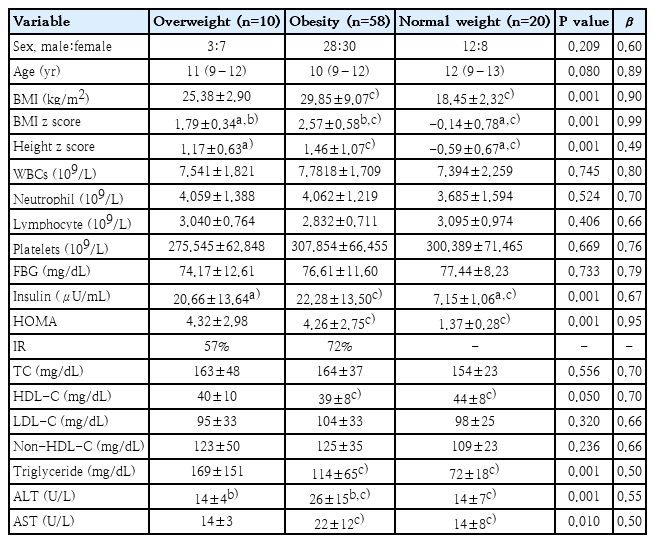
Patients’ clinical and biochemical characteristics by study group
Fig. 1 shows the percentage of children with and without IR according to Tanner stage (prepubertal and pubertal) and sex (43 boys and 45 girls). To evaluate the differences between groups (normal weight, overweight, and obese), Chi-square test was used. IR percentage between the different groups was significant(P<0.005) in the prepubertal and pubertal stage. Non-IR was reported in the normal-weight population.In overweight patients (prepubertal and pubertal), girls showed a higher IR percentage (7% in both groups). In obese group, IR percentages were higher for both sexes and both stages: prepuber (boys 27%, girls 28%) and puber (boys 9%, girls 16%). Finally, independently of sex and Tanner stage, patients number with IR increases according to the excess weight degree. The mean HOMA for the main groups, in prepubertal stage, were: overweight (girls=4.94±2.07) and obese (girls=4.81±1.82; boys=4.17± 1.32). Whereas, in the pubertal pediatric population were: overweight (girls= 4.96±0.51; boys=7.73) and obese (girls= 7.88±3.83; boys= 8.01±0.87).
Percentage of subjects with versus without IR by study group (normal weight, overweight, and obese) and prepubertal or pubertal stage. The percentages were calculated considering the total population of girls (n=45) and boys (n=43). IR, insulin resistance. (A) Percentages in the prepubertal pediatric population. (B) Percentages in the pubertal pediatric population.
2. Inflammatory biomarkers
Regarding inflammatory biomarkers, boys with overweight only showed IL-6 increased levels compared to the obesity group (P=0.028) and no significant differences compared to normal-weight group. Whereas, ERS (P=0.010), MCP-1 (P=0.003), TNF-α (P=0.017), IL-6 (P=0.028), hs-CRP (P=0.013), and sCD40L (P=0.001) levels in obese patients exhibited significant increases compared to subjects with normal weight. Similar results were found when the same analysis was performed on girls. Girls group with overweight showed significant differences in only sCD40L (P=0.001) compared to girls with normal weight and none significant differences compared to girls with obesity. On the other hand, MCP-1 (P=0.001), TNF-α (P=0.012), IL-6 (P=0.008), and sCD40L (P=0.001) concentrations were significantly higher in the population of girls with obesity than in girls with normal weight. Interestingly, no relevant changes were found in the NLR, PLR and MPO (Table 2).
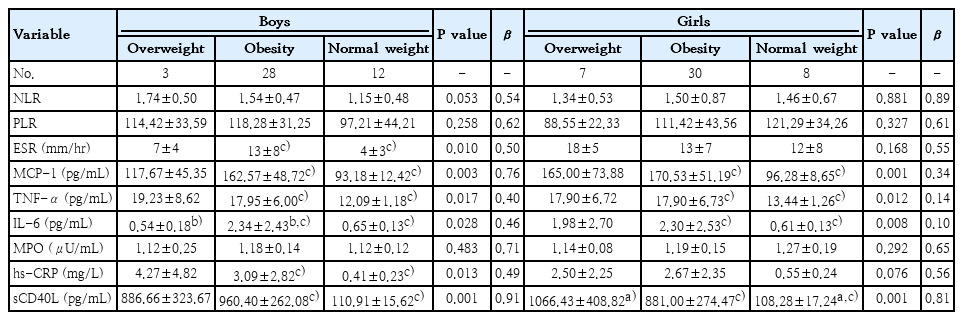
Levels of proinflammatory biomarkers by sex in overweight, obesity, and normal-weight groups
3. Inflammatory biomarkers according to the HOMA
When inflammatory biomarkers were examined in the excess weight group of subjects with IR according to sex and Tanner stage (prepubertal and pubertal), there was no statistically significant difference between excess weight individuals without IR (30 patients in total) and excess weight individuals with IR (38 patients in total) (Table 3).
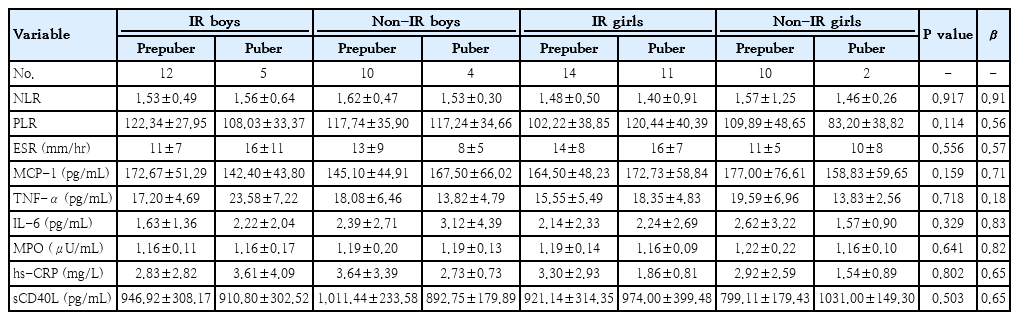
Levels of proinflammatory biomarker in excess weight group with versus without insulin resistance by pubertal status and sex
4. Correlations between certain variables and regression analysis multivariate
MCP-1, sCD40L, and ESR levels correlated positively with HOMA (Table 4). The variables exhibiting the highest correlation with HOMA (ESR, MCP-1, and sCD40L) were selected as variables in the regression analysis step-by-step and then were adjusted by BMI z score, gender and age. In the model 1, sCD40L was contributed significantly to the model, in total, 93% of the HOMA variance could be accounted for by this model. However, in model 2 adjusted by BMI z score, gender and age, any study variable (ESR, MCP-1, and sCD40L) contributed significantly to the model (Table 5).
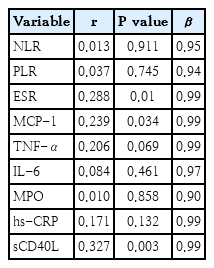
Correlation between homeostasis model assessment and inflammatory biomarkers
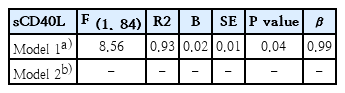
Multiple linear regression analysis of inflammatory markers associated with homeostasis model assessment
Discussion
In excess weight (overweight and obesity) subjects, adipose tissue has been proven to contribute to both the initiation and maintenance of chronic low-grade inflammation, and this is likely to be responsible for obesity-related complications [8]. Nevertheless, the number of studies addressing the implication of cytokines produced in low-grade inflammation as biomarkers of childhood IR is limited. Indeed, experts highlight the importance of identifying new targets for obesity associated inflammation and IR in the pediatric population. Several inflammatory markers could be used, however, up to date, none have been shown to have prognostic value and their value for routine clinical purposes remains to be elucidated. The aim of this study was to determine the IR prevalence in excess weight prepubertal and pubertal Latin children and explore the usefulness of low-grade inflammation different biomarkers to identify IR status.
IR and glucose intolerance causes a predisposition to several metabolic disorders such as early atherosclerosis, progressive obesity, acanthosis nigricans, dyslipidemia, fatty liver and lead to a significant risk for cardiovascular diseases, as well as type 2 diabetes. The mechanisms responsible for the IR developmentin obese patients remain incompletely understood. Apparently, increased lipolysis with the excessive release of FFA and proinflammatory cytokines, may inhibit insulin action [12]. Several methods have been used to define insulin sensitivity, such as fasting insulin and the HOMA index, although there is no consensus on the cutoff points in pediatric population [11]. In this research, we found that most of the subjects under study were obese and showed IR with insulin and HOMA increased values (62%). A review about IR in childhood showed controversial results according to the population studied. Greece reported the lowest prevalence (3.1% in children aged 10–12 years), based on the papers used for that review, whereas New Zealand reported a prevalence rate of 44%. Latin populations also showed different results: Mexico (27%) and Chile (28%). Sentalin et al. found a high IR prevalence among children with obesity (84.5%) [13,14]. Additionally, a cross-sectional study involving 817 healthy adolescents revealed a strong association between elevated HOMA values, high BMI and other obesity parameters, concluding that obesity indices are positively associated with IR [15]. On the other hand, studies in obese children evaluating weight reduction have shown that IR ameliorative in patients who lose weight [16]. In general, there is a strong association of increased BMI and Tanner stage with increased IR in children and adolescents, while the sex effect is controversial. In this research, we found that the number of children with IR increases with BMI, both in prepubertal and pubertal stage. These results were reported by other authors. Ballerini et al. studied the relationship among HOMA values, BMI and Tanner stage in children and adolescents, finding that the increase in BMI and pubertal development increase the cases of IR [17].
Adipose tissue in obese subjects secretes humoral factors that regulate systemic acute phase reactants, including CRP, as well as inflammatory factors, like TNF-α, IL-6, and MCP-1 [18]. TNF-α may suppress insulin action in adipocytes through inhibitors of the insulin signaling pathway and also appears to be related to peripheral IR [19]. Higher levels of IL-6, also a pleiotropic cytokine, are associated with BMI and IR. It is the main regulatory cytokine of acute inflammatory response and has a critical role in chronic inflammation [20,21]. Likewise, MCP-1 and its receptors are crucial for inflammatory response development and immune cells recruitment to inflammatory sites and have been associated with the vascular complications of obesity [22].
In this study inflammatory biomarker analysis according to the obesity grade based on percentile revealed elevated levels of TNF-α, MCP-1, IL-6, hs-CRP, sCD40L, and ESR in obese group vs normal-weight group; and only showed significant differences in hs-CRP, sCD40L and ESR between overweight and healthy group. On the other hand, when the same analysis was performed according to IR status in the population with excess weight, no significant differences were found. Additionally, although CD40, MCP-1 and ESR were correlated with IR status, they were not effective as predictors for it according to multiple linear regression analysis adjusted by BMI z score, gender and age. Similar findings were reported in a study of 193 children with overweight and obesity from Romania, which showed significantly higher levels of adipokines in obese children and a correlation between BMI and IL-6 and TNF-α serum values [23]. Chang et al. [18] have reported high TNF-α, hs-CRP, and MCP-1 levels in 19 obese compared to normal-weight group. In addition, MCP-1 was the only inflammatory biomarker that was lower among the overweight group than the obese group.In another study performed in Mexico, 183 obese children did not show significant increases in IL-6 and there was no correlation with HOMA [24].
Obesity animal models show high levels of neutrophils in plasma, which may infiltrate adipose tissue, promoting both disease and complications such as IR. MPO is the most abundant protein in neutrophils and it has an important part in inflammation and appears to contribute to IR. This suggests that MPO may play an essential role in obesity and has been proposed as a biomarker [25]. sCD40L is another non-classical inflammatory biomarker. It is present in platelets, who express CD40 ligand (CD40L) on their surface upon stimulation; CD40L is then cleaved and circulates as soluble CD40L. When exposed to CD40-bearing vascular cells, platelet-associated CD40L triggers the expression of various proinflammatory mediators [26].
Overweight and obese children enrolled in this study showed higher sCD40L values compared to normal-weight group, but not MPO. Both markers were not modified with metabolic and glycaemic status. Similar results were found in other clinical research. A recent publication concluded that the CD40-CD40L system is strongly related to obesity and suggests it could be used as a new early warning biomarker for metabolic syndrome [27]. However, we did not find any studies in the consulted literature that discuss the use of CD40 levels as a predictor of IR in children with excess weight which could be compared to our results. A prospective multicenter study, conducted in Spain, found that MPO, hs-CRP, IL-6 and TNF-α plasma levels were higher in obese children compared to normal-weight group [25]. Our results diverge from other researchers who studied 238 adult subjects and found that MPO values were higher in obese patients compared to non-obese group. However, they found, like us, that TNF-α, hs-CRP, and IL-6 are all increased in obese patients [28].
Morerecently, NLR and PLR ratios have received attention as emerging inflammatory markers. It has been suggested that the proinflammatory state may result in elevated neutrophil and platelet counts and low lymphocyte counts; this could be related to the human physiological immune response and an acute inflammatory reaction. To our knowledge, only a few reports have evaluated their values in pediatric patients with central adiposity, but neither has linked them to established inflammatory markers, IR and WC, so their usefulness is still under discussion [29]. Although we found that neutrophil and platelet counts in overweight and obese children were slightly higher than in normal-weight subjects and lymphocyte counts were slightly lower, these differences were not significant. This was even after analysis according to excess weight grade and IR status. Our results were consistent with a Turkish study conducted in 96 children, which examined the relationship between the NLR and IR in obesity. Researchers found that the number of neutrophils was higher in obese participants, but not significantly. Nevertheless, within obese participants with and without IR, significant differences were found [30]. Other researchers found a significant rise of NRL in obese pediatric population, compared to healthy controls, but not of the PLR index and it correlated positively with hs-CRP [31]. Therefore, the results are discordant.
This study has some limitations: the cross-sectional type of experimental design only allows us to establish associations but not causality and the size of children with overweight and obesity needs to be expanded to confirm the results. Therefore, additional studies are needed to evaluate the clinical utility of these disease progression biomarkers. On the other hand, there is no international or national consensus on IR cutoff points, so it is not possible to extrapolate our results to all populations. However, we used HOMA values to define IR which were reported as points with high diagnostic sensitivity. This highlights the importance of continuing studies to define cutoff points.
In brief, an important point of this research was to determine the IR prevalence in overweight and obese children from Tucumán, Argentina. Another interesting result was to show that the inflammatory biomarkers tested do not present strong predictive characteristics of IR in this Latino population.The discrepancies found with the limited literature addressing this topic in the pediatric population may be due to other variables that were not considered in this study and the fact that in children, the development of comorbidities associated with excess body fat may be a later event, in part due to the greater capacity for tissue renewal/regeneration in children [7].
Notes
Conflicts of interest
No potential conflict of interest relevant to this article was reported.
Funding
This study received no specific grant from any funding agency in the public, commercial, or not-for-profit sectors.
Author contribution
Conceptualization: AMN, LMC, AAV; Data curation: BMC, AMN, LMC, AER, AAV; Formal analysis: AMN, LMC, AAV; Methodology: AMN, LMC, AER, BMC, AAV; Project administration: AAV; Writing-original draft: AMN, LMC, AER, AAV; Writing-review & editing: BMC, AMN, LMC, AER, AAV