Changes and correlations of T-cell coinhibitory molecule programmed death-1 and interferon-γ in pediatric immune thrombocytopenia
Article information

Abstract
Background
Immune thrombocytopenia (ITP) is an acquired autoimmune disease characterized by abnormalities of T cells subsets. Programmed death-1 (PD-1) is a co-signaling inhibitory molecule in T cells that is involved in many autoimmune diseases.
Purpose
Here we aimed to measure changes in PD-1 expression and serum interferon-γ (IFN-γ) levels before and 1 month after treatment in pediatric patients with newly diagnosed ITP.
Methods
We measured PD-1+ CD4+ T cells percentages using flow cytometry and the serum IFN-γ levels by enzyme-linked immunosorbent assay in 40 pediatric patients with ITP and 20 healthy controls.
Results
Compared with healthy controls, the PD-1+ CD4+ T cells percentages and serum IFN-γ levels were significantly higher in ITP patients before and 1 month after therapy. A correlation study revealed that PD-1+ CD4+ T cells percentage was negatively associated with platelet count and positively associated with IFN-γ level in patients with ITP. Furthermore, serum IFN-γ levels were significantly decreased in patients after treatment, but no significant change was detected in the percentage of PD-1+ CD4+ T cells before or 1 month after therapy.
Conclusion
PD-1+ CD4+ T cells expression and IFN-γ levels were increased in patients with ITP. These preliminary data suggest a potential role of PD-1+ CD4+ T cells as mediators of ITP. We also found a correlation between PD-1+ CD4+ T cells and both platelet counts and IFN-γ levels. These findings suggest a potential role of PD-1+ CD4+ T cells and IFN-γ in the pathogenesis of ITP. Further studies investigating PD-1 expression in different T-cell subsets, serum IFN-γ concentrations, and antiplatelet antibodies levels over a longer duration after therapy initiation could delineate the precise role of PD-1 in ITP pathogenesis. Consequently, novel nontraditional therapeutic strategies for ITP patients may become available.
Key message
Question: What are the PD-1+ CD4+ T cells percentages and serum interferon gamma (IFN-γ) levels of pediatric patients with immune thrombocytopenia (ITP)?
Finding: Compared with healthy controls, the PD-1+ CD4+ T cells percentages and IFN-γ levels were significantly higher in ITP patients before and 1 month after therapy.
Meaning: Our findings suggest that PD-1+ CD4+ T cells and IFN-γ are involved in the pathophysiological process of ITP.
Graphical abstract.
ITP, immune thrombocytopenia; PD-1, programmed death-1; IFN-γ, interferon-γ; ELISA, enzymelinked immunosorbent assay...
Introduction
Immune thrombocytopenia (ITP) is a widespread autoimmune disease characterized by thrombocytopenia and bleeding diathesis. In ITP, the overall number of platelets is affected rather than their function. The incidence of ITP is nearly 50 to 100 cases per million per year, with children accounting for half of that number [1].
To select proper management decisions, ITP has been categorized by disease duration into newly diagnosed (within 3 months after diagnosis), persistent (between 3–12 months from diagnosis) includes patients who fail to achieve spontaneous remission or to maintain complete response off treatment, and chronic (more than 12 months) [2].
In a trial to elucidate the pathogenesis of ITP, Harrington et al. [3] discovered an antiplatelet factor in the plasma of patients with ITP which caused a rapid drop in the platelet count in volunteer subjects after infusing them with patients' plasma. These antiplatelet factors, were identified later as immunoglobulin G, might cause platelets destruction by either phagocytosis, or complement mediated lysis. However, these antibodies were reported in only 60%–70% of ITP patients so other pathological mechanisms might be involved in platelet destruction [4].
CD4+ T helper cells are required by B cells to properly develop into antibody-secreting plasma cells. As the presence of autoantibodies is a hallmark of ITP, the involvement of CD4+ T cells in the pathogenesis of ITP have been explored in many studies [5,6]. Some studies documented that some cytokines necessary for T helper cells functions (such as interferon gamma [IFN-γ]) were increased in ITP patients [7,8]. Kuwana et al. [9] provided evidence of the presence of auto reactive CD4+ T cells that targeted epitopes on GPIIb/IIIa.
Programmed cell death protein-1 (PD-1) is an immunoregulatory cell surface molecule that has been assigned as a protein of the Ig-superfamily. PD-1 expression is detected on variety of cells including T cells and pro-B cells [10]. PD-1 acts as a key immune checkpoint and prevents the development of autoimmunity by promoting apoptosis of antigen-specific T cells in lymph nodes and reducing apoptosis in regulatory T cells [11].
PD-1/PD-1 ligands (PD-Ls) pathway consists of the PD-1 receptor and its ligands PD-L1 and PD-L2. The PD-1/PD-Ls signaling pathway is broadly expressed and can suppress T-cell activation and cytokine production. The interplay between PD-1 and PD-L1 plays crucial role in maintaining self-tolerance and preventing autoimmune attack [12,13].
IFN-γ is an important cytokine with various roles in host defense and immune regulation, including antimicrobial activity, antiviral activity, and antitumor activity. T helper, cytotoxic T, and natural killer cells are the primary producers of IFN-γ. Disrupted secretion of IFN-γ has been resulted in an increase in autoimmune disorders [14].
In this study, we investigated the changes in PD1 expression on CD4+ lymphocytes and serum IFN-γ levels before and one month after treatment of pediatric patients with ITP.
Methods
1. Patients
This study included a total of 40 children with newly diagnosed ITP who were recruited from Hematology Unit of Pediatric Department, Menoufia University Hospitals during the period from July 2019 to August 2020. Meantime, 20 age and sex matched children were included as control group. They received physical examination at our Hematology Unit, and they were apparently healthy as confirmed by a complete blood count (CBC).
The patients were diagnosed and treated according to the American Society of Hematology's 2011 evidence-based practice guidelines for primary ITP [15].
Severe ITP describes patients with a platelet count <10×109/L and active bleeding, or with bleeding symptoms sufficient to require treatment or additional intervention, such as a dose increase or the use of another platelet-enhancing drug to relieve thrombocytopenia. Corticosteroid therapy is a first-line treatment for ITP. Corticosteroid-sensitive described patients with a platelet count no less than 30×109/L with at least a 2-fold increase compared with the baseline count and no bleeding after intervention. Patients were considered corticosteroid-resistant if they required additional treatment such as intravenous immune globulin (IVIG).
Patients were followed up 1 month after therapy initiation to assess their outcomes and to analyze the changes of PD-1+ CD4+ T cells percentages and IFN-γ levels.
2. Sampling
Blood samples were initially collected from patients prior to any treatments then at the end of the first month of therapy initiation. A venous blood sample (5 mL) was withdrawn from each individual under aseptic condition by a clean venipuncture and then dispensed into 2 tubes: 3 mL of blood was delivered into dipotassium ethylenediaminetetraacetic acid (K2-EDTA) vacutainer tubes for, CBC, blood film, and flow cytometry analysis. Two milliter of blood was delivered into plain tube, allowed to clot at room temperature before centrifugation for 10 minutes, and then the sera were separated and stored at -20℃ for IFN-γ analysis.
CBC was analyzed by Sysmex XN-1000 hematology analyzer (Sysmex Corp., Kobe, Japan), and examination of Leishman-stained peripheral smears were done within 2 hours of blood collection.
3. Flow cytometric analysis
Flow cytometry (FC) was performed within 4 hours of sample collection to detect the expression of PD1 on CD4+ lymphocytes. Fluorescein isothiocyanate (FITC) conjugated monoclonal mouse anti-human CD4 and phycoerythrin (PE) conjugated monoclonal mouse anti-human PD-1 were purchased from Beckman Coulter (Brea, CA, USA). Each blood sample (100 µL) was pipetted into round-bottom tube and incubated in the dark at room temperature for 20 minutes in the presence of 10-µL CD4 (FITC) and PD-1 (PE). The samples were then treated by 1 mL of red blood cells lysing solution and left for 5 minutes in the dark at room temperature. After that, centrifugation of samples was done at 2,000 rpm for 5 minutes, the supernatant was discarded, and samples were washed twice using 2 mL of phosphate buffered saline (PBS). Lastly, samples were suspended in 0.2 mL of PBS and analysis was performed using CytoFLEX flow cytometer (Beckman Coulter).
4. Enzyme-linked immunosorbent assay
Serum IFN-γ levels were determined by enzyme-linked immunosorbent assay (ELISA) kit (BOSTER, Pleasanton, CA, USA, Catalog No. EK0373). This ELISA kit had both intra-assay and interassay precision: CV% less than 8%.
5. Statistical analysis
Qualitative data were described using number and percent. Quantitative data were described using mean and standard deviation. In 2 groups’ comparison of normally and abnormally distributed quantitative variables, Student t test and Mann-Whitney U test were utilized, respectively. Spearman correlation was used to show correlation between 2 continuous not normally distributed data. Data were analyzed using IBM SPSS Statistics ver. 20.0 (IBM Co., Armonk, NY, USA) and P value less than 0.05 was considered significant.
6. Ethics approval
All procedures followed were in accordance with the ethical standards of the responsible committee on human experimentation (institutional and national) and with the Helsinki Declaration of 1975, as revised in 2008. Informed consent was obtained from all patients for being included in the study. The study approved by Menoufia Faculty of Medicine ethical committee IRB NO 82018/PEDI43.
Results
The demographic and laboratory data of the study groups were demonstrated in Table 1. The baseline platelet count for all patients was under 100×109/L.

Patients’ demographic and laboratory characteristics by study group
1. PD-1+ CD4+ T cells expression and IFN-γ concentration in patients and controls
FC analysis was performed to determine the percentages of PD-1+ CD4+ T cells. The percentages of PD-1+ CD4+ T cells in peripheral blood of ITP patients before and 1 month after treatment (6.31% ±4.92%, 4.81%±1.40%; respectively) were significantly higher than that in healthy controls (2.36%±0.72%) (P<0.001) (Fig. 1). Serum concentrations of IFN-γ in ITP patients before and 1 month after therapy (16.78±4.16 pg/mL, 9.04±5.32 pg/mL; respectively) were significantly increased in comparison with healthy subjects (5.49±1.17 pg/mL) (P<0.001, P=0.014) (Fig. 2).

Flow cytometry of PD-1+ CD4+ T lymphocytes (A) and percentage of PD- 1+ CD4+ T cells in patient and control groups (B). PD-1, programmed death-1; PE-A, phycoerythrin-A; Q1-UL, quadrant 1-upper left; Q1-UR, quadrant 1-upper right (Q1- UR); Q1-LL, quadrant 1-lower left; Q1-LR, quadrant 1- lower right; FITC-A, fluorescein isothiocyanate-A.
Serum interferon (IFN)-γ levels in patient and control groups.
2. Effect of treatment on platelet count, PD-1+ CD4+ T cells expression and IFN-γ concentration
Platelet count was significantly increased 1 month after therapy in comparison with baseline count (P<0.001). Platelet count in 27 patients was higher than 50×109/L, with a mean value of 112±70.1×10⁹/L. However, the platelet count in the remaining 13 patients was lower than 50×109/L, with a mean value of 28.2±10.4×10⁹/L.
Moreover, serum concentrations of IFN-γ in ITP patients after treatment was significantly lower than those before treatment (whether steroids or IVIG) (P<0.001) but no significant difference was observed between the percentage of PD-1 on CD4+ T cells before and one month after treatment (whether steroids or IVIG) (P=0.312) (Table 2).
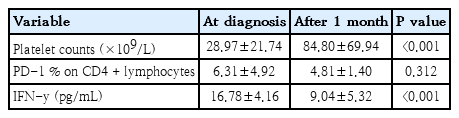
Platelet count, PD-1 expression, and IFN-γ level at diagnosis and after 1 month of treatment in the patient group (n=40)
3. Correlation between initial PD-1+ CD4+ T cells expression/IFN-γ concentration and baseline platelet count
Spearman correlation analysis showed that the percentage of PD-1+ CD4+ T cells was negatively correlated with baseline platelet count in ITP patients (r=-0.432, P=0.005) (Fig. 3). However, no correlation was detected between IFN-γ levels and platelets count (r=0.078, P=0.628) (Fig. 3).

Correlation between the percentage of PD-1+ CD4+ T cells and platelet count in ITP patients before treatment. ITP, immune thrombocytopenia; PD-1, programmed death-1.
4. Correlation between initial PD-1+ CD4+ T cells expression and IFN-γ concentration
A positive correlation was demonstrated between the percentages of PD-1+ CD4+ T cells and the serum concentrations of IFN-γ at diagnosis (r=0.358, P=0.023) (Fig. 4)

Correlation between the percentage of PD1+ CD4+ T cells and IFN-γ levels in ITP patients before treatment. IFN-γ, interferon-γ; ITP, immune thrombocytopenia; PD-1, programmed death-1.
Discussion
Primary ITP is an autoimmune disorder in which the platelets and megakaryocytes are the targets of a disrupted immune response [16]. Abnormal count and function of T cells have been reported in ITP patients such as increased antiplatelet T helper lymphocyte reactivity, and abnormal activation of Th1 cells. A non–antibody-mediated mechanism of ITP was suggested as only about two-thirds of ITP patients have detectable antiplatelet autoantibodies [4].
Activating and inhibitory receptors of T cells maintain the balance between immune response and immune tolerance. CD28 coreceptors on T cells provide costimulatory signals, whereas PD-1 coreceptors deliver coinhibitory signals when it interacts with its ligands, PD-L1 and PDL2. PD-1 acts as immune checkpoints to reduce autoimmune responses against self-antigens [17].
The balanced secretion of cytokines regulates the functions of immune system under physiological conditions. This balance is disturbed in various autoimmune diseases. Several studies demonstrated the role of serum cytokines in the pathogenesis of ITP and suggested helper T-lymphocytes polarization into Th1 and Th2 immune response. Th1 response is characterized by the release of cytokines including interferon-γ, interleukin-2, and tumor necrosis factor-α, whereas Th2 response produces various interleukins including IL-4, IL-5, IL-6, IL-10, and IL-13 [7,18,19].
In our study, we revealed the increased percentages of PD-1+ CD4+ T cells in peripheral blood of pediatric ITP patients before and after therapy in comparison with healthy controls. These results were similar to the findings of other studies, Wang et al. [20] reported that PD-1+ CD4+ T cells percentages in blood samples from ITP patients before therapy were significantly increased in comparison with healthy controls. Additionally, they demonstrated that the percentages of PD-1+ CD4+ T cells after therapy were not significantly different from those before therapy. Also, Wu et al. [21] demonstrated that peripheral blood PD-1+ CD3+ CD4+ T cells percentages in ITP patients before therapy initiation were significantly increased as compared to healthy controls.
PD-1 is mainly expressed on activated T and B cells or effector T and B cells. When PD-1 binds its legends, PD-1 immune checkpoint switches on and hinders immune-stimulatory signals and so prevents initiation of autoimmune destruction by PD-1+ effector cells [22]. However, in systemic lupus erythematosus and rheumatoid arthritis, the PD-1 checkpoint fails to prevent autoimmune damage [23,24]. Alternatively, PD-1+ cells infiltrate tissues, and this infiltration positively correlated with the progression of autoimmune diseases [25]. These findings suggest that PD-1+ cells are crucial mediators of autoimmune diseases. Consistent with this hypothesis, the blockade of the PD-1 checkpoints, which leads to the proliferation of PD-1+ cells, aggravates autoimmune disorders [26].
Our data also revealed that serum levels of IFN-γ in ITP patients before and after treatment were significantly increased in comparison with controls. Wang et al. [20] demonstrated a significant higher concentrations of serum IFN-γ in ITP patients before therapy as compared to healthy controls but IFN-γ concentrations after therapy were not different from those in healthy subjects. Elevated concentrations of IFN-γ in the blood may participate in the occurrence and development of ITP. Therefore, we believe that elevated soluble PD-1 (sPD-1) level in patients blocks PD-1/programmed death-ligand 1 (PD-L1) signaling pathway, leading to imbalance of immune regulation. After treatment, PD-1 level is decreased and the regulation by PD-1/PD-L1 signaling pathway is restored, leading to regulated immune imbalance, reduced concentrations of IFN-γ and IL-17, and decreased damage of platelets. The researchers believe that sPD-1 levels in ITP patients can be used as a predictor for the recurrence of ITP. In the meantime, sPD-L1 levels in newly diagnosed ITP patients are lower than those in patients with recurrent ITP [20]. The PD-1/PD-L1 pathway contributes to ITP through disrupting immune balance, which may present an innovative therapy for patients with ITP.
In this study, a negative correlation was noticed between the percentages of PD-1+ CD4+ T cells and platelet count while a positive correlation was found between the percentages of PD1+ CD4+ T cells and serum levels of IFN-γ in ITP patients before therapy. Therefore, the percentages of PD-1+ CD4+ T cells could be employed to estimate the severity of ITP
On the other hand, Wang et al. [20] reported that the percentage of PD-1+ CD4+ T cells was negatively correlated with platelet count but not correlated with serum levels of IFN-γ.
Many studies demonstrated the role of both IFN-γ and PD1 in the pathogenesis of various autoimmune disorders. For example, Dolff et al. [27] reported the enhanced and positively correlated expression of PD-1+ CD4+ T cells and IFN-γ in patients with systemic lupus erythematous, suggesting an important link between the increased production of IFN-γ and the upregulated expression of PD-1.
Moreover, we highlighted the changes in PD-1 percentages on CD4+ T cells and serum IFN-γ levels 1 month after starting therapy. Interestingly, serum levels of IFN-γ in ITP patients was significantly decreased after treatment but no significant difference was found between the percentage of PD-1+ CD4+ T cells before and after therapy initiation. These findings were comparable with other studies [20,21]. and suggesting the correlation between IFN-γ levels and disease activity.
In conclusion, our results showed that PD-1+ CD4+ T cells expression and IFN-γ levels were increased in patients with ITP. These preliminary data suggested the potential role of PD-1+ cells as mediators of ITP. We also found a correlation between PD-1+ CD4+ T cells and both of platelets count and IFN-γ. These findings suggested the potential role of PD-1+ CD4+ T cells and IFN-γ in the pathogenesis of ITP. Further studies investigating PD-1 expression on different T-cell subsets, serum IFN-γ concentrations and antiplatelet antibodies levels over longer duration following therapy initiation could delineate the precise role of PD1 in ITP pathogenesis. Consequently, novel nontraditional therapy strategies for ITP patients may become available.
Notes
Conflicts of interest
No potential conflict of interest relevant to this article was reported.
Funding
This study received no specific grant from any funding agency in the public, commercial, or not-for-profit sectors.
Author Contributions
Conceptualization: FME, MAE; Formal Analysis: MAE, EAAE; Investigation: AMFS; Methodology: AMFS; FME; Project Administration: FME; Writing – Original Draft: AMFS; EAAE; Writing – Review & Editing: FME; MAE