Evaluation of three glucometers for whole blood glucose measurements at the point of care in preterm or low-birth-weight infants
Article information
Abstract
Purpose
We evaluated three blood glucose self-monitoring for measuring whole blood glucose levels in preterm and low-birth-weight infants.
Methods
Between December 1, 2012 and March 31, 2013, 230 blood samples were collected from 50 newborns, who weighed, ≤2,300 g or were ≤36 weeks old, in the the neonatal intensive care unit of Eulji University Hospital. Three blood glucose self-monitoring (A: Precision Pcx, Abbott; B: One-Touch Verio, Johnson & Johnson; C: LifeScan SureStep Flexx, Johnson & Johnson) were used for the blood glucose measurements. The results were compared to those obtained using laboratory equipment (D: Advia chemical analyzer, Siemens Healthcare Diagnostics Inc.).
Results
The correlation coefficients between laboratory equipment and the three blood glucose self-monitoring (A, B, and C) were found to be 0.888, 0.884, and 0.900, respectively. For glucose levels≤60 mg/dL, the correlation coefficients were 0.674, 0.687, and 0.679, respectively. For glucose levels>60 mg/dL, the correlation coefficients were 0.822, 0.819, and 0.839, respectively. All correlation coefficients were statistically significant. And the values from the blood glucose self-monitoring were not significantly different from the value of the laboratory equipment , after correcting for each device's average value (P>0.05). When using laboratory equipment (blood glucose ≤60 mg/dL), each device had a sensitivity of 0.458, 0.604, and 0.688 and a specificity of 0.995, 0.989, and 0.989, respectively.
Conclusion
Significant difference is not found between three blood glucose self-monitoring and laboratory equipment. But correlation between the measured values from blood glucose self-monitoring and laboratory equipment is lower in preterm or low-birth-weight infants than adults.
Introduction
Hypoglycemia is one of the most common metabolic disorders in infants. Persistent hypoglycemia can cause abnormalities in neuronal development1234). The clinical signs of hypoglycemia in the neonate are not specific to alterations in glucose concentration. Furthermore, even asymptomatic hypoglycemia can be associated with such abnormalities1). The relative risk for neurologic complication is especially high in preterm or low birth-weight infants with various risk factors. Therefore, a rapid and accurate glucose test is needed for preterm or low birth-weight infants receiving treatment in the neonatal intensive care unit (NICU).
The portable glucometer was invented for use in adult diabetic patients with diabetes. As indicated by many studies, although the measured values in the normal to high glucose level range (hyperglycemia) are similar to those obtained in the laboratory, but the values in the low glucose level range (hypoglycemia) differ from those obtained in the laboratory. Therefore, it has been proposed that portable glucometers should be used as a selective test, and there is a need for reference values, based on which the results of laboratory equipment can be derived5). However, because it is difficult to draw blood from preterm or low birth-weight infants, the accuracy of portable glucometers in the NICU is important for rapid confirmative diagnosis and treatment.
In this study, we aimed to verify the efficacy of portable glucometers by comparing the values measured using portable glucometers (Precision Pcx, Abbott, Abbott Park, IL, USA; One-Touch Verio, Johnson & Johnson, New Brunswick, NJ, USA; and LifeScan SureStep Flexx, Johnson & Johnson) with those simultaneously measured using the Advia chemical analyzer (Siemens Healthcare Diagnostics Inc., Tarrytown, NY, USA) in the laboratory, in preterm or low-birth-weight infants.
Materials and methods
Between December 1, 2012 and March 31, 2013, blood was collected from preterm infants, who weighed ≤2,300 g or were aged ≤36 weeks, in the NICU of Eulji University Hospital. Considering the condition of these infants, we excluded the following infants: infants with a gestational age of ≤28 weeks; a birth weight of ≤1,000 g; or preterm infants with congenital diseases. In addition, infants whose mothers abused drugs during pregnancy or had chronic contagious diseases or severe anemia with hematocrit [Hct]<20% or polycythemia with hematocrit [Hct]>65% were also excluded. Blood was collected from a vein or artery and simultaneously analyzed by using portable glucometers. At the same time point, blood samples were also analyzed in the laboratory under sensitive conditions to minimize error due to possible time delays. All procedures were approved by the Institutional Review Board of the Eulji University Hospital (2012-10-009-001), and written consent for the study was obtained from the guardians of all study subjects.
Sex, birth weight, gestational period, delivery method, height, head circumference, and Apgar score of the infants was investigated. Blood was regularly collected 1 week after the infants were admitted to the neonatal ward, and was assessed using three different glucometers; furthermore, the differences in the measurement were analyzed. Glucometers used in the analysis were as follows: Precision Pcx (A); One-Touch Verio (B); and LifeScan SureStepFlexx (C). The measurement values of the three glucometers were compared with the values obtained from the Advia chemical analyzer (D) in the ward laboratory as the standard.
IBM SPSS Statistics ver. 22.0 (IBM Co., Armonk, NY, USA) and Windows Excel packages were used for statistical analysis. The testing methods were compared by using the correlation coefficient, and the statistical significance was obtained using Pearson correlation analysis. We considered that the variables were significantly correlated if P<0.05 (in case this value was 0.000, it was presented as <0.001). Furthermore, if the absolute value of correlation coefficient was >0.5, we considered as favorable correlation. We compared the measurement values off each glucometer with the results obtained from the laboratory equipment by the paired t test, using the difference in the average values between variables. A significant difference was considered to be present if the significance probability was <0.05. Finally, the sensitivity and specificity of each glucometer (A, B, and C) was analyzed in cases where if the glucose level obtained from the laboratory equipment was ≤60 mg/dL.
Results
1. Characteristics of the patients
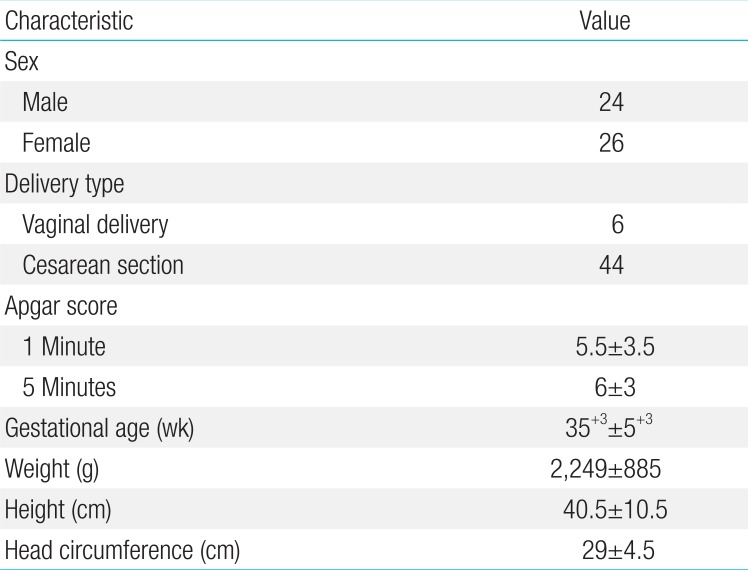
A total of 230 blood samples were collected from 50 infants. Among these patients, 24 were boys and 26 were girls. Forty-four of the infants were delivered via Cesarean section, while six were born via natural delivery. The gestational period of the infants ranged from 30 weeks to 40 weeks and 5 days (median, 35 weeks and 3 days). The body weight at birth ranged from 1,360 g to 3,130 g (median, 2,249 g). The length at birth ranged from 30 to 51 cm (median, 40.5 cm). The head circumference at birth ranged from 24.5 to 33.5 cm (median, 29 cm) (Table 1).

Patient demographics (n=50)
2. Correlation coefficient and significance probability analysis by using the Pearson correlation analysis
When the glucose test results of 230 collected blood samples were compared with the results from the standard test method (D; Advia chemical analyzer), the correlation coefficient between method (D) and test method (A) was 0.888 and the significance probability was 0.001; thus, no significant difference was observed (Fig. 1A). The correlation coefficient with test method (B) was 0.884 and the significance probability was 0.001 (Fig. 1B), while the correlation coefficient with test method (C) was 0.900 and the significance probability was 0.001; therefore, no significant difference was observed in these cases (Fig. 1C, Table 2).
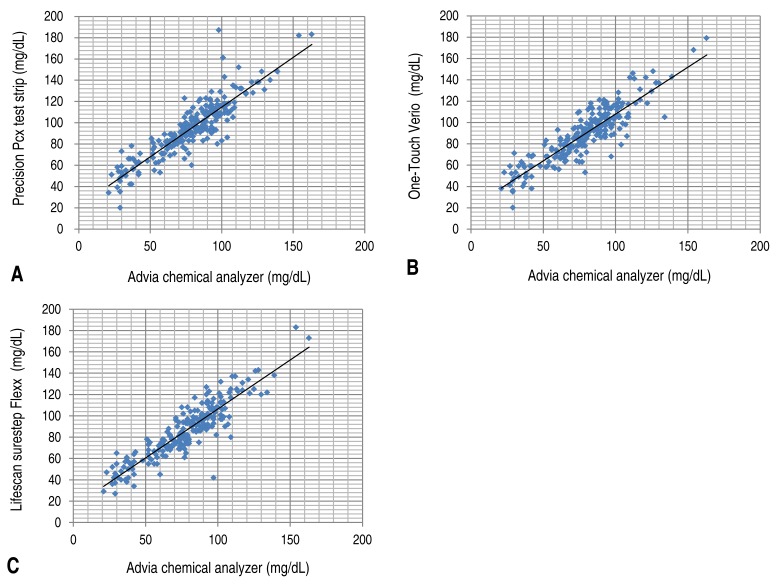
Comparison of the glucose levels measured using the Advia chemical analyzer and those measured using the other glucometers. (A) Comparison of the blood glucose levels obtained using the Precision Pcx glucometer (r=0.888, P=0.001). (B) Comparison of the blood glucose levels obtained using the One-Touch Verio glucometer (r=0.884, P=0.001). (C) Comparison of the blood glucose levels obtained using the LifeScan SureStep Flexx glucometer (r=0.900, P=0.001).

Patients' blood glucose levels (n=230)
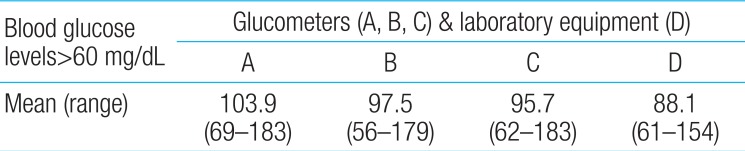
The correlation coefficient and the significance probability were analyzed among the test methods when the glucose level from test method (D) was ≤60 mg/dL. Among 230 samples, 48 samples had a glucose level of ≤60 mg/dL (Table 3). The correlation coefficient with test method (A) was 0.674, and the significance probability was 0.001 (Fig. 2A). The correlation coefficient with test method (B) was 0.687, and the significance probability was 0.001 (Fig. 2B). The correlation coefficient with test method (C) was 0.679, and the significance probability was 0.001 (Fig. 2C). The correlation coefficient among all test methods was >0.6. A correlation was observed with test method (D), and no statistically significant difference were at significance probability of <0.05.

The mean (range) for blood glucose levels ≤60 mg/dL (n=48)

Comparison of the glucose levels (≤60 mg/dL) measured using the Advia chemical analyzer and those measured using the other glucometers. (A) Comparison of the blood glucose levels obtained using the Precision Pcx glucometer (r=0.674, P=0.001). (B) Comparison of the blood glucose levels obtained using the One-Touch Verio glucometer (r=0.687, P=0.001). (C) Comparison of the blood glucose levels obtained using the LifeScan SureStep Flexx (r=0.679, P=0.001).
Furthermore, the correlation among different test methods was analyzed when the blood glucose level was found to be >60 mg/dL by the standard test method (D). Among 230 samples, 182 samples had a glucose level of >60 mg/dL (Table 4). The correlation coefficient with test method (A) was 0.822, and the significance probability was 0.001 (Fig. 3A). The correlation coefficient with test method (B) was 0.819, and the significance probability was 0.001 (Fig. 3B). The correlation coefficient with test method (C) was 0.839, and the significance probability was 0.001 (Fig. 2C). Therefore, no significant differences were observed (Fig. 3C).

The mean (range) for blood glucose levels >60 mg/dL (n=182)
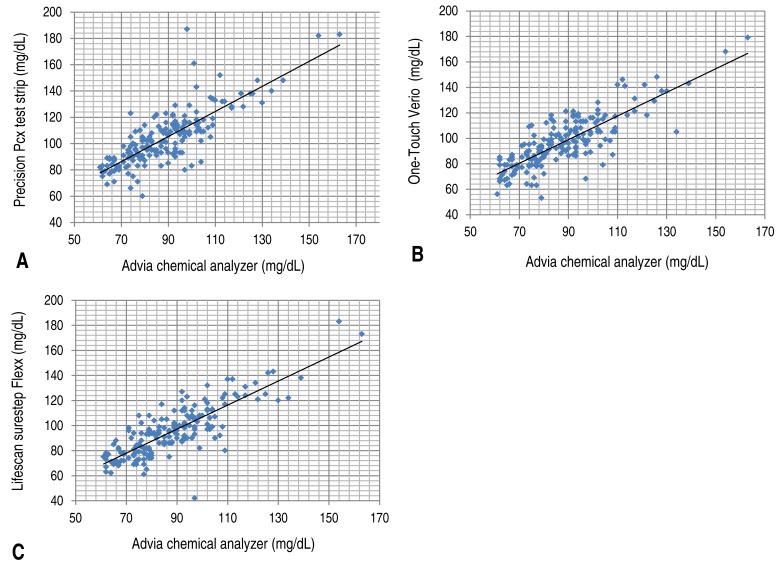
Comparison of the glucose levels (>60 mg/dL) measured using the Advia chemical analyzer and those measured using the other glucometers. (A) Comparison of the blood glucose levels obtained using the Precision Pcx glucometer (r=0.822, P=0.001). (B) Comparison of the blood glucose levels obtained using the One-Touch Verio glucometer (r=0.819, P=0.001). (C) Comparison of the blood glucose levels obtained using the LifeScan SureStep Flexx glucometer (r=0.839, P=0.001).
3. Differences in values obtained from portable glucometers and laboratory equipment
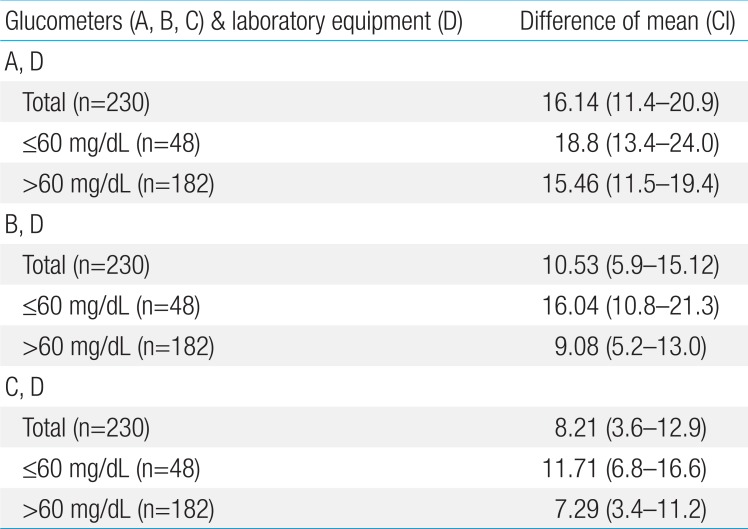
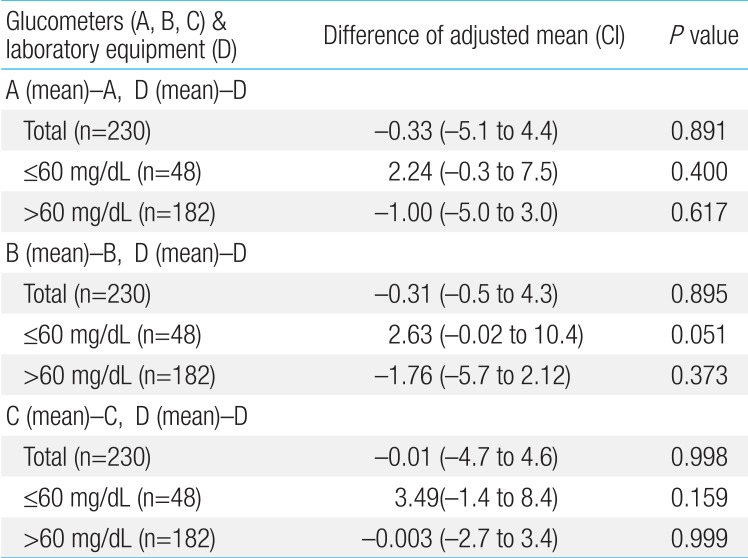
We assessed the differences in the average values obtained from portable glucometers and laboratory equipment by using the paired t test. All the glucometers (A, B, and C) used in this study had a P value of 0.001, and the values measured with these glucometers were significantly different from the average measured value of the laboratory equipment (Table 5). To adjust difference between machines, where the corrected values were obtained by substracting the resulting value from the mean value of each machine. Then, the P value for each glucometer (A, B, and C) was >0.05, and no statistical difference was observed (Table 6).

A statistical comparison (paired t test) of the difference in the mean values obtained using the potable glucometers and the laboratory equipment

Results of the paired t test after correcting for the mean values of each glucometer
4. Sensitivity and specificity of glucometers for glucose levels ≤60 mg/dL, as measured by laboratory equipment
We assessed the sensitivity and specificity of each glucometer (A, B, and C) in cases where the glucose levels were ≤60 mg/dL as per laboratory equipment measurements.
When the blood glucose level in the standard test method (D) was ≤60 mg/dL, the sensitivity of each glucometer (A, B, and C) was 0.458, 0.604, and 0.688, respectively. In addition, the specificity was observed to be 0.995, 0.989, and 0.989, respectively.
Discussion
In this study a significant difference was not found between three portable glucometers and laboratory equipment, respectively. But the correlation between the measured values from glucometers and laboratory equipment is lower in preterm or low-birth-weight infants than in adults; this difference is even greater under hypoglycemic conditions.
The laboratory equipment in most hospitals measures the blood glucose level by either the most verified hexokinase method or oxidase method. The principle of the hexokinase method is that hexokinase generates glucose-6-phosphate from adenosine triphosphate and glucose, which then transforms to 6-phosphogluconate via glucose-6-phosphate dehydrogenase. At this time, nicotinamide adenine dinucleotide phospate transforms to NADPH, which absorbs light at 340 nm. This method measures the blood glucose through the change in the absorbance, based on the increasing levels of NADPH. The hexokinase method is highly specific for glucose, and it is generally accepted as the standard method for blood glucose measurement. This method is used as the standard method for blood glucose measurement6) because it is influenced to a less extent by other materials, and has the best accuracy, test time, and precision within the test7). In the glucose oxidase method, glucose oxidase induces the generation of gluconic acid and hydrogen peroxide from glucose. The pigment-producing ortho-dianisidine reacts with hydrogen peroxide in the presence of peroxidase to generate color, which then reflects the blood glucose level. An example of this method is the reflectance intensity method, which measures the results of pigment reaction via the light intensity reflected from the reagent pad. The other measurement methods include the modified glucose oxidase method and the glucose dehydrogenase method. The modified glucose oxidase method uses a polarographic oxygen electrode, and measures blood glucose levels by measuring the oxygen consumption rate after a sample is added to a solution containing glucose oxidase. The glucose dehydrogenase method measures the blood glucose level via the generation of the colorimetric substance NADH, when glucose dehydrogenase oxidizes glucose to gluconolactone. The electrochemical electrode method used in portable glucometers is an example of this method89) (Fig. 4).
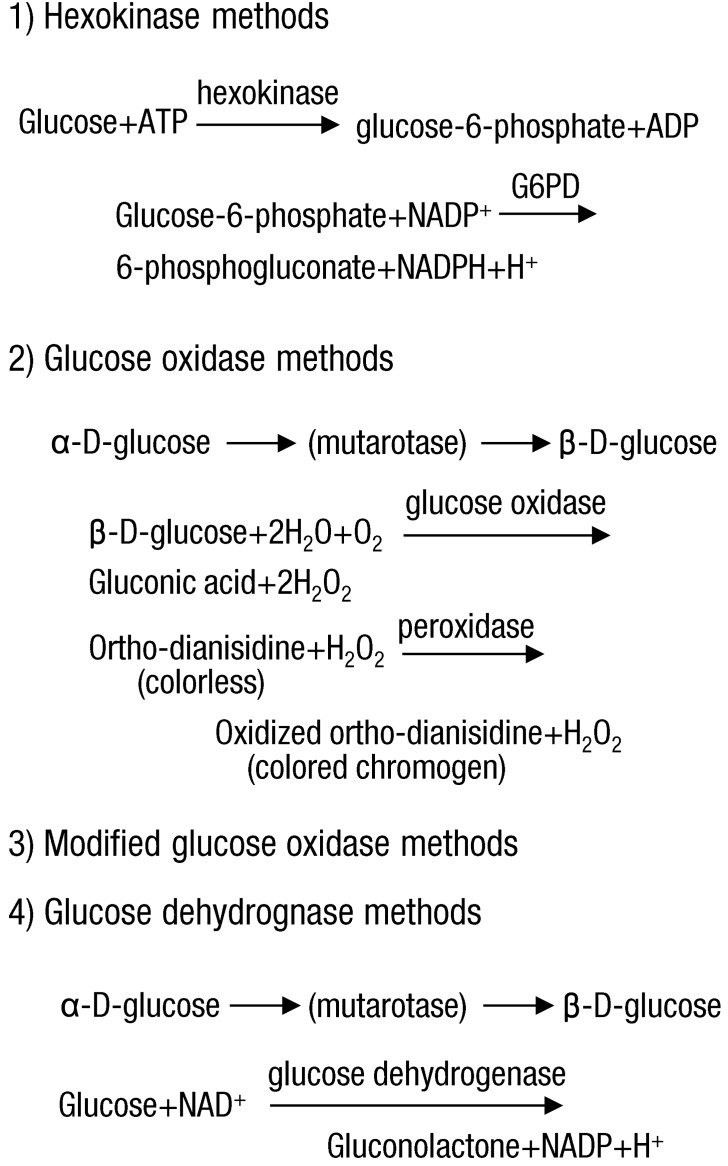
The four types of methods used to measure blood glucose.
The Precision Pcx (A) and the One-Touch Verio (B) used in this study measures blood glucose levels by using the electrochemical electrode method with the same enzyme (glucose dehydrogenase). However, (A) uses nicotinamide adenine dinucleotide as the substrate and (B) uses flavin adenine dinucleotide as the substrate. Thus, there is a possibility of differences in the results owing to differences in the substrate. Another portable glucometer, the LifeScan SureStep Flexx (C), measures the blood glucose by using the reflectance intensity measurement method.
The resulting values from these three portable glucometers were correlated with the value from the laboratory equipment (D), and no significant difference was observed. However, when all samples were used as the target, or when the blood glucose level measured by the laboratory equipment was >60 mg/dL, the correlation coefficient between the value of each portable glucometer and that of the laboratory equipment was >0.8. When the blood glucose levels were ≤60 mg/dL, the correlation coefficient of (A), (B), and (C) was 0.674, 0.687, and 0.679, respectively. As the standard value for determining correlation was set at 0.5, a correlation was considered to exist even when the blood glucose level was ≤60 mg/dL. However, this result was weaker compared to that obtained when all samples were used as the target or when the blood glucose level measured by the laboratory equipment was >60 mg/dL. Furthermore, in the report by Woo et al.10), where the blood glucose values obtained by a portable glucometer using the electrochemical electrode method or the hexokinase method were compared, the authors observed a much higher level of correlation than that observed in the present study, with a correlation coefficient of 0.987. This suggests that when comparing preterm infants or low birth-weight infants to adults, the measurement values of portable glucometers have a lower level of correlation with the measurement results of laboratory equipment; the difference is even larger under conditions of hypoglycemia. These study results are similar to the results obtained in several previous studies3511).
By using another statistical method (paired t test) the blood glucose level from each portable glucometer was compared to the blood glucose level obtained by using the laboratory equipment. While the results from all portable glucometers used in the study showed a statistically significant difference when compared to the average value obtained by using laboratory equipment (Table 5), the significant difference disappeared after correcting for the average value of each device to minimize for device-specific differences (Table 6).
When analyzing the statistical data, the values of portable glucometers in preterm infants or low birth-weight infants seem to require an individual analysis by comparing with value obtained by using laboratory equipment as the standard. In particular, when the blood glucose level is ≤60 mg/dL, special caution is needed since the correlation is too poor for determining blood glucose levels accurately by using only a portable glucometer.
When the blood glucose level of the laboratory equipment is ≤60 mg/dL, the sensitivity of the three glucometers (A, B, and C) was 0.4583, 0.6041, and 0.6875, respectively, and the specificity was 0.9945, 0.9890, and 0.9890, respectively. We confirmed that the sensitivity of the three glucometers is lower than the specificity of the three glucometers.
In 1994, the American Diabetic Association (ADA) that in the 30-400 mg/dL blood glucose range, the glucometer should exhibit <10% of a difference from the plasma glucose concentration12). In addition, in 1994, the Committee for Clinical Laboratory Standards (NCCLS) also recommended that the difference should not exceed 15 mg/dL when the blood glucose level is <100 mg/dL13). In the present study, when we estimated the average value for each method, the results of portable glucometers (A, B, and C) were consistent with the NCCLS recommended standards for glucose levels exceeding 60 mg/dL (Table 4). However, the results were not consistent with the NCCLS standard when total blood glucose was used as the target or when a blood glucose level of ≤60 mg/dL was used (Tables 2, 3). When the blood glucose level exceeded 60 mg/dL, only portable devices B and C met the ADA standard (Table 4). Therefore, caution is needed when determining the state of hypoglycemic preterm infants or low birth-weight infants when using only a portable glucometer.
When proper treatment for hypoglycemia is not administered, neuronal and glial cells are damaged, which can lead to severe defects or death14). Even asymptomatic hypoglycemia can damage the brain tissues and cause complications115). In infants with a blood glucose level of <47 mg/dL for >5 days, the Bayley developmental index measured 18 months after birth was reportedly lower and the risk of neurodevelopmental defect was higher14). Kliegman and Wald16) emphasized on maintaining the serum glucose level of infants at >40 mg/dL, and the Korean Society of Neonatology recommends maintaining the serum glucose level of infants >50 mg/dL. A portable glucometer can be useful as it requires only a small amount of blood and the test result can be obtained instantly. While a portable glucometer is easy to use because the measurement is simple, its measurement results can be influenced by several factors, such as: up to 50% variation among users, severe hypoglycemia (≤60 mg/dL) or hyperglycemia (>500 mg/dL), hematocrit, altitude, temperature and humidity, hypotension, oxygen pressure, and hypertriglyceridemia. In addition, it can also be influenced by fluorescein1718). To minimize these variations in this study and the resulting influence on the measurement results, we limited the examiners to two people who received proper training, and samples with severe anemia (Hct<20%) or polycythemia (Hct>65%) were excluded. Generally, portable glucometer measure blood glucose with capillary blood. But we could not be measured in the four kinds of equipment at the same time on a small amount of capillary blood. So we used arterial blood or venous blood as a specimen.
Although samples from the vein, artery, or capillaries could be used for devices (A), (C), and (D), samples drawn from capillaries were recommended for (B). While no large sources of error were expected to have occurred because the same samples were used for the tests by all devices, thus should be carefully considered in a further study.
In conclusion, while the current results comparing portable glucometers and the result of the laboratory equipment showed a statistically significant correlationin preterm or low birth-weight infants, the correlation weakened when the blood glucose level was ≤60 mg/dL and a difference among devices was observed. We assumed that differences in the results due to differences of measuring methods and the substrates. Therefore, in preterm infants or low birth-weight infants with a risk of hypoglycemia, caution is needed when monitoring blood glucose with a portable glucometer. In addition, further studies are needed to reduce the differences between currently used several point-of-care monitoring glucometers and laboratory equipment for measuring blood glucose levels in preterm or low birth-weight infants.
Notes
Conflict of interest: No potential conflict of interest relevant to this article was reported.