The association of blood pressure with body mass index and waist circumference in normal weight and overweight adolescents
Article information
Abstract
Purpose
Overweight can be defined by the body mass index (BMI) and is likely associated with an increased cardiovascular disease risk. However, waist circumference (WC), a central adiposity index, may be a better indicator of cardiovascular disease risk. Studies comparing the effects of BMI and WC on cardiovascular risk factors, such as high blood pressure (BP), are rare in adolescents.
Methods
We analyzed the correlations of BMI and WC with BP in 3,363 Korean adolescents (aged 10-19 years), using data from the Korean National Health and Nutrition Examination Surveys (2009-2011).
Results
Systolic BP (SBP) in both sexes and diastolic BP (DBP) in boys were higher in the high BMI (>85th percentile) and high WC (>90th percentile) groups. High BMI and high WC were positively correlated with high SBP (>90th percentile) in both sexes, and high DBP (>90th percentile), in boys. BMI maintained its positive associations with SBP, DBP, high SBP, and high DBP in the normal weight (BMI≤85th percentile) and overweight (BMI>85th percentile) groups in both boys and girls, as well as in all subjects of both sexes, even after adjustment for WC. However, WC did not correlate with SBP, DBP, high SBP, or high DBP after adjustment for BMI in any group in either sex.
Conclusion
In Korean adolescents, BMI correlated better with BP and high BP levels than WC. Further, BMI was positively associated with BP and high BP in the normal weight group as well as in the overweight group.
Introduction
Obesity in childhood has been shown to develop into adulthood obesity1), and hence, it may increase the risk of cardiovascular disease (CVD) later in life2,3,4). Moreover, even in youth, obesity is closely associated with high blood pressure (BP)5,6) that is known to be an important risk factor for CVD. Thus, the prevention of obesity in childhood may be important in reducing the risk of CVD later in life.
Body mass index (BMI) and waist circumference (WC) are commonly used indices to assess obesity. Most previous studies have reported that BMI and WC are positively correlated with BP in children and adolescents7,8,9). Considering that adiposity and fat distribution may be more strongly associated with CVD than simple body mass, and that WC reflects central adiposity, WC can be suggested to be a better indicator of CVD risk such as high BP, than BMI, which reflects both lean and fat mass10). However, whether WC measured in childhood correlates better with high BP than BMI is still unresolved6,11). In addition, there is little data regarding the correlations of BMI and WC with BP in nonobese and obese adolescents.
In the present study, we examined the associations between BP, BMI, and WC in Korean adolescents using data from the Korean National Health and Nutrition Examination Survey (KNHANES). We analyzed these relationships both in normal weight and overweight groups as well as in all subjects.
Materials and methods
1. Data
We analyzed data from the KNHANES for the years 2009-201112). The KNHANES is a nationally representative cross-sectional survey that collects health- and nutrition-related data annually from stratified, multistage probability samples of Korean households representing the civilian, noninstitutionalized population. The KNHANES consists of a health interview survey, health behavior survey, health examination survey, and nutrition survey. Details of the survey design and measurement procedures are documented elsewhere (http://knhanes.cdc.go.kr/)12). Data from the KNHANES are publicly available from the Korean Center for Disease Control and Prevention12). A total of 3,363 adolescents aged 10-19 years (1,757 boys and 1,606 girls), who completed both anthropometric and BP measurements were included in this analysis. The institutional review board of Inje University Sanggye Paik Hospital approved this study.
2. Anthropometry and obesity measurements
Height was measured in the standing position to the nearest 0.1 cm using a stadiometer. Body weight was measured to the nearest 0.1 kg using a calibrated balance-beam scale, with the subjects wearing a lightweight gown or underwear. WC was measured to the nearest 0.1 cm at the midpoint between the bottom of the rib cage and the top of the lateral border of the iliac crest, with minimal respiration. BMI was calculated using the formula: BMI=weight (kg)/height (m)2. The Korean Center for Disease Control and Prevention (CDC) reference data were used in the determination of the sex- and age-specific percentile cutoffs for BMI and WC13). We defined the 85th percentile for BMI as the cutoff for "high BMI" and "overweight" and the 90th percentile for WC as the cutoff for "high WC."
3. BP measurement
BP was measured after 5 m of quiet rest using a mercury sphygmomanometer and appropriately sized cuff with the subjects seated and the right arm positioned at the level of the heart. Trained healthcare personnel (nurses and technicians) measured BP using the same instruments (Baumanometer sphygmomanometer, W.A. Baum Co., New York, NY, USA) in all surveys. BP was measured 3 times in each subject, and the mean systolic BP (SBP) and diastolic BP (DBP) was calculated as the average of the second and third readings. We determined the gender, age, and height-specific percentile cutoffs for BP using the Korean CDC reference tables13). The 90th percentile for SBP and DBP were defined as the cutoff for "high SBP" and "high DBP," respectively.
4. Statistical analysis
SPSS ver. 12.0.1 (SPSS Inc., Chicago, IL, USA) was used for statistical analyses. Analyses were performed separately for boys and girls, because of the known influence of sex on body size and BP. Additionally, we conducted analyses separately in normal and overweight groups as well as in both boys and girls. We compared BP (SBP and DBP) in the normal and high BMI groups and the normal and high WC groups using analysis of covariance adjusted for age and height. Multivariate logistic regression analysis was used to estimate the age- and height-adjusted odds ratios with 95% confidence intervals between high BP (high SBP and high DBP) and high BMI and high WC. The partial correlations of BMI and WC with BP (SBP and DBP) and high BP (high SBP and high DBP) were analyzed.
We used various sets of adjustments in the partial correlation analyses: M1 represented an adjustment for age and height; M2 represented an adjustment for WC in addition to M1; and M3 was an adjustment for BMI in addition to M1. Two-tailed P values <0.05 indicated statistical significance.
Results
1. Characteristics of subjects
The characteristics of the subjects are shown in Table 1. The total sample for the present study consisted of 3,363 adolescents aged 10-19 years (1,757 boys and 1,606 girls). Height, weight, BMI, and WC were greater in boys than in girls. Boys had higher SBP and DBP than girls in the normal weight and overweight groups as well as in the normal and overweight groups combined.
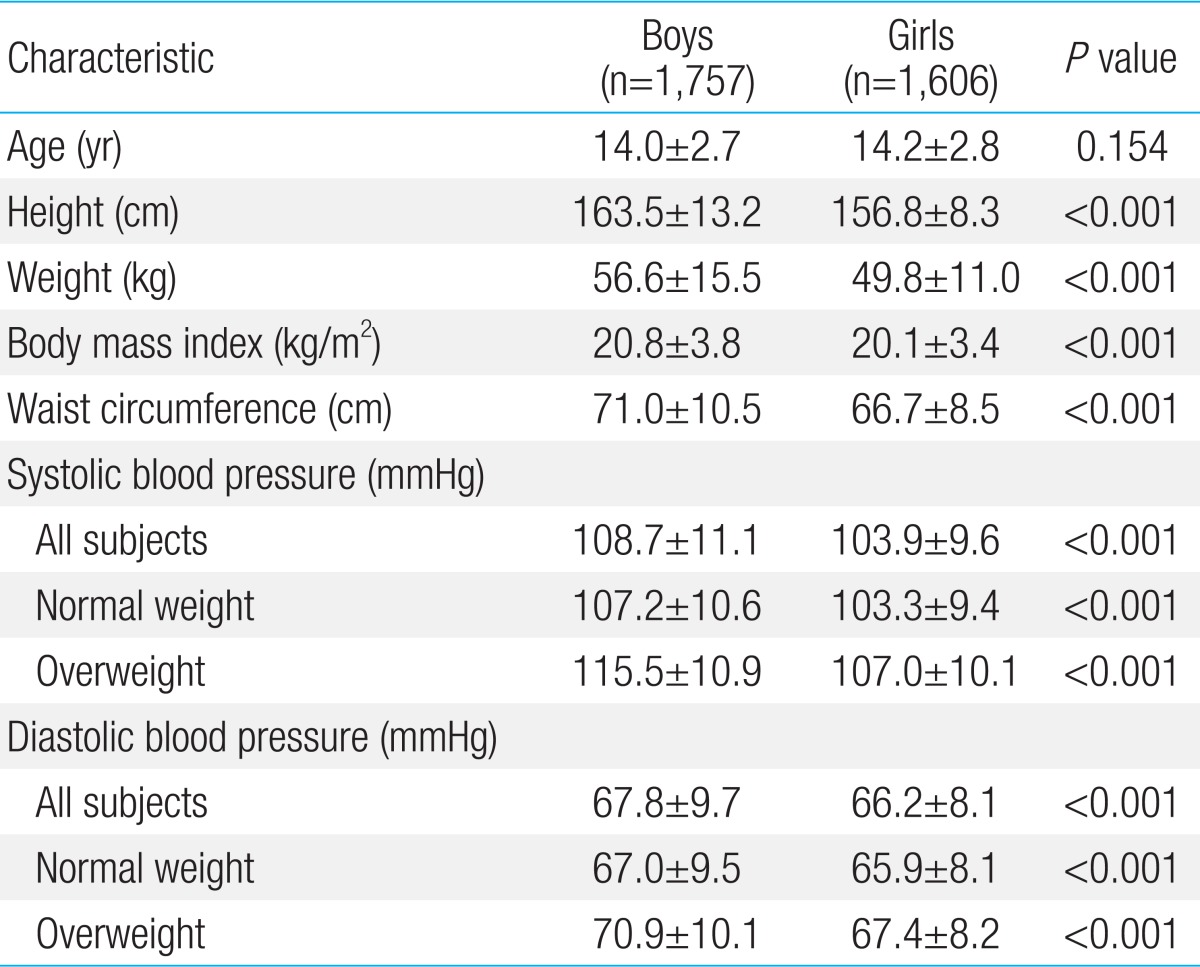
Characteristics of the study participants
2. Correlations of high BMI and high WC with BP
Using age- and height-adjusted analyses (Table 2), SBP was found to be higher in both boys and girls in the high BMI (>85th percentile) and high WC (>90th percentile) groups. High BMI and high WC significantly increased the incidence of high SBP (>90th percentile) in both sexes. The high BMI and high WC groups had higher DBP, and high BMI and high WC were associated with higher odds of high DBP in boys. In girls, neither high BMI nor high WC had an association with DBP or high DBP.

Correlation of blood pressure with high body mass index and high waist circumference, adjusted for age and height
3. Correlation of BMI and WC with BP in the various groups
We analyzed the correlation of BMI and WC with BP and high BP separately in the normal weight (BMI≤85th percentile) and overweight (BMI>85th percentile) groups as well as in all subjects. Age- and height-adjusted models were used for all these analyses, because there are known effects of age and height on BP.
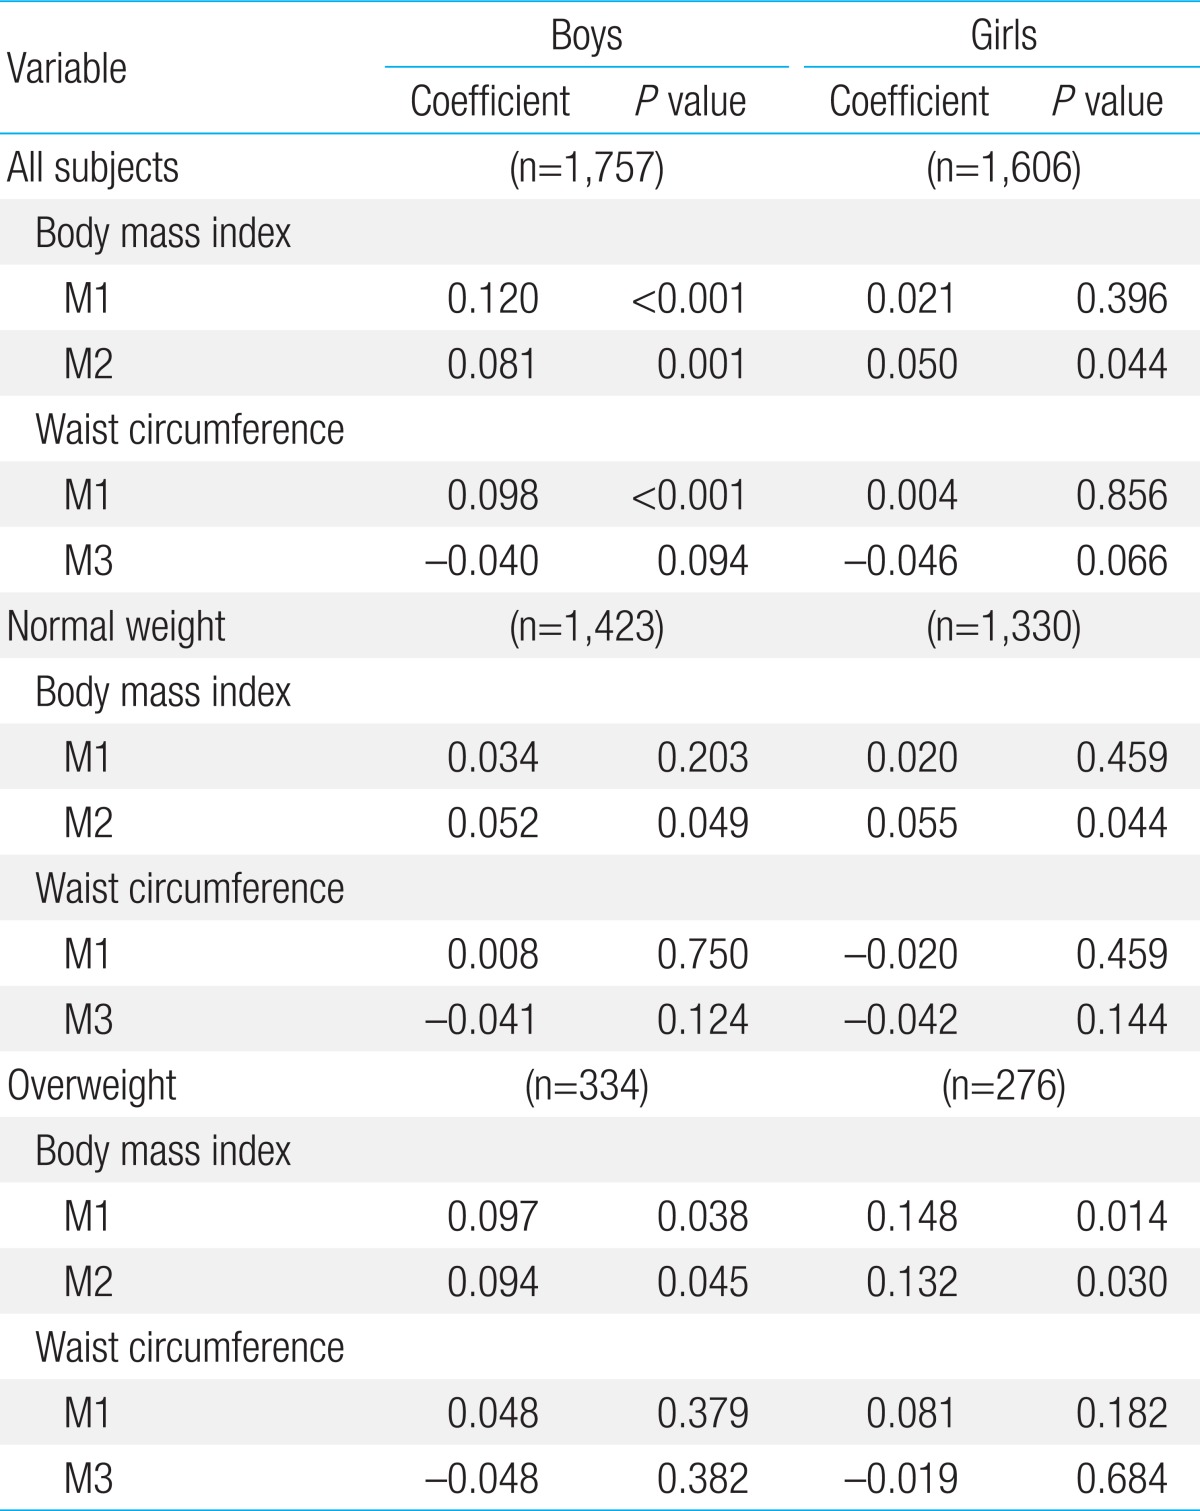
BMI correlated positively with SBP in the normal weight and overweight groups in both sexes as well as in all subjects of both sexes (Table 3). With an additional adjustment for WC, the positive association between BMI and SBP was still present in all groups in both sexes. WC was positively associated with SBP in all subjects of both genders and in the normal weight and overweight groups in both boys and girls (Table 3). When BMI was also adjusted for, WC lost its positive association with SBP in all the groups in both genders.
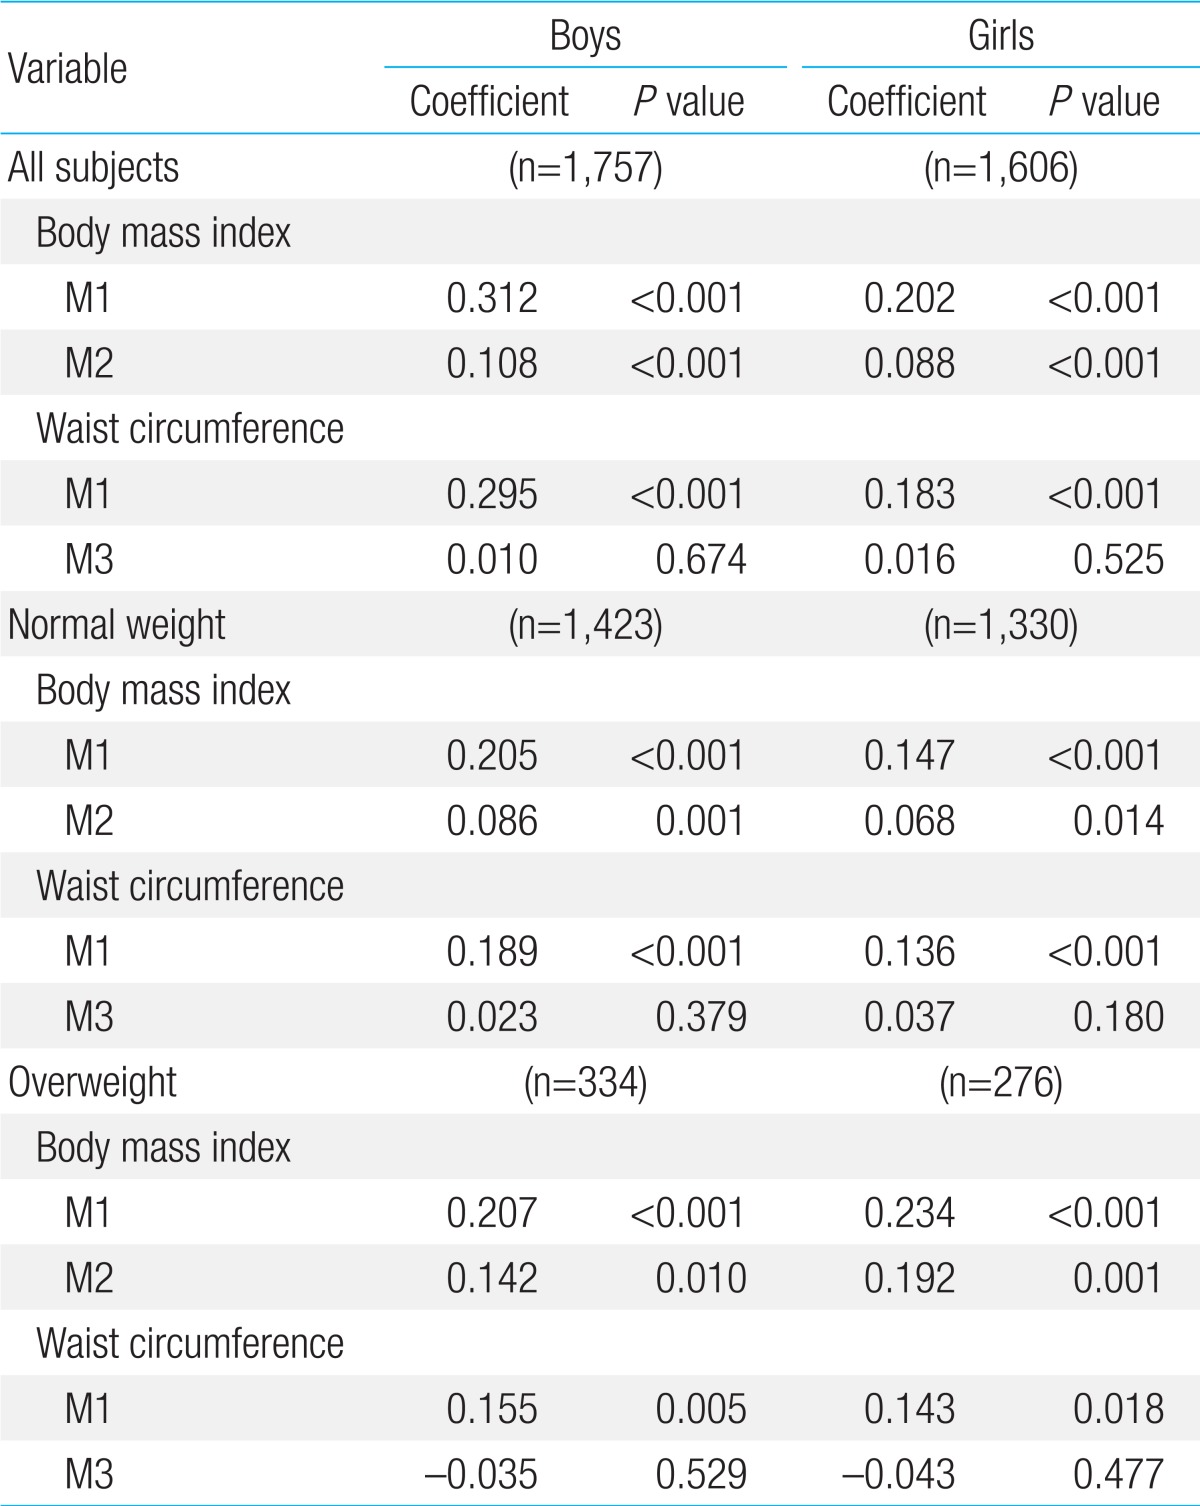
Correlation of systolic blood pressure with body mass index and waist circumference in all subjects and in the normal weight and overweight groups
BMI was positively correlated with high SBP in the normal weight and overweight groups in both sexes as well as in all subjects of boys and girls (Table 4). After further adjusting for WC, BMI was still positively associated with high SBP in all groups in both sexes. A positive association between WC and high SBP was observed in all subjects of both sexes and in the normal weight group in both genders (Table 4). After an additional adjustment for BMI, this positive correlation between WC and high SBP disappeared in all those groups.
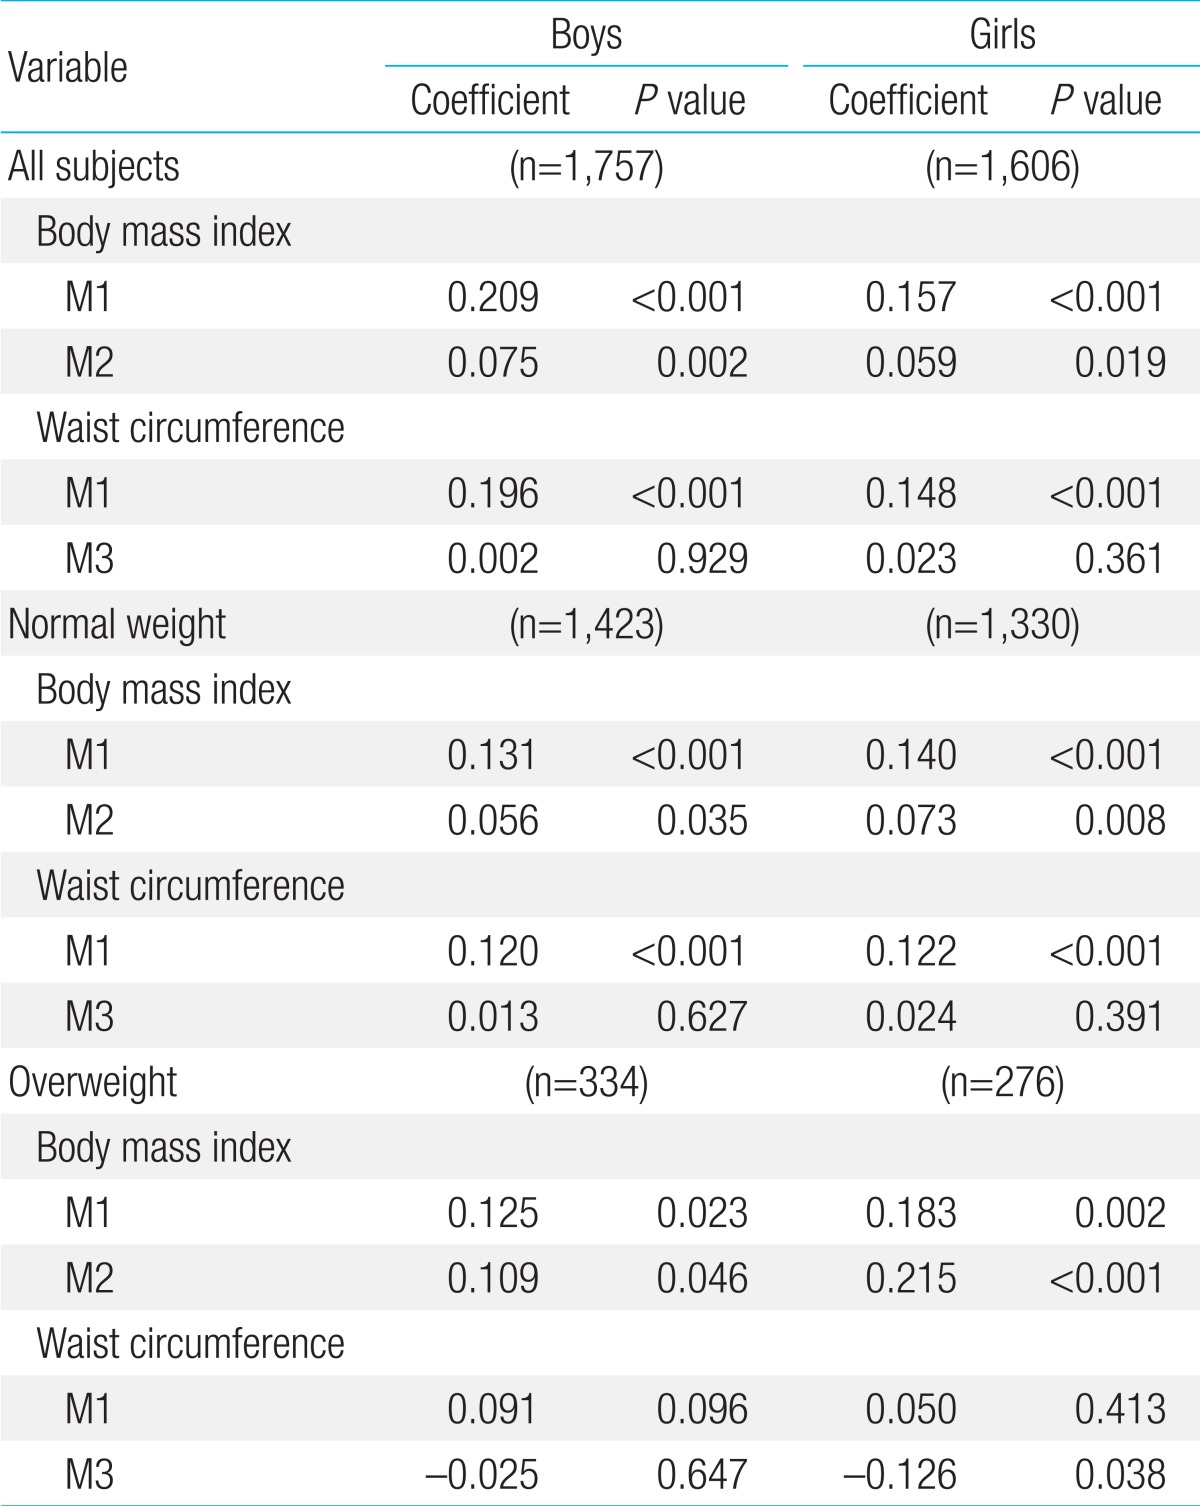
Correlation of high systolic blood pressure (>90th percentile) with body mass index and waist circumference in all subjects and in the normal weight and overweight groups
BMI had a positive effect on DBP in all subjects of boys and in the overweight group in both sexes (Table 5). After further adjusting for WC, BMI was positively associated with DBP in all subjects of both sexes and in the normal weight and overweight groups in both boys and girls. WC was positively correlated with DBP only in all boys (Table 5). After further adjustment for BMI, a negative association between WC and DBP was observed in all groups in both sexes.
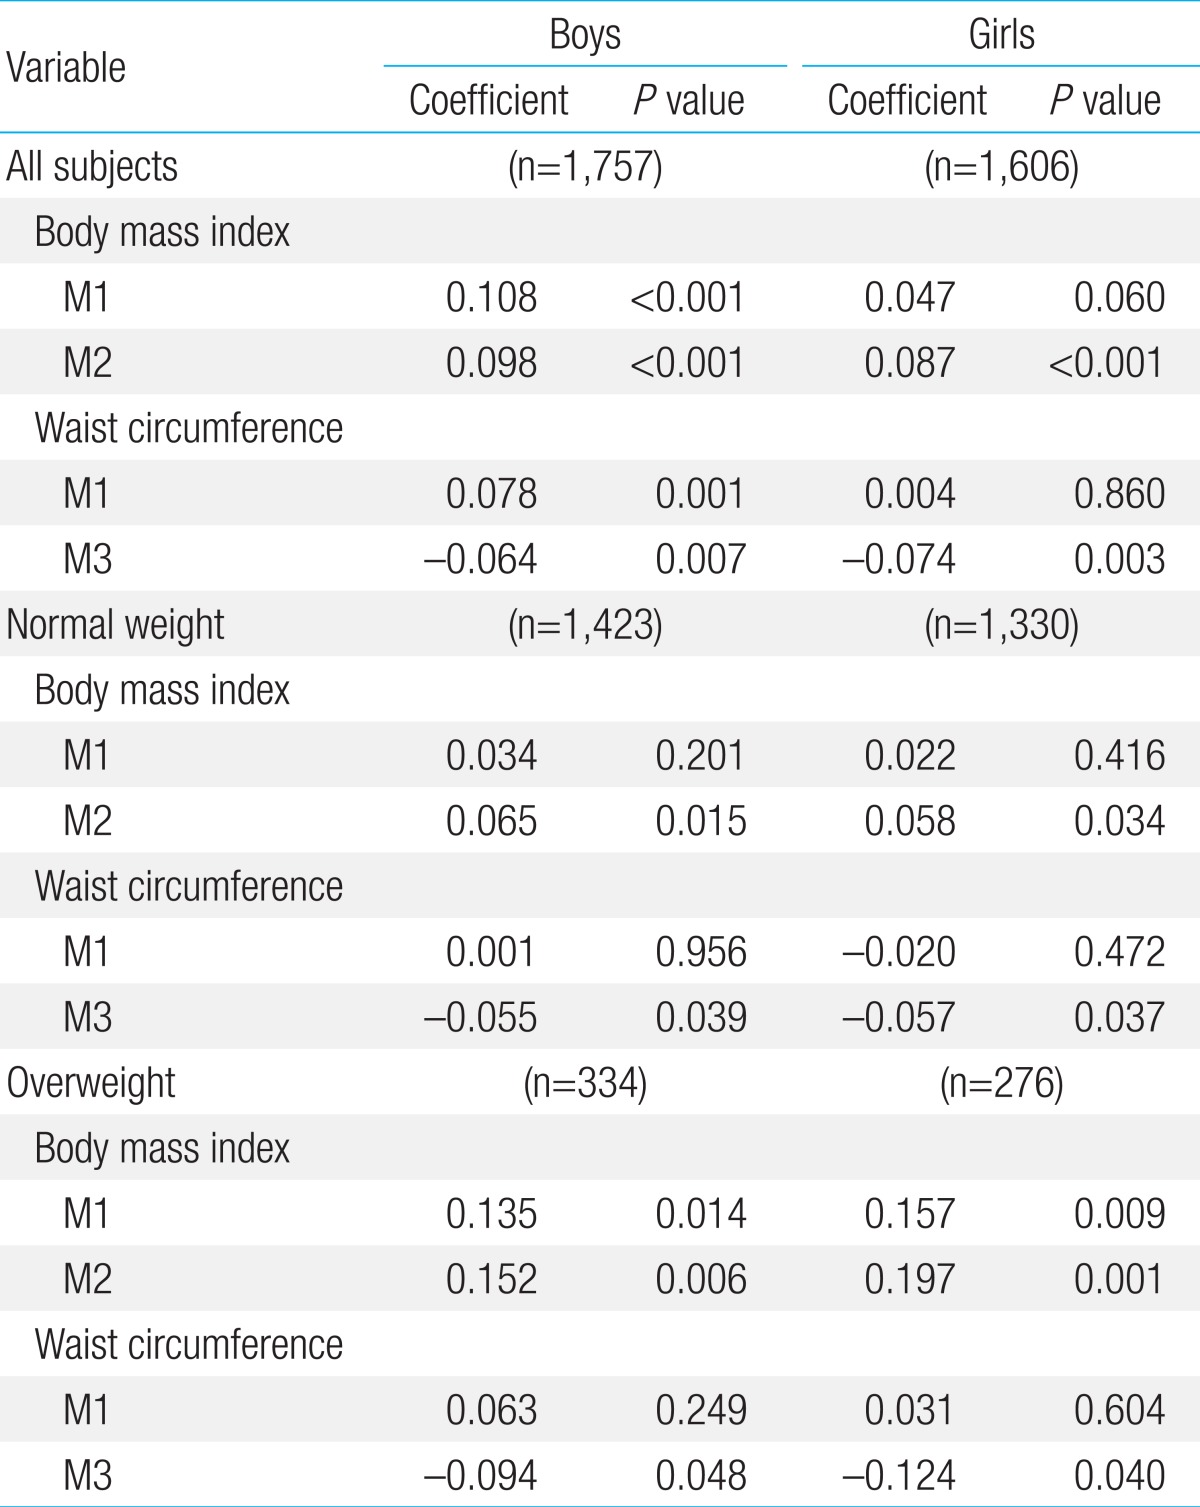
Correlation of diastolic blood pressure with body mass index and waist circumference in all subjects and in the normal weight and overweight groups
A positive association between BMI and high DBP was shown in all boys and in the overweight groups in both sexes (Table 6). After additional adjustment for WC, BMI was positively associated with high DBP in all subjects of boys and girls and in the normal weight and overweight groups in both sexes. WC correlated positively with high DBP only in all subjects of boys. We did not observe any association between WC and high DBP in any groups in either boys or girls after additionally adjusting for BMI.
Correlation of high diastolic blood pressure (>90th percentile) with body mass index and waist circumference in all subjects and in the normal weight and overweight groups
In summary, BMI, adjusted for WC, was independently associated with BP and high BP in the normal weight and overweight groups in both sexes as well as in all subjects of boys and girls. In contrast, WC showed no association with BP or high BP in any of the different groups in either boys or girls, when adjusted for BMI.
Discussion
An understanding of how hypertension develops in its early stages is important for establishing a strategy for the prevention of CVD. As hypertension is closely associated with obesity in adulthood, we investigated the correlations of BP with obesity indices including BMI and WC in adolescents. The main findings of our study can be summarized as follows. First, both high BMI and high WC were positively correlated with SBP and high SBP in both sexes and DBP and high DBP, in boys. Second, BMI maintained its positive associations with SBP, DBP, high SBP, and high DBP in the normal weight and overweight groups in boys and girls as well as in all subjects of both sexes, even after adjustment for WC. Third, WC lost its positive correlations with SBP, DBP, high SBP, and high DBP in both sexes in the different groups, when adjusted for BMI. To the best of our knowledge, this is the first study to report the independent associations of BMI and WC on BP separately in the normal weight and overweight subsets as well as in all subjects of both genders in adolescents.
Obesity in children and its consequences have been attracting more attention in the medical field because of the increased prevalence of childhood obesity worldwide and the long-term deleterious effects of obesity in adulthood. Furthermore, even early in life, obesity is associated with elevated BP, and persistent childhood hypertension increases the risk for hypertension, CVD, and early death in adulthood14). BMI and WC are commonly used indices of obesity, and obesity is hypothesized to increase sympathetic nerve activity, insulin resistance, and arterial stiffness, which may thereby elevate BP by increasing cardiac output and vascular resistance15). Numerous studies have reported positive correlations between high BMI, high WC, and elevated SBP and DBP in children and adolescents7,8,9). Our findings are consistent with those studies.
In studies of adults, a central distribution of body fat has been shown to be closely associated with an increase in adverse cardiovascular outcomes16), and WC has been considered a better indicator of total and abdominal fat mass than BMI. In theory, WC might be more closely associated with cardiovascular risks such as high BP than BMI, which reflects both lean and fat mass. However, this has not been proven in children or adolescents thus far. In the Avon Longitudinal Study of Parents and Children, which compared the magnitudes of the effects of BMI and WC on cardiovascular risk factors, WC was not more strongly associated with BP than BMI7). Maximova et al.6) reported that WC and BMI had similar effects on changes in SBP in United States children aged 12-13 years. In addition, another study showed that WC was not a better predictor than BMI in identifying children (aged 8-10 years) with high SBP11). In the present study, we observed that BMI was independently and positively correlated with SBP, DBP, high SBP, and high DBP in both sexes when adjusted for WC. In contrast, WC lost its positive associations with SBP, DBP, high SBP, and high DBP in both boys and girls after adjustment for BMI, suggesting that with a given BMI, WC does not seem to influence BP in Korean adolescents.
Another important finding of our study is that BMI was positively associated with SBP, DBP, high SBP, and high DBP in both the normal weight and overweight groups. In some interventional studies, it has been shown that BP substantially decreases when hypertensive or normotensive subjects who are obese lose weight17). Moreover, in a full range of population-based study in which weight and BP were measured in schoolchildren once between 6 and 15 years of age and again between 15 and 18 years of age, a change in the weight was associated with a change in BP18). Additionally, the magnitude of change in BP was related to weight gain or loss independently of the initial BP18). From these results, it can be hypothesized that in adolescents, BMI seems to maintain its positive association with BP at any weight level, and that a change in BMI may lead to a change in BP, irrespective of the individual being initially overweight or hypertensive or not.
In conclusion, BMI correlates better with BP and high BP levels than WC in Korean adolescents. In addition, BMI has a positive association with BP and high BP in the normal weight group as well as in the overweight group.
Acknowledgments
This work was supported by 2010 research funds from Inje University College of Medicine.
Notes
No potential conflict of interest relevant to this article was reported.