Hematological alterations in adolescent girls with restrictive anorexia nervosa and secondary amenorrhea at the time of diagnosis
Article information

Abstract
Background
Anorexia nervosa (AN) is associated with chronic energy deficiency and endocrine adaptations affecting multiple organ systems involving bone metabolism and hematological homeostasis. However, early alterations in peripheral blood counts of adolescents with a clinically homogeneous AN phenotype remain insufficiently characterized.
Purpose
To examine the differences in blood counts and associated bone and endocrine parameters between adolescent girls with newly diagnosed restrictive AN and secondary amenorrhea and healthy age-matched controls.
Methods
The study included 59 patients and 20 controls. Hematological indices, anthropometric characteristics, body composition, bone mineral status, bone turnover, and endocrine status markers were compared, and a multivariate analysis was used to identify the predictors of blood counts.
Results
Compared to controls, patients had significantly lower leukocyte, erythrocyte, and platelet counts (all P<0.01), and 29% had cytopenia in at least one parameter. Bone formation markers (osteocalcin, amino-terminal propeptide of human procollagen type I, and alkaline phosphatase) and key endocrine parameters (insulin-like growth factor-1, estradiol, and free thyroxine) were suppressed. These alterations were also observed in patients with a normal bone mineral density and adequate vitamin B12 and folate levels. A multivariate analysis identified endocrine- and bone-related predictors of blood counts in controls but no consistent pattern of predictors in patients.
Conclusion
Adolescent girls with restrictive AN and secondary amenorrhea demonstrated hematological alterations at the time of diagnosis despite the absence of a measurable skeletal impairment or micronutrient deficiency These findings suggest that a chronic energy deficiency and endocrine adaptation are associated with early disturbances in hematological homeostasis. Peripheral blood count may represent an accessible clinical marker of systemic disturbances.
Key message
Question: Do adolescent girls with restrictive anorexia nervosa and secondary amenorrhea have low blood counts at diagnosis?
Finding: Patients, even those with bone mineral density z scores similar to those of controls and adequate micronutrient levels, exhibited lower blood counts and suppressed bone formation and endocrine parameters compared with healthy age-matched controls.
Meaning: Hematological alterations may occur early in the disease course and complement routine clinical assessments.

Graphic abstract. AN, anorexia nervosa; IGF-1, insulin-like growth factor-1; BMD, bone mineral density; PINP, aminoterminal propeptide of human procollagen type I; fT4, free thyroxine; OPLS, orthogonal partial least squares.
Introduction
Anorexia nervosa (AN) is a life-threatening eating disorder characterized by distorted body image, intense fear of weight gain, and self-imposed starvation, predominantly affecting adolescent girls and young women [1]. Chronic severe energy deficiency results in profound metabolic and endocrine adaptations that influence multiple organ systems. Because AN frequently develops during adolescence—a critical period for bone mass acquisition—early deterioration of bone mineral status is frequently observed [2]. Malnutrition in AN is accompanied by complex neuroendocrine dysregulation involving the hypothalamic- pituitary-gonadal, hypothalamic-pituitary-thyroid, and hypothalamic-pituitary-somatotropic axes [3,4].
These endocrine adaptations reflect a coordinated response to chronic energy deprivation and contribute to impaired body composition and bone formation. They also affect the bone marrow microenvironment, which plays a central role in both hematopoiesis and skeletal homeostasis.
Bone marrow is a metabolically active organ that integrates hematopoietic, adipogenic, and osteogenic lineages and is particularly sensitive to chronic energy deficiency. Under conditions of prolonged energy deprivation, mesenchymal stem cell differentiation may shift toward adipogenesis at the expense of osteoblastogenesis. Consistent with this concept, despite marked depletion of peripheral fat stores, patients with AN demonstrate paradoxical increases in bone marrow adiposity, meaning that fat accumulates in the bone marrow even as it is lost elsewhere in the body [5,6]. Accumulation of fat in bone marrow may disrupt the hematopoietic niche—the specialized microenvironment supporting blood cell development—leading to abnormalities in peripheral blood counts, including leukopenia, erythropenia, and thrombocytopenia [7].
Previous studies in adolescents with AN have focused primarily on associations with anthropometric severity or disease duration. Investigations often included heterogeneous populations with different menstrual statuses (premenarchal girls, those with primary and secondary amenorrhea), mixed-sex cohorts, patients with different AN subtypes, or did not report the type of AN [8-11]. These factors may introduce potential confounders to the interpretation of hematologic findings.
Thus, it remains unclear whether early hematologic alterations in adolescents with AN occur independently of skeletal impairment or micronutrient deficiency. Moreover, how peripheral blood counts relate to bone metabolism and endocrine adaptations to chronic energy deficiency has not been sufficiently characterized in adolescents in the early stages of the disease.
To address this gap, we evaluated hematologic parameters in adolescent girls at the time of diagnosis of restrictive AN and secondary amenorrhea—a relatively homogeneous phenotype characterized by marked energy deficit and endocrine suppression. We examined the associations of hematologic parameters with anthropometric measures, bone mineral status, bone turnover indices, and endocrine markers. Because these independent variables are biologically interconnected and highly collinear, univariate regression approaches may not capture coordinated physiological patterns in the dataset's relatively high dimensionality. Thus, we applied orthogonal partial least squares (OPLS) regression to explore whether physiological determinants of blood counts differ between healthy adolescents and patients with AN. We hypothesized that patients would exhibit quantitative alterations in peripheral blood counts compared with healthy controls, and that physiological predictors of blood counts observed in healthy adolescents would be less clearly expressed in AN.
Methods
1. Study design
This is a retrospective analysis of a cross-sectional case-control study that included girls with restrictive AN and healthy controls, with the primary outcome being a comparison of bone mineral status and endocrine parameters. This secondary analysis aimed to compare blood counts across groups to investigate the impact of energy deficiency on bone marrow-derived lineages.
2. Study population
We included 59 girls at first diagnosis of restrictive AN and secondary amenorrhea. Restrictive AN was defined according to the Diagnostic and Statistical Manual of Mental Disorders, 5th Edition (DSM-5) criteria [1]. Thus, the patients met the general DSM-5 criteria for AN, which include: (1) significant restriction of energy intake leading to significantly low body weight; (2) intense fear of gaining weight or becoming fat; and (3) disturbance in self-perceived weight or shape. A key feature of a restrictive subtype of AN is the absence of regular bingeing or purging over the past 3 months. Thus, weight reduction is achieved by restricting calorie intake via dieting, fasting, or excessive exercise. Secondary amenorrhea was defined as an absence of regular menstruation for at least 3 months following previously normal cycles [12]. Girls were consecutively recruited at the Department of Pediatrics at the National Institute of Children's Diseases (NICD) in Bratislava between October 2016 and February 2020 among patients hospitalized for the differential diagnosis of severe weight loss. Based on medical history, the onset of the disorder was defined as the time point at which the patient, at her highest attained body weight, initiated intentional weight loss. The duration of the disease was calculated from the onset till hospitalization. AN was diagnosed based on parental information, patient observation, clinical examination, interviews, and consultative evaluations by a psychiatrist or psychologist to exclude other psychiatric disorders.
Twenty healthy age-matched girls recruited via primary care pediatricians practicing within the NICD premises served as controls. All controls and 31 patients with secondary amenorrhea had been included in our former study on bone mineral status in amenorrheic girls with AN [13]. An additional 28 patients with secondary amenorrhea were initially enrolled in a study of oxidative status [14]. The present analysis addresses a distinct research question focused on hematologic parameters and their associations with endocrine and bone-related markers. General exclusion criteria included neurological, gastrointestinal, endocrine, and skeletal disorders; acute or chronic inflammatory diseases; pregnancy; lactation; and current hormonal contraception. The study was conducted in accordance with the Declaration of Helsinki, following approval of the protocol by the Ethics Committee of the NICD, Bratislava, Slovakia, on August 10, 2016. In accordance with Slovak legislation, written informed consent was obtained from the girls' legal guardians, in addition to the participants' verbal assent.
3. Measurements
Clinical and laboratory data were prospectively collected during the initial diagnostic workup, prior to initiation of the re-feeding regimen, in accordance with a predefined institutional protocol. The blood counts were obtained from the same blood draw used for standard blood chemistry, endocrine, and bone metabolism markers.
4. Anthropometry
Height was measured to the nearest 0.1 cm using a wall-mounted stadiometer, and body weight to the nearest 0.1 kg using electronic scales (both: Seca, Germany). Body mass index (BMI) was calculated. Age- and sex-specific reference data from Slovak children and adolescents [15] were used to calculate standard deviation scores.
5. Bone mineral density and body composition
Bone mineral density (BMD, g/cm2), bone mineral content (BMC, g) of the lumbar spine (L1–4), left hip, left femoral neck, lumbar spine trabecular bone score (LSTBS), and body fat percentage were measured using a dual-energy x-ray absorptiometry scanner (Horizon QDR, Hologic Inc., USA), calibrated daily using a manufacturer-supplied standard block. The software (QDR APEXTM v. 5.6.0.5), integrated into the Hologic QDR APEX operating system, was used to compare BMD results against a manufacturer-provided pediatric population reference database and to report them as z scores.
6. Blood sampling and analyses
Blood was collected from the cubital vein in the morning, after at least 8 hours of fasting, into K3EDTA, Liheparin, and gel & clot activator tubes (Vacutainer Plastic Tube, Becton Dickinson, Czech Republic). Blood counts were determined using the Sysmex XN-1000 Hematology Analyzer (Sysmex, Japan). Total erythrocyte, leukocyte, or platelet counts below the lower limit of the appropriate reference ranges of the NICD’s laboratory (Supplementary Table 1) were termed erythropenia, leukopenia, and thrombocytopenia, respectively.
Routine blood chemistry was performed using standard methods on the Cobas c501 analyzer (Roche Diagnostics, Germany). The Vitros 5600 analyzer (Ortho Clinical Diagnostics, USA) was used to determine plasma concentrations of 25-OH vitamin D, vitamin B12, and folate. Vitamin D levels were obtained only from 18 controls and 58 patients. Folate and vitamin B12 concentrations were analyzed only in patients. Adequacy of vitamin levels was assessed according to the NICD’s reference ranges (Supplementary Table 1).
Parathyroid hormone, thyroid-stimulating hormone (TSH), free thyroxine (fT4), growth hormone (GH), cortisol, estradiol, and insulin-like growth factor-1 (IGF-1) were measured using chemiluminescence immunoassays on the Architect i20000SR analyzer (Abbott Laboratories, USA). Osteocalcin, amino-terminal propeptide of human procollagen type I (PINP), and carboxy-terminal telopeptide of type I collagen (CTX) were determined employing the electrochemiluminescence method (Cobas e411, Roche Diagnostics).
7. Statistics
The sample size was based on detecting a 15% difference in leukocyte counts at α=0.05 with 80% power and a 1:3 enrollment ratio, yielding groups of 19 controls and 57 patients.
Data distribution was assessed using the Kolmogorov- Smirnov test. Normally distributed data were compared using the 2-sided independent Student t test after checking for equality of variances with Levene test, and are presented as the mean±standard deviation (SD). When equal variances could not be assumed, we used Welch t test. Skewed data were compared using the Mann- Whitney U test and reported as medians (interquartile ranges). Categorical data were expressed as frequency and percentage. Significance was set at P<0.05. In addition to P values, which address only statistical significance, Cohen d effect sizes were calculated to quantify the magnitude of group differences between patients and controls, thereby facilitating interpretation of the potential clinical relevance of statistically significant findings, especially given unequal sample sizes. For normally distributed data, Cohen d is given with a 95% confidence interval. Effect sizes were interpreted according to conventional thresholds as ≥ |0.2| - small, ≥ |0.5| - medium, and ≥ |0.8| - large. Analyses were performed using IBM SPSS Statistics ver. 22.0 (IBM Corp., USA) and Psychometrica [16], and figures were generated using GraphPad Prism v. 11.0.2 (GraphPad Software, Inc., USA).
Multivariate analyses were performed using SIMCA v. 18.2 software (Sartorius Stedim Data Analytics AB, Sweden). Variables with high skewness and low min/max ratio were log-transformed, and all data were mean-centered. Principal component analysis was used to explore the sample distribution without classification. Hotelling T2 test was applied to identify potential outliers. We applied an OPLS model for multivariate regression because it is well-suited to high-dimensional, intercorrelated data and can enhance interpretability. The OPLS analysis was intended as a complementary multivariate approach to support our central hypothesis that chronic energy deficiency disrupts the normal physiological relationships linking nutritional, endocrine, skeletal, and hematopoietic regulation. Independent variables entered into the model included femoral neck z score, body fat percentage, IGF-1, CTX, PINP, alkaline phosphatase (ALKP), fT4, estradiol, and, in patients, duration of amenorrhea or disease duration. Variables with Variable Importance in the Projection (VIP) scores ≥1 were considered relevant contributors. Measures of fit (R²) and predictivity (Q²) ≥0.5 were considered acceptable. Significant models were validated using a permutation test (n=100). The criterion for validity was that the Q2 regression line intersected the vertical axis at or below zero. The detailed descriptions of the model evaluation and outcomes are provided in the Supplementary material, as they primarily support the multivariate analysis, whereas the principal biological findings are summarized in the main manuscript.
Results
Cohort characteristics are given in Table 1. In 58 out of 59 patients, disease duration ranged from 3 to 30 months; in the remaining girl, it was 50 months. Controls had blood counts within the reference ranges. Patients had lower total leukocyte counts (-16%; Cohen d=-0.8; 95% confidence interval [CI], -1.3 to -0.3) (Fig. 1A) than controls, and 10 (17%) had leukopenia. Across all leukocyte lineages, significance was observed only in the monocyte percentage, which was lower in patients (Table 1). They also showed lower erythrocyte counts (-6%; Cohen d=-0.8; 95% CI, -1.4 to -0.3) (Fig. 1B). Nine (15%) had erythropenia (4 of whom concurrently had leukopenia). Patients had lower hematocrit (-5%), while hemoglobin concentration and mean cell volume (MCV) did not differ significantly between the groups. Girls with AN exhibited higher mean cell hemoglobin and red cell distribution width, but the differences were within the reference range (Table 1). Platelet counts (-14%; Cohen d=-0.8; 95% CI, -1.3 to -0.3) (Fig. 1C) and plateletcrit (-19%, Table 1) were also lower in patients than in controls. Two patients (3%) had thrombocytopenia. Mean platelet volume was similar in both groups (Table 1). Girls with AN had adequate folate and vitamin B12 levels (Table 1), although one exhibited a vitamin B12 level below the reference range.

Anthropometrics and blood counts of healthy controls versus patients with anorexia nervosa

Blood counts, markers of bone status, and estradiol and IGF-1 concentrations of patients with AN (n=59) versus controls (n=20). Normally distributed data (panels A, B, C, D, F, and H) were compared using the 2-sided independent Student t test after checking for equality of variances with Levene test and are shown as mean and standard deviation. Skewed data (panels E and G) were compared using the Mann-Whitney U test, and medians and interquartile ranges are indicated. Statistical significance was set at P<0.05. IGF-1, insulin-like growth factor-1; AN, anorexia nervosa; BMD, bone mineral density; PINP, amino-terminal propeptide of human procollagen type I.
Hip BMD z scores were lower in patients than in controls (Cohen d=-0.6; 95% CI, -1.2 to -0.1) (Fig. 1D), whereas those of lumbar spine, femoral neck, and LS TBS were lower without reaching significance (Table 1). Six patients (10%) displayed z scores of ≤-2 SD (considered "below the expected range for age") [17] at least at one measured site.
Plasma PINP (Cohen d=-1.8; Fig. 1E) and osteocalcin levels, and ALKP activity were lower in patients. CTX concentrations did not differ significantly between the groups (Table 1). Patients had higher 25-OH vitamin D levels than controls (Cohen d=0.8; 95% CI, 0.3–1.3) (Fig. 1F); 56% of controls and 36% of patients had values below the reference range. Data on anthropometric measurements, BMD, BMC, and plasma mineral concentrations are provided in Supplementary Table 2.
Patients had lower estradiol (Cohen d=-1.2; Fig. 1G) and IGF-1 (Cohen d=-1.4; 95% CI, -1.9 to -0.8) (Fig. 1H) levels than controls. Concentrations of cortisol and TSH were similar between groups, whereas fT4 was lower and GH was higher in patients than in controls (Table 1).
To determine if reduced blood counts were independent of bone density, we analyzed a subset of patients with BMD z scores ≥-1.4 SD at all sites, matching the lower range of our control group. Patients without measurable deterioration of bone mineral status, as shown in Table 2 and Fig. 2D, nevertheless exhibited significantly lower leukocyte (-15%; Cohen d=-0.7; 95% CI, -1.2 to -0.2; Fig. 2A), erythrocyte (-6%; Cohen d=-0.9; 95% CI, -1.4 to -0.3) (Fig. 2B), and platelet (-14%; Cohen d=-0.8; 95% CI, -1.3 to -0.2) (Fig. 2C) counts than controls. Seven of 45 patients (16%) had erythropenia; 5 (11%) had leukopenia (2 of whom had it combined with erythropenia); and 1 (2%) had thrombocytopenia. Compared with controls, these patients exhibited alterations in monocyte percentage, hematocrit, MCV, mean cell hemoglobin (MCH), red cell distribution width (RDW), plateletcrit, and mean platelet volume (MPV) similar to those observed in the whole group, all associated with medium-to-large effect sizes. Concurrently, suppression of bone formation markers and dysregulation of key hormonal axes were also evident (Table 2; Fig. 2E–G). Data on anthropometrics, BMD, BMC, and plasma mineral concentrations are provided in Supplementary Table 3.

Anthropometrics and blood counts of healthy controls versus patients with anorexia nervosa presenting with BMD z scores ≥ -1.4 SD
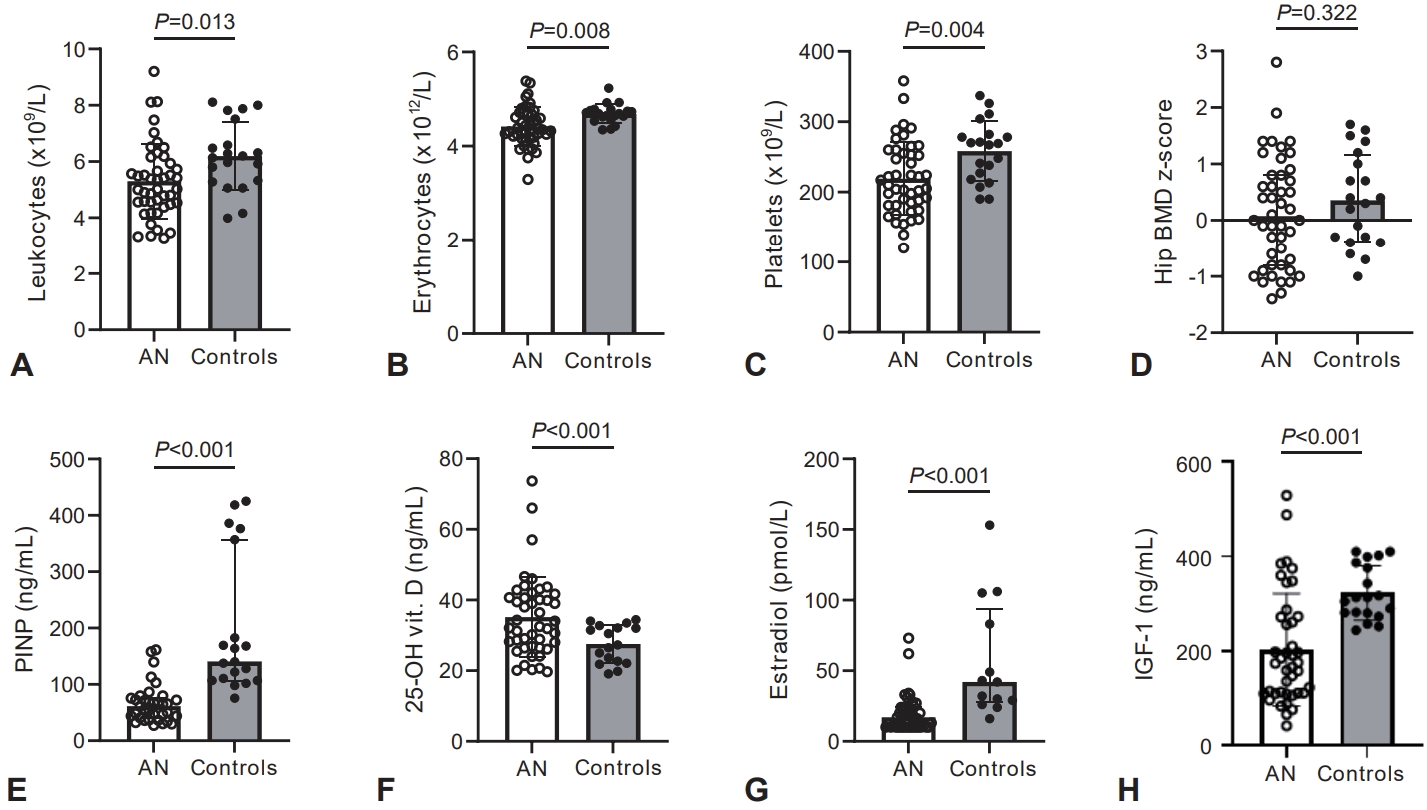
Blood counts, markers of bone status, and estradiol and IGF-1 concentrations in patients with anorexia nervosa presenting with BMD z scores ≥ -1.4 SD (n=45) and healthy controls (n=20). Normally distributed data (panels A, B, C, D, F, and H) were compared using a 2-sided independent Student t test after a check for equality of variances with Levene test and are given as mean and SD. Skewed data (panels E and G) were compared using the Mann-Whitney U test and are shown as median and interquartile range. Statistical significance was set at P<0.05. IGF-1, insulin-like growth factor-1; AN, anorexia nervosa; BMD, bone mineral density; PINP, amino-terminal propeptide of human procollagen type I; SD, standard deviation.
Descriptive statistics for the OPLS models are provided in Supp. Table 4. In healthy controls, the leukocyte model explained 64% of the outcome variance with marginal predictivity (Q²=0.50). FT4, femoral neck z score, and estradiol had VIP values ≥1. The model passed the permutation test. Loading, VIP, and permutation plots are presented in Supplementary Fig. 1A–C. The erythrocyte and platelet models explained 52% and 43% of outcome variance, respectively, but showed limited (Q²=0.24), or poor (Q²=0.03) cross-validated predictivity. In patients with anorexia nervosa, all three models showed poor explanatory performance (25%, 13%, and 11%, respectively) and low or even negative Q² values (0.04, −0.01, and −0.02, respectively). Except for leukocytes in controls, the remaining models did not meet the stated criteria for acceptable predictive performance.
Discussion
The most relevant finding of this study was that adolescent girls with restrictive AN and secondary amenorrhea, whose BMD z scores were similar to those of controls and whose vitamin status was adequate, had, at the time of diagnosis, significantly lower leukocyte, erythrocyte, and platelet counts than healthy controls. Our findings suggested that quantitative hematologic alterations in AN coincide with the disruption of physiological relationships linking nutritional and endocrine status, bone metabolism, and hematopoiesis. Peripheral blood counts may serve as clinical indicators of systemic metabolic adaptation to chronic energy deficiency in adolescent AN.
Leukocyte counts were lower in the AN group, with a medium-to-large effect size. The relative proportions of leukocyte lineages suggest a generalized reduction in production (probably due to chronic undernutrition), although a mild, selective suppression of the monocyte lineage may reflect an impaired innate immune response. Lower erythrocyte counts and hematocrit in girls with AN, with hemoglobin concentrations similar to those of the controls, suggest mild or compensated anemia-related changes, which may be partially explained by the relatively short duration and moderate severity of the disease. Higher MCH and RDW, with a trend toward higher MCV, may indicate early macrocytic adaptation or increased heterogeneity in erythrocyte size, potentially related to nutritional deficiencies. Since reticulocyte counts were not assessed in the standard differential blood count, we can only speculate that a higher RDW may partially reflect impaired erythrocyte maturation. Mean vitamin B12 and folate levels in the patients were not suggestive of severe micronutrient deficiency, implying that the observed alterations may primarily reflect caloric restriction and marrow suppression rather than overt micronutrient depletion. Lower total circulating platelet mass in patients, together with similar MPV across groups, may indicate that platelet production remains qualitatively intact, while overall megakaryocyte activity is suppressed. Thus, our findings likely reflect adaptive hematopoietic and immunologic alterations associated with chronic energy deficiency.
Reduced blood counts are well recognized in AN, and not all 3 hematopoietic lineages are affected simultaneously [18]. In other studies, girls with AN displayed lower leukocyte and platelet counts [9] or lower leukocyte and erythrocyte counts [8] than their healthy peers. In adolescents with AN, a decline in peripheral blood cell counts is generally mild, and the reduction is only partly attributable to cytopenias [8,19-21]. Overt cytopenias are reported particularly in long-lasting (defined as disease duration ranging from 3 to 10 years, with a mode of 7 years), enduring (defined as multiple unsuccessful treatment attempts), and severe disease (BMI <16 kg/m2 in those aged ≥15 years; there is no consensus on percentile for younger patients) [1,22,23], predominantly in adults, with prevalence increasing as malnutrition progresses. In these cases, pancytopenia and morphological changes in the bone marrow, including hypocellularity and gelatinous marrow transformation, may occur [4,24-27]. This suggests that impaired hematopoiesis in AN may be independent of overt skeletal impairment, and not primarily driven by micronutrient deficiency, but rather reflects systemic metabolic adaptations to chronic energy deprivation. Our findings extend these observations by demonstrating that in a relatively homogeneous adolescent cohort, hematologic alterations may be detectable at diagnosis, or early in the disease course, even in patients with preserved BMD and adequate folate and vitamin B12 levels.
Despite severe peripheral fat loss, patients with AN paradoxically exhibit increased bone marrow adiposity [5,28]. Metabolically active bone marrow adipose tissue (BMAT) influences hematopoietic activity and bone remodeling by regulating interactions among osteoblasts, adipocytes, and hematopoietic stem cells [6,29,30]. During periods of caloric restriction, BMAT expands and secretes paracrine and endocrine factors that redirect mesenchymal stem cell differentiation in the bone marrow toward adipocytes rather than osteoblasts. We did not evaluate the bone marrow status. Young females with AN and a history of fractures had higher BMAT but similar BMD or bone microarchitecture compared with those without [31]. Moreover, about 39% of adolescents and young adults with AN exhibit bone marrow hypoplasia or aplasia, and 50% display partial, focal, or complete gelatinous degeneration of the bone marrow [32]. Importantly, peripheral blood counts in AN may underestimate the extent of bone marrow involvement [25,32].
The coexistence of marked energy deficiency with higher vitamin D concentrations and preserved vitamin B12, folate, and mineral status in the patients at the time of diagnosis probably reflects sustained self-supplementation rather than adequate nutritional intake from food sources alone. Regular intake of vitamin supplements and minerals is 10 times more frequent in adolescent girls with AN than in controls [8], probably explaining the lower prevalence of vitamin D deficiency (2% in AN vs. 24% in controls) [33].
Patients with AN exhibited marked endocrine alteration, including lower concentrations of IGF-1, estradiol, fT4, and higher GH, together with suppression of bone formation markers. These hormonal abnormalities are well-recognized adaptive responses to chronic energy deficiency and were accompanied by hematologic alterations that were present even in patients with preserved bone mineral status. Endocrine and bone-derived pathways have been implicated in the regulation of the hematopoietic microenvironment [8,34]. In contrast to healthy controls, multivariate analyses in patients with AN did not identify stable associations among hematologic, endocrine, and bone-related variables. Thus, our results do not support a consistent relationship between endocrine parameters and peripheral blood counts in adolescents with AN. Given the limited predictive performance of the OPLS model and the lack of its validation in patients, the exploratory associations identified in this study should be interpreted with caution. The observed hematologic abnormalities should be considered primarily as concurrent manifestations of malnutrition rather than as direct consequences of specific endocrine alterations.
Although malnutrition-related bone marrow and hormonal abnormalities are largely reversible with nutritional rehabilitation [34], skeletal deficits acquired during adolescence may persist, increasing the risk of premature osteoporosis and fractures [35].
This study has limitations. Its cross-sectional design does not allow causal inference regarding relationships among nutritional status, endocrine alterations, bone metabolism, and hematologic findings. The relatively small control group may have limited power to detect subtle associations; however, controls were carefully agematched and evaluated using the same protocol, enabling reliable comparisons, and effect sizes indicated medium-to-large effects. Our study also lacks a direct evaluation of bone marrow composition. In addition, we did not assess dietary intake, dietary supplement use, physical activity, iron status, or several other factors that may affect hematopoiesis and endocrine-bone interactions. Despite these limitations, the study provides novel insights into hematologic alterations in adolescent girls with newly diagnosed AN of a relatively homogeneous phenotype (restrictive AN with secondary amenorrhea). The well-defined cohort enabled evaluation of early disease-related changes while minimizing potential confounders (such as age, sex, AN subtype, reproductive status), and demonstrated that hematologic abnormalities may already be present even in patients without overt bone mineral impairment.
In conclusion, girls with restrictive AN and secondary amenorrhea showed lower peripheral blood cell counts alongside endocrine suppression and altered bone turnover, despite preserved BMD and the absence of overt micronutrient deficiency. While hematologic abnormalities in AN have been previously described, our findings extend existing evidence by showing that these alterations are also present in a clinically homogeneous subgroup of adolescents with relatively preserved bone status. These findings support the concept that hematologic alterations may reflect early systemic metabolic adaptation in AN, even before measurable bone loss becomes apparent. Future longitudinal studies, ideally including direct assessment of bone marrow characteristics, are needed to clarify underlying mechanisms and potential prognostic implications.
Supplementary materials
Supplementary Tables 1-4 and Supplementary Fig. 1 are available at https://doi.org/10.3345/cep.2026.00808.
Age-dependent reference values in females - hematology and blood chemistry
Anthropometric characteristics, bone mineral density, bone mineral content, and plasma minerals in healthy controls and girls with anorexia nervosa
Anthropometric characteristics, BMD, BMC, and plasma minerals in healthy controls and girls with anorexia nervosa presenting with BMD z scores ≥ -1.4 in all measured locations
The multivariate regression of selected variables on leukocytes, erythrocytes, and platelet counts in healthy controls and patients with anorexia using the orthogonal partial least squares model
The multivariate regression model by OPLS of independent variables on leukocyte counts in healthy controls. (A) Green dots, independent variables; blue dot, dependent variable; IGF-1, insulin-like growth factor-1; FatPerc, body fat percentage (by DEXA); CTX, carboxy-terminal telopeptide of type I collagen; PINP, amino-terminal propeptide of human procollagen type I; ALP, alkaline phosphatase; E2, estradiol; fT4, free thyroxine; FemNeckscore, femoral neck BMD z score; Leu, leukocytes. (B) The VIP plot, variables with Variable Importance in the Projection (VIP) values ≥ 1.00 were considered as important predictors of leukocyte counts. OPLS, orthogonal projections to latent structures; CTRL, controls. (C) Permutation test plot validating the OPLS model. The permutation test results (Q2=[0.0; -0.592]) confirm the model’s accuracy.
Notes
Conflicts of interest
No potential conflict of interest relevant to this article was reported.
Funding
The Ministry of Health of the Slovak Republic, No. 2018/36-LFUK-10; The Grant Agency of the Ministry of Education, Science, Research and Sport of the Slovak Republic (VEGA), No. 1/0613/17.
Author contribution
Conceptualization: KS, LP; Data curation: KS, AGK, LT; Formal analysis: KS, AGK, LT, LP; Funding acquisition: LP; Methodology: KS, AGK, LT; Project administration: LP; Writing - original draft: KS; Writing - review & editing: KS, AGK, LT, LP