Serum metabolomic profile in children with sepsis-associated acute kidney injury
Article information

Abstract
Background
Sepsis-associated acute kidney injury (SA-AKI) contributes to high morbidity and mortality rates in children; however, current diagnostic tools (serum creatinine and urine output) lack sensitivity for early detection. Metabolomics can be used to discover novel metabolic markers to enable early diagnosis and prognosis and provide therapeutic targets for SA-AKI.
Purpose
This study was aimed to identify the differentially expressed serum metabolites in children with SA-AKI.
Methods
We conducted an untargeted serum metabolomic analysis using liquid chromatography-mass spectroscopy (LC-MS) in 75 children: 45 with sepsis and acute kidney injury (AKI) (15 each in Kidney Disease Improving Global Outcomes [KDIGO] stages 1–3), 15 with sepsis without AKI, and 15 healthy controls. Fasting blood samples were collected and centrifuged. Supernatant serum was stored at -80°C and subjected to untargeted metabolomic analysis using LC-MS. Reverse-phase and hydrophilic liquid interaction chromatographic separation was performed in positive and negative ion scan modes, while metabolite identification was performed using the SCIEX All-In-One HR-MS/MS Library with National Institute of Standards and Technology 2017 Library bundle.
Results
The significantly altered metabolites in AKI stage 3 were lipids belonging to the glycerophosphoethanolamine subgroup of the phospholipid class. Eighteen metabolites were differentially expressed in patients with SA-AKI versus healthy controls, with phosphoethanolamines (e.g., 1-palmitoyl-2-hydroxy-sn-glycero-3-phosphoethanolamine) showing a consistent association with AKI stage. Thirty-one metabolites were significantly altered in severe AKI (KDIGO stages 2–3), of which only 4 could be annotated and increased proportionally with AKI severity. A pathway analysis revealed significant enrichment of glycerophospholipid, linoleic acid, and alpha-linolenic acid metabolism in stage 3 SA-AKI.
Conclusion
Serum metabolomics is a feasible approach to identifying novel biomarkers of SA-AKI. Phosphoethanolamine metabolites both distinguished AKI from sepsis controls and were correlated with clinical severity (estimated glomerular filtration rate decline), suggesting its potential prognostic value. However, its diagnostic feasibility requires preliminary validation in larger multicenter cohorts.
Key message
Question: Can the potential metabolites/pathways involved in the pathogenesis of sepsis-associated acute kidney injury (SA-AKI) be identified using metabolomics?
Finding: We identified 18 novel metabolites involved in the pathogenesis of SA-AKI as well as 31 metabolites that were altered in severe AKI. Linoleic acid, linolenic acid, and phospholipid pathways were altered in SA-AKI.
Meaning: Once validated, these markers may be used to diagnose SA-AKI at an early stage before sufficient kidney injury occurs.
Graphical abstract. SA-AKI, sepsis-associated acute kidney injury.
Introduction
Sepsis is the one of the most important causes of acute kidney injury (AKI). Sepsis-associated AKI (SA-AKI) accounts for approximately 40%–50% of AKI in critical care units and is associated with increased mortality, poor outcome and an increased risk for the development of chronic kidney disease (CKD) [1,2]. Despite the burden it imposes on healthcare system, there are currently no effective disease-modifying therapies available for SA-AKI at present. The current gold standard for the diagnosis of AKI relies upon serum creatinine and urine output measurements, both of which reveal relevant drawbacks. Till the time AKI is recognized by these conventional indicators, it is already too late to protect the already damaged kidney. In early AKI, large changes in glomerular filtration rate (GFR) are associated with little change in serum creatinine values [3]. Moreover, it does not indicate whether a patient is still in the progressive stage or if recovery has already begun. Urine output measurements, on the other hand can be influenced by medications like diuretics and require long time taking evaluations. Thus, there is a need for novel biomarkers which can aid in AKI risk assessment, early detection and prognosis and serve as therapeutic targets for drug discovery in future [4,5].
Metabolomics, which refers to the systematic study of metabolites and their changes in biological samples due to physiological stimuli and/or genetic modifications is relatively new in the field of ‘omics’ sciences [6]. Metabolites are not static products, rather are dynamic components that interact continuously with each other in a cell. Thus, studying these metabolites eventually reflect upon the biological processes going on in our body [7,8]. Metabolomics can not only help in yielding biomarkers for differentiation of disease processes but can also help in elucidating the pathophysiological mechanisms for the diseases [9].
In this study, we identified the differentially expressed metabolites in serum in children with SA-AKI using UPLC-Q/TOF-MS/MS (ultra-performance liquid chromatography quadrupole/time-of-flight mass spectrometry/mass spectrometry) based untargeted metabolomics and compared them with sepsis and healthy controls. Employing omics technologies to elucidate fundamental pathophysiology in SA-AKI has the great potential to bring new clinical therapies to the bedside. Till date the only therapy for AKI patients is preventive or supportive and kidney replacement therapy. Thus, our research is aimed to identify differentially expressed molecules which aid in early diagnosis of such patients and serve as potential therapeutic targets to bring the findings of our research to bedside clinics.
Methods
1. Study design and patient population
This cross-sectional study was conducted at Division of Pediatric Nephrology at Lady Hardinge Medical College & Kalawati Saran Children Hospital, New Delhi in collaboration with CSIR-Institute of Genomics and Integrative Biology, New Delhi between January 2021–June 2022. The study was approved by the Institutional Ethics Committee (LHMC/IEC/2020/96 dated 29.12.2020) with respect to informed consent and patient safety issues. All patients were enrolled after an informed consent (or parents/guardians’ consent). Fifteen children each with sepsis and KDIGO stages 1, 2, and 3 AKI respectively, 15 children with sepsis without AKI and 15 healthy children (total 75 children) were enrolled. AKI staging was decided at the time of taking the sample according to the updated KDIGO guidelines for AKI [10]. Surviving sepsis 3 guidelines were used for defining sepsis [11]. This study was designed prior to the publication of the Phoenix Pediatric Sepsis Score (2023), the latest pediatric-specific consensus definition of sepsis and septic shock. Accordingly, patient classification was performed using Sepsis-3 criteria. While this represents a limitation, our findings remain relevant in highlighting candidate biomarkers that merit validation under phoenix-based definitions in future pediatric cohorts. Exclusion criteria were as follows: children with CKD, renal malformations, renal stones and those who had received any intravenous contrast agent 5 days prior to enrolment. Clinical assessment of each participant included a review of medical records along with history, blood pressure measurement, height, weight, urine analysis, serum electrolytes, blood urea, serum creatinine, and other relevant investigations as needed.
2. Sample collection and preparation for analysis
Two ml blood sample was collected from overnight fasting patients at the point when AKI was first diagnosed in them since their arrival in our hospital into serum vacutainer tubes and centrifuged within 30 minutes (1,500 g for 10 minutes at 20°C). The samples for urea and creatinine and for metabolomic profile were taken at the same time. In healthy controls, samples were obtained during routine evaluations in children seeking consultation for swimming classes or other contact sports. In SA-AKI and sepsis without AKI controls, they were collected within first hour of admission to the hospital at the time of enrolment. All samples were anonymized and coded. Aliquots of serum were prepared in microcentrifuge tubes and stored at -80°C until metabolite extraction. Metabolite extraction from serum sample was performed by using prechilled (at -20°C) methanol-chloroform (3:1). To 100 μL of serum, 300 μL of prechilled methanol-chloroform (3:1) was added, vortex mixed for 30 seconds and incubated at ice for 15 minutes followed by centrifugation at 15,000 g for 15 minutes at 4°C. Supernatant was collected, dried under vacuum and stored at -80°C till LC-MS run.
3. Reverse-phase high performance liquid chromatography
The reverse-phase chromatography was carried out on an Ultimate 3000-Dionex HPLC (high performance liquid chromatography) system. Both, reverse phase (C-18) and HILIC chromatography were done. The reverse-phase separated analytes were acquired in both positive and negative ion scan modes.
For C-18 chromatography, the 2 mobile phases consisted of 10 mmol ammonium acetate with 0.1% formic acid in 99.9 water (buffer A) and 0.1% formic acid in 99.9% acetonitrile (buffer B). Metabolites, re-suspended in 75 μL of 50% methanol were separated on a Waters Acquity BEH C18 column (10 cm×2.1 mm) using a binary gradient of 30 minutes. The flow rate was set to 200 μL/min. Column oven temperature was set at 30°C and autosampler temperature was set to 4°C. The linear mobile phase B gradient was applied from 1% to 95% B. The following gradient program was employed: 1 to 5% buffer B for 1 minute, 5% to 40% buffer B in 3 minutes, 40% to 95% buffer B in 10 minutes, 95% buffer B for 5 minutes, 95% to 5% buffer B for 6 minutes and 5% buffer B for 5 minutes. This resulted in a total gradient time of 30 minutes. For HILIC chromatography, the 2 mobile phases consisted of 10 mmol ammonium acetate + 0.1% formic acid in 99.9% water (buffer A) and 95% acetonitrile + 10 mmol ammonium acetate and 0.1% formic acid (buffer B). Metabolites, re-suspended in 75 μL of 50% methanol were separated on a HILIC stationary phase by reverse-phase chromatography with an acetonitrile/ammonium acetate/water/0.1% formic acid mixture for run time of 15 minutes. The flow rate was set to 300μL/min. The linear mobile phase A gradient was applied from 1% to 90% A. The following gradient program was employed: 1 to 5% buffer A for 30 seconds, 5% to 10% buffer A in 1 minute, 10% to 70% buffer A in 7.5 minutes, 70% to 90% buffer A in 1 minute, 90% buffer A for 2.5 minutes, 90% to 5% buffer A for 1 minute and 5% buffer A for 1.5 minutes. This resulted in a total gradient time of 15 minutes. An Ultimate 3000-Dionex HPLC system was coupled with an electrospray mass spectrometer (TripleTOF 5600+, SCIEX, USA). Mass spectrometer was operated in a data dependent mode and top 15 ions were subjected to MS/MS fragmentation in each duty cycle. Peaks were selected for fragmentation with a threshold value of 100 cps.
4. Quantitative data and statistics analysis
Peak filtering and alignment were carried out in MarkerView v1.2.1 (USA). Peak areas were normalized using ‘Total area sum normalization’ in MarkerView. A sample total ion chromatogram (TIC) plot has been shown in Fig. 1. The normalized intensities were then computed for each sample for different data sets. For determining the significantly differentially expressed peaks, unpaired t test was performed. A log2 fold change of ±0.58 along with a P value <0.05 was considered to be significantly different for any peak. Each sample was searched against the human metabolome database library loaded in PeakView (SCIEX). Metabolite identification was performed by matching masses and retention times with a mass accuracy window of 5 ppm and retention time window of ±1 minute for ‘SCIEX all in one metabolite library with NIST 2017 library bundle’ against the differentially identified mass features.
Sample representative total ion chromatogram (TIC) plot. In this plot, the x-axis represents the retention time for different metabolites, while the y-axis represents the analyte intensities. The area under the curve of each metabolite was used to measure its response.
Results
1. Participant characteristics
The mean age group of patients with SA-AKI was 9.2 years with an almost equal number of males and females. Although our inclusion criteria included patients ranging from 1–17 years of age; however, the narrow age range of the enrolled participants reflects random enrolment during the study period. The mean estimated GFR (eGFR) of stages 1, 2, and 3 AKI were 72.5, 50.3 and 23.3 mL/min/1.73 m2 respectively. All demographic and hemodynamic parameters were comparable in all study groups. Serum creatinine, blood urea, international normalized ratio, D-dimer, vasopressor use, mechanical ventilation increased progressively with stage of AKI. Rest of the biochemical parameters were comparable among the study groups (Table 1).
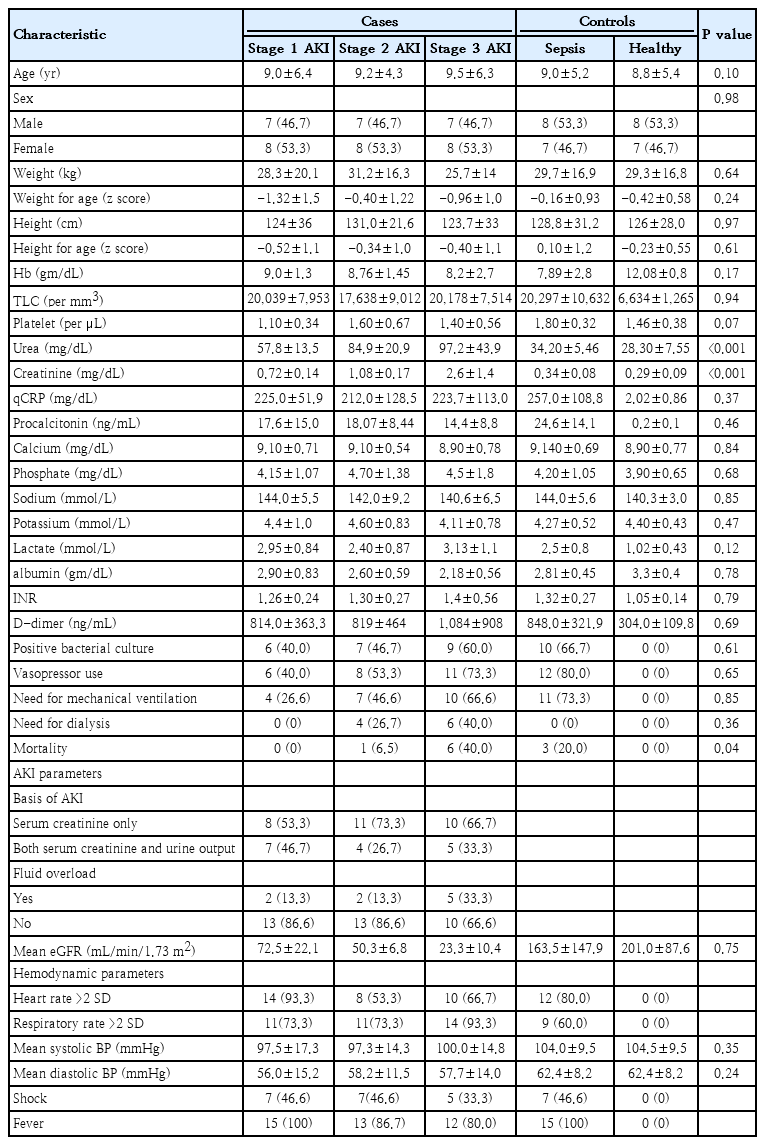
Baseline characteristics of study participants
Blood cultures were positive in a subset of children with sepsis and SA-AKI. The most frequently isolated organisms included Escherichia coli (n=8), Klebsiella (n=7), Streptococcus pneumoniae (n=5) followed by other gram-negative and gram-positive pathogens. Culture positivity increased with advancing AKI stage, although this trend did not reach statistical significance. Vasopressor requirement was more frequent in children with higher AKI stages, reflecting greater illness severity. However, no statistically significant associations were observed between culture positivity, specific pathogens, or vasopressor use and the levels of annotated serum metabolites.
2. Global metabolite determination
The average of response of metabolites represented by the area under curve of the TIC plot in all 3 stages of SA-AKI was compared with healthy controls and a total of 18 differentially expressed metabolic features with a P value less than 0.05 and a log fold change of ±0.58 were identified as shown in Supplementary Table 1. Out of these we could annotate 4 metabolites. The rationale for comparison of SA-AKI groups with those of sepsis controls and healthy controls was to identify metabolites which show significantly altered response in SA-AKI patients since sepsis is one of the most common causes of AKI and SA-AKI is among the leading causes of morbidity and mortality in most intensive care units. We compared the response of these differential metabolites in all 3 stages of SA-AKI to search for those metabolites which show an increasing or decreasing trend with the stage and severity of AKI. We hence found that 7 metabolites either decreased or increased with increasing stage and severity of AKI as compared to healthy controls as shown in Supplementary Table 2. Out of them, two could be annotated.
In order to exclude metabolites that are expressed due to sepsis, we further compared the response of dysregulated metabolites with sepsis controls without AKI and found that 4 metabolites were differentially expressed and increased in AKI patients and their response increased with increasing stage and severity of AKI (Table 2). Two out of them have been annotated which are 1-palmitoyl-2-hydroxy-sn-glycero-3-phosphoethanolamine and 1-oleoyl-sn-glycero-3-phosphoethanolamine.
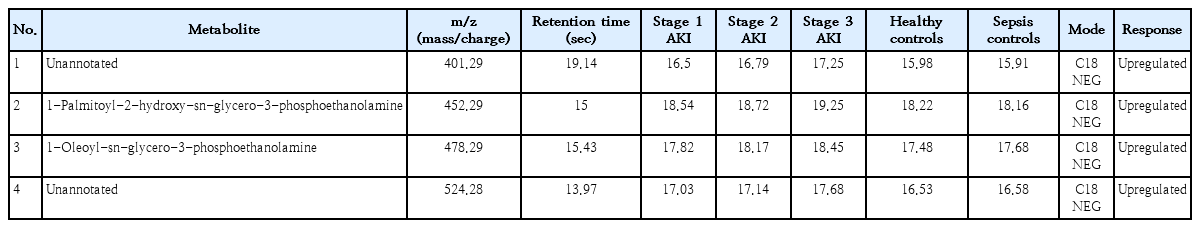
Response of significantly altered metabolites among groups of patients with AKI, healthy controls, and sepsis controls
3. Identification of metabolites in severe AKI
In order to find metabolites whose levels correlated to the degree of renal injury, we compared stage 2 and 3 of AKI with healthy control groups as renal function progressively declines with stage of AKI and found that 31 metabolites were significantly altered in severe AKI as shown in Table 3. To determine whether the significantly altered metabolites showed progressive changes across increasing AKI severity, a trend analysis was performed using Spearman rank correlation. Six of the 7 metabolites demonstrated a statistically significant monotonic increase across the 3 stages of AKI out of which 4 have been annotated till date. These include 1-palmitoyl-2-hydroxy-sn-glycero-3-phosphoethanolamine, 1-oleoyl-sn-glycero-3-phosphoethanolamine, 1-stearoyl-2-hydroxy-sn-glycero-3-phosphoethanolamine and 1-(5Z,8Z,11Z,14Z-Eicos atetraenoyl)-sn-glycero-3-phosphoethanolamine, all of which paralleled rises in serum creatinine and urea across AKI stages (Supplementary Table 3).
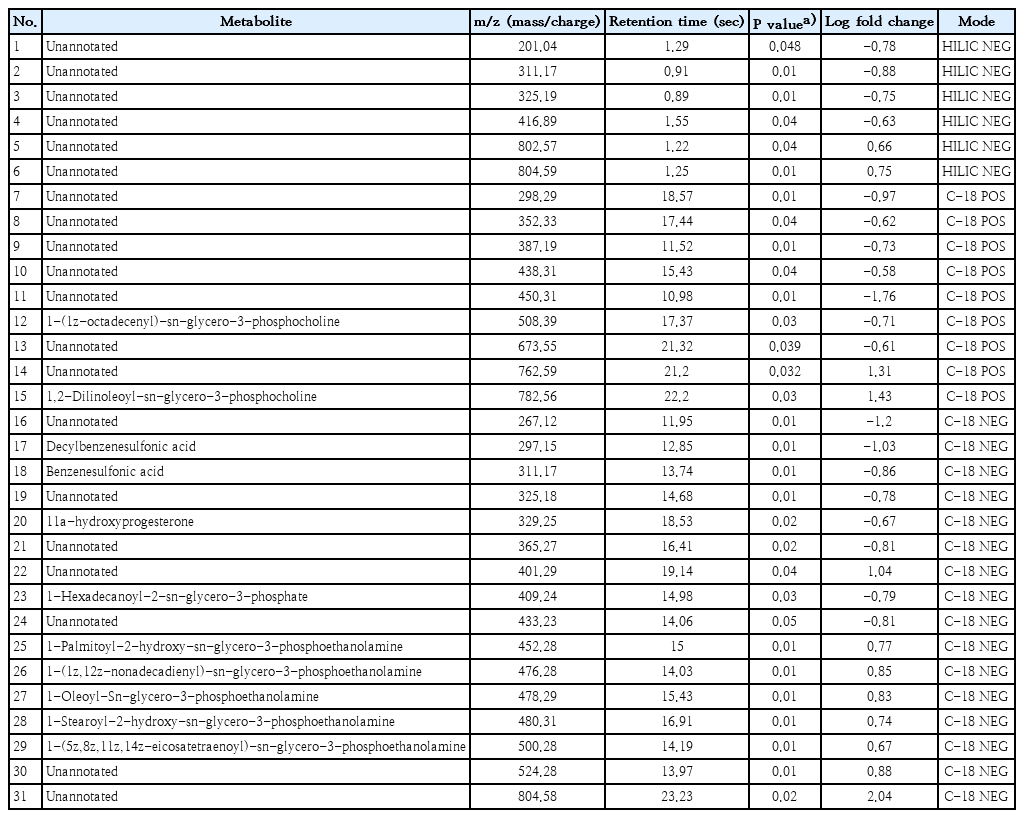
Differentially expressed metabolites in all stage 2 and 3 AKI versus healthy control groups
Phosphoethanolamine metabolites demonstrated moderate to strong positive correlations with serum creatinine (r=0.49–0.62, all P<0.01) and inverse correlations with eGFR (r=-0.48 to -0.63, P<0.01) as shown in Table 4. No significant correlations were observed between metabolite levels and urine output.
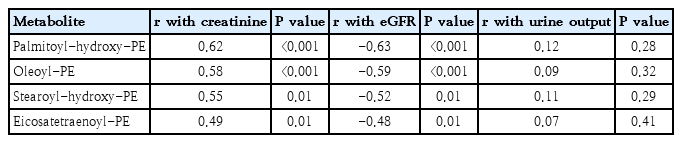
Correlation of key metabolites with creatinine, eGFR, and urine output
4. Pathway analysis
Pathway enrichment was performed in Metaboanalyst v5.0 tool [12] using differentially expressed metabolites in stage 3 AKI with a P value of less than 0.05 as shown in Supplementary Table 4. We found that glycerophospholipid, linoleic acid and alpha-linolenic acid metabolism pathways were significantly altered as shown in Fig. 2.
Graph showing significantly altered metabolic pathways in patients with stage 3 acute kidney injury versus healthy controls. The x-axis represents the impact of the pathway, while the y-axis represents the -log10 P value.
Discussion
We found that most of the significantly altered metabolites were discovered in reverse-phase chromatography (C18). Majority of them were lipids and belonged to glycerophosphoethanolamine subgroup of phospholipid class of lipids. Out of 18 differentially expressed metabolites in SA-AKI, levels of 1-palmitoyl-2-hydroxy-sn-glycero-3-phosphoethanolamine and 1-oleoyl-sn-glycero-3-phosphoethanolamine were found to be elevated exclusively in patients of SA-AKI and their intensities increased with increasing stage and severity of AKI. Thus, phosphoethanolamines can serve not only as diagnostic but also prognostic markers of SA-AKI and correlate with its severity.
A larger number of metabolites were found to be significantly altered in severe SA-AKI which included stage 2 and 3 of AKI. This can be due to the fact that certain metabolites are released into the circulation only when sufficient renal injury has occurred. Of particular interest is the fact that most of these metabolites are also phosphoethanolamines. The PERSEVERE biomarker study demonstrated that selected circulating proteins can identify children at risk for severe AKI and predict renal recovery in septic shock [13]. In our study, phosphoethanolamine levels may represent an analogous metabolite-based approach, with the potential to complement or extend protein biomarker strategies.
Phosphoethanolamines are major phospholipid constituents of cell membranes and play critical roles in membrane integrity, mitochondrial function, and lipid signalling [14]. Dysregulation of phospholipid metabolism has been described in neurodegenerative disorders and CKD [15], and our study extends these findings to pediatric SA-AKI. In a study on metabolomics in CKD, Luo et al. [16] also found a positive correlation between phosphoethanolamines and proteinuria in CKD patients. Li et al. [17] using LC-QTOF/MS for plasma lipid profiling in peritoneal dialysis patients found that phosphocholines and phosphoethanolamines were significantly increased in patients with poor volume status. Emerging literature highlights that SA-AKI is not a uniform entity but consists of biologically distinct subphenotypes with prognostic relevance [18]. In this context, phosphoethanolamine levels may help refine pediatric SA-AKI subphenotyping, potentially improving prognostication and guiding targeted therapies.
Although culture positivity and vasopressor use increased with AKI severity, no statistically significant associations were observed between specific microbial pathogens or vasopressor requirement and the annotated metabolites. Sepsis-induced AKI is known to result from a complex interplay of systemic inflammation, microcirculatory dysfunction, and metabolic stress rather than direct pathogen-specific effects [1]. Therefore, the observed alterations in phosphoethanolamine and lipid metabolic pathways likely represent a common downstream metabolic response to severe sepsis and renal injury, irrespective of the causative organism. However, these findings warrant further evaluation in larger cohorts.
The elevations in phosphoethanolamines and related lipid metabolites observed in SA-AKI are consistent with previously reported patterns of mitochondrial stress, membrane remodeling, and tubular epithelial dysfunction [19]. However, these mechanistic interpretations are hypothesis-generating rather than definitive, as untargeted metabolomics cannot establish causation. Although there is a paucity of human studies to demonstrate the same but various animal studies have elucidated the importance of disruption in fatty acid metabolism and lipid pathways in renal diseases. Ping et al. [20] also found that fatty acid metabolism pathways are significantly altered in SA-AKI and proposed malic acid, methionine sulfoxide and petroselinic acid to be potential biomarkers of SA-AKI. A systematic review done by Patschan et al. [21] compared various animal-based studies which used metabolomics to study AKI and concluded that dysregulation in lipid homeostasis was found in almost all such studies. Also, similar to the findings of our study, they found that most altered metabolites in subjects with AKI are phospholipids.
Till date the only possible management of SA-AKI is supportive therapy and renal replacement therapy. While pathway enrichment suggests perturbations in glycerophospholipid, linoleic acid, and α-linolenic acid metabolism, further studies on targeted metabolomics are required in future to validate their role. If validated, drugs targeting these metabolic pathways may be discovered in future and help in bringing our research to bedside therapeutics which can improve the mortality and morbidity associated with SA-AKI.
Since, it is already known that human untargeted metabolomic studies can annotate less than 10% of all molecular features, despite extensive mass and structure matching of the discovered metabolites, we could not annotate a majority of metabolites that we have presented with their unique m/z value [22]. With the advancement of science and technology, as more extensive databases will be created and more m/z values annotated, we might identify more of these metabolites and hence it will add to our understanding and their role in pathophysiology and therapeutics of SA-AKI.
Our findings highlight the potential of metabolomic profiling as an exploratory tool for identifying early biochemical alterations in pediatric SA-AKI. However, its diagnostic feasibility remains preliminary pending validation in larger, multicentric cohorts. Our findings demonstrate that metabolite alterations, particularly phosphoethanolamines, track closely with AKI severity, providing potential early biomarkers beyond conventional laboratory measures. If validated in larger multicenter cohorts, the identified metabolites could serve as early biomarkers for SA-AKI, allowing clinicians to intervene before irreversible renal injury occurs. Furthermore, their consistent association with AKI stage raises the possibility of using them for prognostic stratification. From a therapeutic perspective, targeting lipid metabolic pathways may represent a novel strategy for preventing or mitigating sepsis-related renal injury. Ultimately, integrating metabolomic biomarkers with conventional clinical and laboratory measures may improve early detection, staging, and therapeutic decision-making in pediatric SA-AKI.
The strengths of our study include its focus on a pediatric population, use of untargeted metabolomic profiling, and comparison across graded AKI stages, sepsis-only patients, and healthy controls. However, several limitations warrant acknowledgment. First, our study is a single-center design and modest sample size may limit generalizability and increase the possibility of type I statistical error.
Second, although we applied Sepsis-3 definitions, the subsequent publication of the Phoenix Pediatric Sepsis Score (2023) highlights the need for prospective reclassification in future studies. Third, annotation of untargeted metabolomic features remains incomplete, and only a subset of metabolites could be confidently identified. Finally, we did not perform longitudinal follow-up to assess the predictive value of metabolites for long-term outcomes, duration of hospital stay and mortality. Future multicentric validation studies in a larger and independent cohort along with targeted metabolomics on the above metabolites should be done for validation.
Supplementary materials
Supplementary Tables 1-4 are available at https://doi.org/10.3345/cep.2025.02439.
Differentially expressed metabolites in all 3 AKI stages versus healthy control groups
Responses of significantly altered metabolites among groups of patients with AKI and healthy controls
Responses of significantly altered metabolites among groups of patients with stage 2 or 3 AKI, healthy controls, and sepsis controls
Significantly altered metabolic pathways in patients with stage 3 acute kidney injury versus healthy controls
Notes
Conflicts of interest
No potential conflict of interest relevant to this article was reported.
Funding
This study received no specific grant from any funding agency in the public, commercial, or not-for-profit sectors.
Acknowledgments
We acknowledge the contribution of Dr Virendra Kumar for providing logistic support in conducting the study. This paper was awarded 1st prize at the 35th Conference of the Indian Society of Pediatric Nephrology (ISPNCON); 14-15th October, 2023 at Kolkata, India.
Author contribution
Conceptualization: AS, SS; Data curation: NC, PS, AS, SS; Formal analysis: NC, PS, SS; Methodology: NC, PS, AS, SS; Project administration: SS; Visualization: AS, SS; Writing - original draft: NC, AS, SS; Writing - review & editing: NC, PS, AS, SS