Association of macrophage migration-inhibitory factor gene and growth differentiation factor 15 gene polymorphisms and their circulating levels with respiratory distress syndrome among preterm neonates
Article information

Abstract
Background
In preterm newborns, neonatal respiratory distress syndrome (RDS) is among the main causes of respiratory failure and mortality. However, the effect of macrophage migration-inhibitory factor (MIF) on neonatal developmental lung disease is not well documented in the literature. Moreover, little is known about the effects of growth differentiation factor-15 (GDF-15) on lung maturity in preterm infants.
Purpose
To evaluate serum MIF and GDF-15 levels in preterm infants with and without RDS and analyze the genetic profile of single nucleotide polymorphisms (SNPs) for MIF rs755622 G>C and GDF-15 rs4808793 C>G
Methods
In this case-control study, 90 preterm newborns were categorized into 3 groups: group A included 30 preterm newborns with mild to moderate RDS, group B included 30 preterm newborns with severe RDS, and group C included 30 healthy preterm newborns. Enzyme-linked immunosorbent assay methods were used to measure serum MIF and GDF-15 levels. The MIF rs755622 G>C and GDF-15 rs4808793 C>G SNPs were analyzed by restriction fragment length polymorphism-polymerase chain reaction.
Results
Significantly higher median MIF and GDF-15 blood levels were noted among neonates with severe RDS (17.32 μg/L and 3.19 pg/mL, respectively) versus those with mild to moderate RDS (5.50 μg/L and 0.71 pg/mL, respectively) (P<0.05 for both). A significantly higher frequency of a mutant C-allele of MIF rs755622 G>C was noted among cases (37.5%) versus controls (13.3%) (P=0.001; odds ratio [OR], 0.256; 95% confidence interval [CI], 0.112–0.589). A significantly higher frequency of a mutant G-allele of GDF-15 rs4808793 C>G SNPs was noted among cases (49.2%) versus controls (30%) (OR, 0.443; 95% CI, 0.229–0.856).
Conclusion
These findings suggest that serum MIF and GDF-15 levels are strongly associated with RDS severity among preterm neonates. Moreover, polymorphisms of MIF and GDF-15 could be genetic risk factors for the development of neonatal RDS among preterm babies.
Key message
Question: Do macrophage migration-inhibitory factor (MIF) and growth differentiation factor-15 (GDF-15) levels and their gene polymorphisms affect RDS among preterm babies?
Finding: Significantly higher serum MIF and GDF-15 levels were observed in patients with severe respiratory distress syndrome (RDS). The mutant G- and C-alleles of GDF-15 rs4808793 C>G single nucleotide polymorphism (SNP) and MIF rs755622 G>C SNP were present at significantly higher frequencies in preterm neonates with RDS.
Meaning: MIF and GDF-15 play a significant role in neonatal RDS and its severity.
Introduction
Neonatal respiratory distress syndrome (RDS) is one of the leading causes of respiratory failure and neonatal death in premature infants, caused by a lack of pulmonary surfactant as a result of fetal lung immaturity. Identifying the molecular factors that induce RDS will result in breakthrough advances in the therapy procedure [1,2]. Polymorphisms of genes involved in lung development, alveolar stability, and pulmonary host defense are part of RDS, a multifactorial disease [3].
One major immune response regulator that contributes to the emergence of severe illnesses such autoimmune disorders, cancer, asthma, and acute RDS is macrophage migration-inhibitory factor (MIF) [4,5]. There is a dearth of literature about MIF's impact on developmental lung disorders in neonates [4]. The human MIF gene is located at chromosome region 22q11.2, which is around 800 nucleotides long and has 3 exons and 2 introns [6]. The MIF gene has 2 main polymorphisms. A functional variant (-173 G > C, rs755622) in the 5′ promoter region affects promoter activity in a cell-type-dependent way [7].
Under a variety of stressors, such as inflammation, hyperoxia, and senescence, growth differentiation factor-15 (GDF-15) which is also known as macrophage inhibitory cytokine-1, a divergent member of the transforming growth factor-β superfamily, exhibits increased expression [8,9]. For a number of lung conditions, including pulmonary hypertension and pulmonary fibrosis, the serum GDF-15 level is a promising biomarker. There hasn't been much research done on the measurement of circulating GDF-15 levels in preterm newborns and how they affect lung maturity, though [10]. The human GDF-15 gene is located on chromosome 19p12.1–13.1. GDF-15 is expressed in various organs or tissues, including the kidney, lung, and placenta, and it is expressed by various immune cells, including T cells and macrophages [9,11].
The purpose of the current study was to evaluate the circulating levels of GDF-15 and MIF in preterm newborns with and without RDS and their predictive value for clinical severity and respiratory outcomes. Furthermore, to investigate the potential correlation between the frequency and severity of RDS, and respiratory outcomes in preterm infants and the MIF rs755622 G>C and GDF-15 rs4808793 C>G single nucleotide polymorphisms (SNPs).
Methods
1. Study design and participants
Ninety preterm newborns (less than 37 weeks) were the subjects of this case-control research, which was approved by the Faculty of Medicine, South Valley University’s Ethics Committee (ethical approval code: SVU-MED-PED025-4-25-1-16). Written informed consent was received from the participant patients' caregivers. The current research has been conducted in accordance with the Declaration of Helsinki. Of these, 60 were admitted to the neonatal intensive care unit (NICU) at Qena University Hospital, and 30 were outpatient healthy preterm neonates whom their caregivers came for routine follow-up in the outpatients’ pediatric clinics. The research was conducted between January 2022 and June 2024. Three groups of preterm newborns were included in the present study based on whether they had neonatal RDS or not, and the RDS severity as follow: group A consisted of 30 preterm neonates with mild to moderate RDS. Group B contained 30 preterm newborns with severe RDS (Supplementary Table 1). As a control group, group C comprised 30 healthy preterm newborns that were matched with groups A and B for weight, sex, and gestational age (GA) and represent the control group.
Inclusion criteria: during the study period, preterm neonates with a GA of less than 37 weeks were either admitted or evaluated as outpatients in the NICU at Qena University Hospital, regardless of whether they were healthy or experiencing RDS. RDS-diagnosed neonates (identified by combining radiological evidence from a chest x-ray with clinical symptoms of respiratory distress.
Exclusion criteria: Newborns who are small for GA, have congenital defects, or have early-onset neonatal sepsis. babies of mothers who had gestational diabetes mellitus or diabetes mellitus or who have a history of chronic diseases such hypertension, autoimmune disorders, or renal failure or who experienced premature rupture of the membranes before their due date.
To attain 80% power and 5% confidence (type 1 error), we modify the sample size to be 60 patients.
2. Clinical assessment sand data collection
History from the caregivers of the included neonates was taken (model of delivery, GA, sex, birth weight, antenatal steroids, age at admission, and duration of admission).
Respiratory pattern, rate, and depth, intercostal and subcostal retraction, grunting, and auscultation for additional sounds are all used to diagnose RDS. RDS is graded using Downes’ score [12], Silverman-Anderson score [13], x-ray grading [14] (Supplementary Table 1), the type of assisted ventilation (continuous positive airway pressure, or mechanical ventilation [15], and the length of hospital stay.
3. Blood samples
Five milliliters of blood were collected from each participant and separated into 2 portions. The first portion, 2 milliliters, was transferred into tubes containing ethylenediaminetetraacetic acid (EDTA). Following a full blood count (complete blood count [CBC]), the sample was immediately frozen at -80°C until the time of genetic analysis. Meanwhile, the remaining portion (3 mL) was evacuated into a separator gel tube and centrifuged at 822 g for 15 minutes. For further biochemical assays of MIF and GDF-15 levels, the separated sera were split into aliquots using 1-mL cryotubes and stored at -20°C.
4. Hematological and biochemical assays
Abbott Diagnostics' Cell Dyn 1800, Germany was used to measure the complete blood counts. The enzyme-linked immune-sorbent assay (ELISA) multiskan EX micro-platephotometer (STAT FAX-2100; Thermo Scientific, USA) was used to evaluate the levels of serum MIF and GDF-15. A commercial ELISA assay kit from Chongqing Biospes Co., Ltd. (China) was used (Catalogue No. BEK1151, and BEK1290 respectively). The sandwich ELISA technology served as the basis for the applied ELISA technique.
5. DNA extraction and genetic testing of MIF (rs755622 G>C ) and GDF-15 (rs4808793 C>G) SNPs
Following the manufacturer's instructions, genomic DNA was extracted from whole EDTA blood samples using the G-spinTM Total DNA Extraction Kit (iNtRON Biotechnology, Inc., Korea). Following that, the DNA samples were kept at -80°C until genetic analysis.
In accordance with previous methods, the restriction fragment length polymorphism-polymerase chain reaction (PCR) approach was carried out to detect MIF (rs755622 G>C) and GDF-15 (rs4808793 C>G) SNPs utilizing certain primer sequences as follow: The forward primer was 5′-CT CAAACACACAAGCTCACGCATGCG-3′ and the reverse primer was 5′-ACCACTGTGGTCCCGCCTTTTGTGAC-3′ [16], and the forward primer was 5′- GCAACAGAGCGAGACTC CA-3′, and the reverse primer was 5′-CCACGCCGGTCGGATTAAAACT-3′ [17], respectively. One microliter of each primer, one microliter of genomic DNA (~100 ng/mL), 10 μL of 2X Prime Taq Premix, and 7 μL of dd H2O were added into every 0.20-mL reaction. The PCR condition for MIF (rs755622 G>C) were as follow: 5 minutes of initial denaturation at 95°C, 30 cycles of denaturation at 95°C for 30 seconds, 30 seconds of annealing at 67°C, 30 seconds of extension at 72°C, and 5 minutes of final extension at 72°C which will yield PCR amplification products at 439 bp (Fig. 1A), while for GDF-15 (rs4808793 C>G) were as follow: 35 cycles of the following temperature profile and 10 minutes of initial denaturation at 94°C: 5 minutes for the last extension, 30 seconds at 94°C, 30 seconds at 65°C, and 30 seconds at 72°C, which will yield PCR amplification products at 665 bp (Fig. 2). FastDigest AluI (FD0014, Lot:00147479, Thermo Fisher Scientific, USA) was used for digestion of the PCR amplification products (10 μL) of rs755622, while The PCR products of rs4808793were digested using a restriction enzyme (AlwNI), which was provided by New England Biolabs and has catalogue number R0514S. The final digestion products were separated on 2.0% agarose gels, then stained with ethidium bromide and observed under ultraviolet light. The band size pattern of various genotypes of the studied SNPs were as follow: for MIF (rs755622 G>C), wild homozygous GG (produces bands at 439 bp), mutant homozygous CC (produces bands at 255, and 184 bp), and mutant heterozygous GC (produces bands at 439 bp, 255, and 184 bp) as showed in (Fig. 1B); while for GDF-15 (rs4808793 C>G), The CC genotype of the wild samples displayed an intact band on the 665 region, while the heterozygous mutant genotype (CG) produced 3 distinct bands on the 665, 422, and 243 bp regions, while the mutant homozygous (GG) showed 2 distinct bands on the 243-bp and 422-bp regions (Fig. 2).
Gel electrophoresis of PCR amplification and digestion products of MIF (rs755622 G>C) single nucleotide polymorphism using the restriction fragment length polymorphism-polymerase chain reaction method; numbers refer to lanes. (A) Lane 1 shows a 50- bp DNA ladder; lanes 2–6 represent undigested PCR amplification products (band 439 bp long). (B) Lanes 1 and 12 show 50-bp DNA ladders; lanes 4–6 and 8–11 show the wild homozygous GG genotype (band 439 bp long); lanes 3 represents mutant heterozygous GC genotypes (bands 439 bp, 255 bp, and 184 bp long); lanes 2 and 7 show the mutant homozygous CC genotype (bands 255 bp and 184 bp long). MIF, macrophage migration-inhibitory factor; PCR, polymerase chain reaction.
Gel electrophoresis of polymerase chain reaction amplification and digestion products of GDF-15 (rs4808793 C>G) single nucleotide polymorphism using the restriction fragment length polymorphism-polymerase chain reaction method; the numbers refer to lanes. Lane 1 shows a 100-bp DNA ladder; lanes 6–8 represent undigested polymerase chain reaction amplification products (length, 665 bp). Lanes 2 and 3 show mutant heterozygous CG genotypes (bands at 665 bp, 422 bp, and 243 bp), while lanes 4 and 5 show the wild homozygous CC genotype (bands at 665 bp). GDF-15, growth differentiation factor-15.
6. Statistical analysis
IBM SPSS Statistics ver. 26.0 (IBM Co., USA) was used to analyze the data. The Shapiro-Wilk and Kolmogorov-Smirnov tests of normality were conducted. While continuous data were expressed as mean±standard deviation (SD) or median and interquartile range, categorical data were defined by number and percentage. To compare categorical variables, the chi-square test was used. The independent samples t test for parametric data and the Mann-Whitney U test for nonparametric data were used to identify differences between each of the 2 groups. Pearson and Spearman correlation coefficients are used for studying the correlation in parametric and nonparametric data respectively. The Hardy-Weinberg equation was followed by the SNPs under study. A statistically significant result was defined as a 2-tailed P<0.05.
Results
1. Baseline characteristics of the studied groups
For the cases and control groups, the mean±SD GAs were 32.68±2.02 weeks and 33.00±2.35 weeks, respectively. Additionally, there were 15 males (50%) to 15 females (50%) in the control group and 30 males (50%) to 30 females (50%) in the cases group. Additionally, the study groups' mean±SD weight values were 2.04±0.31 kg for the control group and 2.04±0.36 kg for the patients. Weight, sex distribution, and GA were all matched between cases and controls, as seen by the negligible discrepancies between the 2 groups, P>0.05 for all. 29 patients (48.3%) did not receive prenatal steroids, whereas 31 patients (51.7%) did. Eight of the control group (26.7%) did not receive prenatal steroids, whereas 22 (73.3%) did, with a considerably higher percentage than in the cases (P=0.049). When comparing several CBC values between patients and controls, the following were found to be substantially lower in cases than in controls: White blood cells (WBCs), lymphocytes, and platelets, all of which had P<0.05: The study groups' mean WBC±SD values were 9.01±3.94 ×10³/μL for the case group and 13.18±2.71 ×10³/μL for the control group. The study groups' mean±SD lymphocyte counts were 3.58±1.65 ×10³/μL for the patients and 6.45±2.76 ×10³/μL for the controls. The study groups' mean± SD platelet counts were 344.6±62.08 ×10³/μL for the control group and 229.85±103.73 ×10³/μL for the patients. There were insignificant differences between cases and controls regarding to the remaining CBC parameters (hemoglobin, neutrophils count %, and lymphocyte %), P>0.05 for all (Table 1).
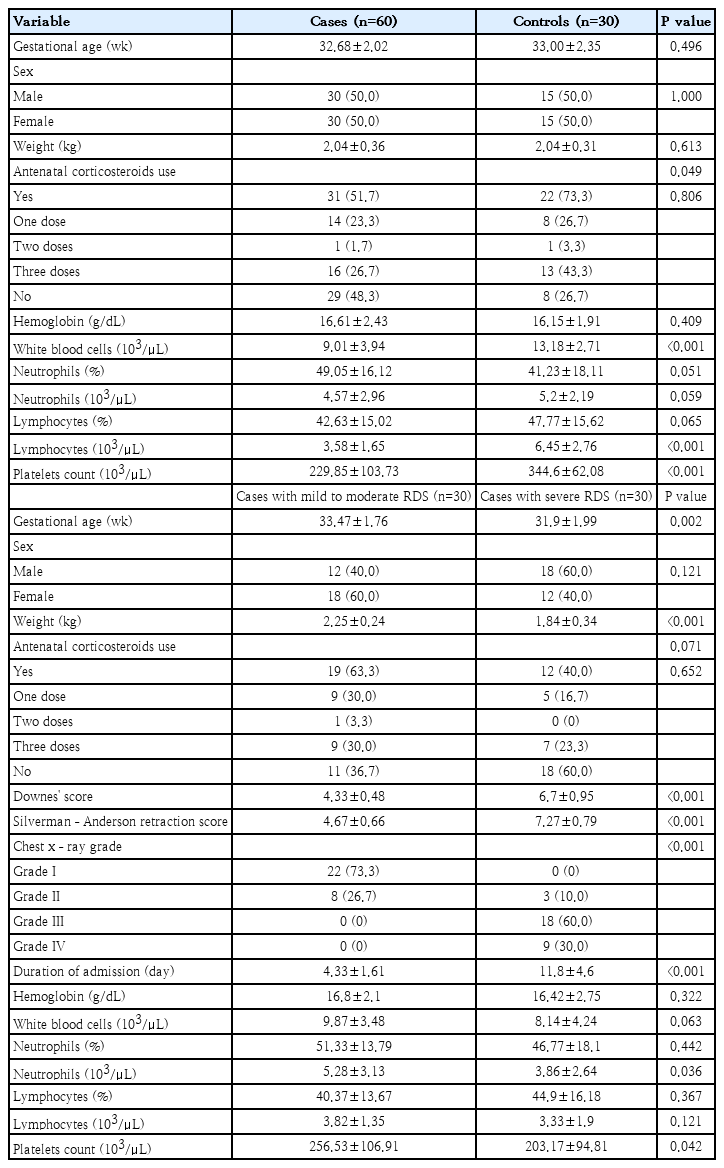
Demographic, clinical, and routine laboratory data by study group
When comparing the 2 patients subgroups, those with mild to moderate RDS (group A) versus those with sever RDS (group B), there were significantly lower mean GA and weight among group B (31.9±1.99 weeks, and 1.84±0.34 kg, respectively) compared to group A (33.47±1.76 weeks, and 2.25±0.24 kg, respectively), P<0.05 for both. 60% of group A were females, while 60% of group B were males. There was insignificant difference between the 2 patients groups regarding the history and number of doses of antenatal steroids, P>0.05. The mean value of Downes' score and Silverman-Anderson retraction score were significantly higher among group B (6.7±0.95 and 7.27±0.79, respectively) than in group A (4.33±0.48 and 4.67±0.66, respectively), P<0.001 for both. Regarding chest x-ray grading of RDS, grades III and IV were only presented in group B, while grade I was only presented in group A with significantly higher percentage of grade II among group A compared to group B (P<0.001). There was significantly longer mean duration of NICU admission among group B (11.8±4.6 days) than in group A (4.33±1.61), P<0.001. Regarding CBC parameters, there was only significantly lower mean value of neutrophils count among group B (3.86±2.64) compared to group A (5.28±3.13), P=0.036, with insignificant differences between the 2 groups regarding the other CBC parameters, P>0.05 for all (Table 1).
2. Circulating levels of macrophage MIF and GDF-15 among the study groups
There was insignificantly higher median value of MIF (μg/L) among cases (11.7) compared to the controls (11.00), P=0.581 with significantly higher median MIF blood levels among patients group B (17.32) compared to patients group A (5.50), P<0.001. Serum GDF-15 levels (pg/mL) showed insignificant differences between cases and controls (P=0.774), and its median level was significantly higher in patients group B (3.19) than in patients group A (0.71) (P=0.021) (Table 2).
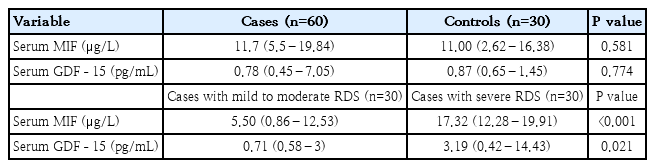
Serum levels of MIF and GDF-15 by study group
3. Correlation analysis of circulating MIF and GDF-15 levels with clinical, radiological and CBC parameters of the included patients
There was significantly positive correlation between serum MIF levels and each of serum GDF-15 levels (r=0.563, (P<0.001) as showed in (Fig. 3A), and radiological severity of RDS (r=0.393, P=0.002) among preterm neonates with RDS (Fig. 3B). Lack of any significant associations between each of MIF or GDF-15 blood levels with GA, weight, Downes' score and Silverman-Anderson retraction score, duration of admission, and various CBC parameters, P>0.05 for all.
Correlation analysis among included preterm neonates with respiratory distress syndrome. (A) Positive association between serum MIF and GDF-15 (r=0.563, P<0.001). (B) Positive correlation between serum MIF and chest x-ray grade (r=0.393, P=0.002). GDF-15, growth differentiation factor-15; MIF, macrophage migration-inhibitory factor.
4. Genotypes and alleles frequencies of MIF rs755622 G>C and GDF-15 (rs4808793 C>G) SNPs among the study groups
The frequencies of mutant homozygous (CC) and mutant heterozygous (GC) genotypes of MIF rs755622 G>C SNP were significantly higher among cases (11.7% and 51.7%, respectively) compared to the controls (6.7% and 13.3%, respectively), with significantly higher frequency of wild homozygous (GG) genotype among controls (80.0%) in comparison with the cases (36.7%), P<0.001for all. Furthermore, there was significantly higher frequency of mutant C-allele among cases (37.5%) compared to the controls (13.3%), P=0.001 indicating that C-allele could be considered as a genetic risk factor for RDS among preterm neonates with odds ratio (OR)=0.256 and 95% confidence interval (CI), 0.112–0.589 (Table 3). There were insignificant differences regarding both genotypes and alleles frequencies of MIF rs755622 G>C SNP in preterm neonates with mild to moderate RDS compared to those with severe RDS, P>0.05 for all. This indicates lack of MIF rs755622 G>C SNP with the severity of RDS among preterm neonates. Also, there were insignificant differences regarding the median MIF blood levels in terms of genotypes of MIF rs755622 G>C SNP among the included patients, P>0.05 for all.
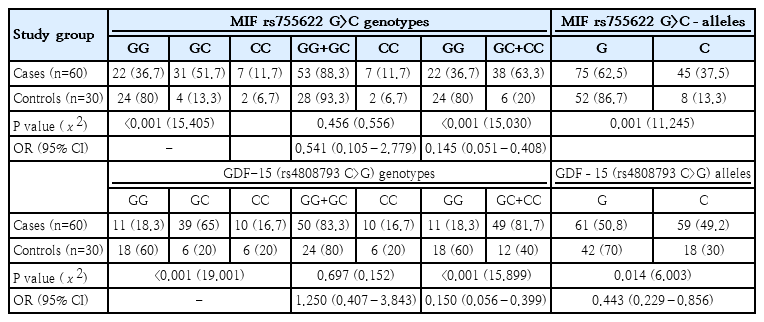
Genotype and allelic frequencies of MIF rs755622 G>C and GDF-15 rs4808793 C>G single nucleotide polymorphisms by study group
Regarding to GDF-15 (rs4808793 C>G SNP, there were significantly higher frequency of mutant heterozygous (CG) genotype among cases (65.0%) compared to the controls (20.0%) with significantly higher frequency of wild homozygous (CC) genotype among controls (60.0%) compared to the patients (18.3%), P<0.001. Additionally, there was significantly lower frequency of normal C-allele among cases (50.8%) compared to the controls (70.0%), P=0.014 with higher frequency of mutant G-allele among cases (49.2%) in comparison with the controls (30.0%), indicating that G-allele could be considered as a genetic risk factor for RDS among preterm neonates with OR=0.443 and 95% CI, 0.229–0.856 (Table 3). There were insignificant differences regarding both genotypes and alleles frequencies of GDF-15 (rs4808793 C>G SNP when comparing preterm neonates with mild to moderate RDS versus those with severe RDS, P>0.05 for all. This indicates lack of GDF-15 (rs4808793 C>G SNP with the severity of RDS among preterm neonates. Also, there were insignificant differences regarding the median GDF-15 blood levels in terms of genotypes of GDF-15 (rs4808793 C>G SNP among the included patients, P>0.05 for all.
Discussion
Neonatal RDS remains a major cause of morbidity and mortality in preterm infants, despite the fact that therapeutic options such as antenatal corticosteroids (ACS), surfactants, and effective respiratory care for the newborn have improved outcomes for babies with the condition. It is essential to comprehend the pathophysiology of this illness in order to reduce morbidity as well as mortality [1]. Although their involvement in the pathophysiology of RDS is unclear, there is emerging agreement that intrauterine proinflammatory cytokines most likely play a significant role in the development of chronic pulmonary problems. While certain research has indicated elevated levels of proinflammatory cytokines in RDS, most of these investigations have contrasted the cytokine levels in RDS with those of healthy newborns. Few insufficient studies have been reported the levels of inflammatory cytokines measured right after birth and the severity of RDS [5,18]. Given the evidence of these associations, early anti-inflammatory therapy may be able to halt the progression of symptoms.
In the current study, there was significantly lower use of ACS among cases with RDS compared to the controls. Research indicates that utilizing ACS can lower the risk of RDS in preterm newborns. Our findings were consistent with a research study by Uggioni et al. [19] that found favorable evidence that corticosteroid administration is helpful in lowering the risk of RDS in pregnant women at risk of preterm birth. Furthermore, a single course of prenatal corticosteroids to speed up fetal lung maturation in women at risk of preterm birth has been shown to lower the risk of perinatal death, neonatal death, and RDS [20]. These results were somewhat consistent with a study by Kong et al. [21] that found that the ACS group experienced a lower incidence of RDS and mild RDS than the no-ACS group.
When compared to cases of RDS with assisted ventilation (group B), the GA and weight of cases of RDS with nasal O2 (group A)was significantly higher in the current study. This suggests that the severity of RDS and the requirement for assisted ventilation are inversely correlated with GA and weight. Our findings concurred with a research study by Sun et al. [22] that found that the rates of ventilator and pulmonary surfactant requirements were similarly in term and very preterm infants but much lower in late preterm infants. Furthermore, we concurred with a study conducted by Aslamzai et al. [23], which found that the most significant risk factor for neonatal RDS is GA, and that the severity of the condition increases as an infant's GA decreases. Furthermore, Abilbayeva et al. [24] and Shin et al. [25] found that when birth weight decreased, the risk and severity of RDS significantly increased.
Compared to cases of RDS with assisted ventilation, the included cases of RDS with nasal O2 in the current study had significantly lower values for Downes' score, Silverman-Anderson retraction score, x-ray grade, and length of NICU stay. According to Shashidhar et al. [26], the severity and necessity of ventilation are determined by the absolute values of the Downes score and the Silverman-Anderson retraction score (if either score is greater than 6). Furthermore, chest x-ray is still required to determine the severity of suspected NRDS, according to Silveira Neves et al. [27].
Concerning the CBC parameters (hemoglobin, WBCs, neutrophils, lymphocytes, and platelets) in each study group, preterm infants with RDS (case group) had lower WBCs, lymphocytes, and platelets than the control group; however, there was no statistically significant difference between the case and control groups in terms of other CBC parameters (hemoglobin, neutrophils, or lymphocytes %). Additionally, there were significantly higher neutrophils and platelets counts among the included cases of RDS with nasal O2 compared to cases of RDS with assisted ventilation.
Our findings concurred with a research study by Tigabu Kebede et al. [28] that found that lower WBCs and platelets counts were significantly associated with RDS among the included babies. Furthermore, a research study by Marseglia et al. [29] found that RDS newborns had significantly less lymphocytes (count) than the control group. Also, a study by Zeng et al. [30] found that preterm newborns with RDS particularly those with severe form had a significantly lower platelet count. In RDS, thrombin and plasmin deposition in the alveolar space causes platelets and neutrophils to chemotact and aggregate during the development of the hyaline membrane. Platelet consumption results in thrombocytopenia [31].
There is little solid evidence supporting MIF's useful function in the pathogenesis of developing newborn lung disorders. In animal research, MIF was found to be involved in lung maturation [32]. The current research revealed that although serum MIF levels did not significantly differ among preterm babies with or without RDS, there were significantly higher MIF levels among preterm babies with severe RDS compared to those with mild to moderate RDS with significant positive correlation with the radiological severity of RDS. In agreement with our findings, Bayraktar et al. [2] who found that newborns with RDS had higher levels of MIF in their cord blood compared to those without RDS suggesting that MIF expression starts before the preterm infants are born and that MIF has a positive effect on the development of their lungs. In consistence with our findings, Park et al. [4] observed elevated plasma MIF levels were considerably linked to premature birth. Mohany et al. [33] also reported similar findings regarding cord blood MIF levels.
A promising biomarker for a number of lung conditions, including pulmonary hypertension and pulmonary fibrosis, is the serum GDF-15 level. There are few researches done on the relationship between circulating GDF-15 levels in preterm newborns and their ability to predict respiratory outcomes. Senescence, inflammation, and hyperoxia all cause an increase in the production of the stress-responsive cytokine GDF-15 [10]. We found in the present study significantly higher serum GDF-15 among preterm babies with severe RDS compared to those with mild to moderate RDS with insignificant differences when comparing preterm neonates with RDS versus those without. In agreement with our findings, Almudares et al. [10] reported recently a strong correlation between lower serum GDF-15 levels and greater GA, and higher GDF-15 levels were significantly linked to longer hospital stays, longer respiratory support requirements, and a longer need for mechanical ventilation. According to numerous studies, factors that raise the risk of preterm birth may result in greater levels of maternal and placental GDF-15 [34,35].
Although it was reported that GDF-15 inversely regulates MIF in atherosclerosis which is chronic inflammatory in the arterial wall with deposition of inflammatory cells mainly macrophages, lipids, and fibrous elements [36], in the current work, we firstly observed a significantly positive correlation between serum MIF levels and serum GDF-15 levels among the included preterm neonates with RDS. Despite having similar oxidative stress and inflammation related to macrophages, the 2 diseases have different pathophysiologies.
Finding potential genes linked to preterm neonatal RDS vulnerability is difficult, particularly because various populations have varying frequencies. MIF's crucial role in the pathophysiology of neonatal RDS is highlighted by its upstream function in the host inflammatory response as well as the significance of immunological stimuli and cytokines in early lung development [37]. Ferroptosis-related genes may be linked to lung conditions, according to recent bioinformatics analysis. GDF-15 is essential for both the process of ferroptosis and the emergence of inflammation [38]. No previous studies could be traced in literature regarding the possible link between MIF rs755622 G>C and GDF-15 (rs4808793 C>G) SNPs and RDS among preterm neonates. Interestingly, we observed significant association of mutant homozygous (CC), mutant heterozygous (GC) genotypes, and mutant C-allele of MIF rs755622 G>C SNP, and mutant heterozygous (CG) genotype, and mutant G-allele of GDF-15 (rs4808793 C>G SNP with RDS among preterm neonates and could be considered as genetic risk factor for development of RDS. Significant variations in lung maturation were observed in MIF gene-deficient mice versus wild MIF gene-controls during the early saccular period, which is when human newborns are most at risk for RDS, according to Kevill et al. [37].
We could not detect significant association of the 2 studied SNPs with either the severity of RDS or the blood levels of their circulating protein products which may need future larger scale studies to confirm these findings.
Single center study, relatively small sample size, and lack of recruitment of term neonates with RDS were the main limitations of the current study.
In conclusion, the results of this study suggest that MIF and GDF-15 may be significantly correlated with the severity of RDS in preterm infants, with both biomarkers showing a strong positive correlation with each other. Furthermore, although they are not linked to the severity of RDS in preterm newborns, the mutant G-allele of GDF-15 (rs4808793 C>G SNPs) and the mutant C-allele of MIF (rs755622 G>C) may be relevant genetic risk factors for the development of RDS.
Supplementary materials
Supplementary Table 1 is available at https://doi.org/10.3345/cep.2025.00416.
Classification of the severity of respiratory distress syndrome (RDS) among preterm neonates
Notes
Conflicts of interest
No potential conflict of interest relevant to this article was reported.
Funding
This study received no specific grant from any funding agency in the public, commercial, or not-for-profit sectors.
Author Contribution
Conceptualization: MHH, EAAE, AHB; Data curation: MHH, EAAE, AHB, MAAS, AAMA; Formal analysis: MHH, EAAE, AHB, MAAS, AAMA, KAAE; Funding acquisition: MHH, EAAE, AHB, MAAS, AAMA, KAAE; Methodology: MHH, EAAE, AHB, MAAS, AAMA, KAAE; Project administration: MHH, EAAE, AHB, AAMA, KAAE; Visualization: MHH, EAA-E, AHB, MAAS, AAMA, KAAE; Writing - original draft: MHH; Writing - review & editing: MHH, EAAE, AHB, MAAS, AAMA, KAAE