Effect of 2–6 weeks of systemic steroids on bone mineral density in children
Article information

Abstract
Background
The use of systemic steroids for 6+ weeks in children is associated with decreased bone mineral content (BMC) and density (BMD). However, the effects of a shorter duration of use on BMD are unknown.
Purpose
To determine the effect of the use of systemic steroids for 2–6 weeks on BMD and BMC in pediatric patients.
Methods
Twenty-five pediatric patients (21 with tuberculosis, 2 with systemic juvenile idiopathic arthritis, 1 with inflammatory bowel disease, 1 with autoimmune hemolytic anemia) who received systemic steroids for 2–6 weeks and 25 age- and sexmatched controls were enrolled. BMC, BMD, and z scores of the whole body (WB), lumbar spine (LS), nondominant distal radius (DR), and total body less the head (TBLH) were determined by dual-energy x-ray absorptiometry at baseline, the end of steroid therapy or 6 weeks (whichever was earlier; first follow-up), and at the end of 3 months from baseline (second follow-up) in patients and at baseline in controls. The values were adjusted for confounding variables. Continuous and categorical variables were compared using Student t test and the chi-square test or Fisher exact test, respectively. Pairwise comparisons employed Bonferroni correction.
Results
Statistically significant decreases in BMC, BMD, and all z scores were observed. BMC declined by 5.37%, 2.08%, 1.82%, and 2.27%, and 11.42%, 3.75%, 3.34%, and 4.17% for WB, LS, DR, and TBLH, respectively, at the first and second follow-ups, respectively. Similarly, BMD declined by 2.01%, 2.31%, 2.18%, and 1.70% and 4.59%, 3.76%, 3.14%, and 3.50% for the WB, LS, DR, and TBLH, respectively, at the first and second follow-ups, respectively. A significant negative correlation was found among bone densitometric parameters, duration, and cumulative dose.
Conclusion
The use of systemic steroids for 2–6 weeks in pediatric patients decreased the BMD and BMC of trabecular and cortical bones, an effect that persisted after discontinuation.
Key message
Question: Does steroid use for 2–6 weeks in children affect bone mineral content (BMC) or density (BMD)?
Finding: Steroid use for 2–6 weeks significantly decreased BMC and BMD of the whole body, total body less the head, lumbar spine, and distal radius. A significant negative correlation was observed among BMD, duration, and cumulative dose.
Meaning: Steroid use for 2–6 weeks in children negatively affected BMC and BMD.
Graphical abstract.
Introduction
Glucocorticoids are important regulators of diverse physiological systems and are often used in the treatment of a number of inflammatory, autoimmune, and neoplastic diseases in children. The long-term use of glucocorticoids is associated with several side effects like growth retardation, hyperglycemia, hirsuitism, cataract, osteoporosis etc [1].
Bone mass accrual is best assessed by measuring bone mineral density (BMD). Dual-energy x-ray absorptiometry (DEXA) is currently the preferred method for measuring BMD in children, due to its speed, accuracy, safety, and economy. In the pediatric age group, the recommended sites for DXA scans are lumbar spine, total body or total body less head, and if required distal 1/3 radius [2,3]. In special circumstances, proximal femur may be scanned [2]. The report of DXA scan included bone mineral content (BMC), areal BMD (aBMD), and aBMD z score and analyzed in context with age, sex, weight, height, pubertal stage, and body mass index (BMI) [2,3].
Few studies have been published on the effect of systemic steroids of duration varying from 6 weeks to 2 years on BMD in children with inconsistent results.
Most of the studies have been cross sectional and done in patients with Nephrotic syndrome (NS), juvenile idiopathic arthritis (JIA), and systemic lupus erythematosus (SLE). Some of these studies reported negative effect of cumulative dose of corticosteroids on BMD of lumbar spine in all categories of NS [4-6], maximum decrease in steroid-dependent NS followed by frequently relapsing or infrequently relapsing NS and steroid-sensitive NS. In contrast, Mishra et al. [7] did not show any effect of cumulative dose of glucocorticoids on BMC, BMD, and z score in steroid-sensitive NS while another reported increase in cortical BMD z score of tibia and decrease in trabecular BMD [8]. Similarly many studies reported decreased BMD in patients with JIA who received systemic steroids for a duration ranging from 3 months to 2 years [9-13] whereas the study by Kashef et al. [14] did not find any association between cumulative dose of steroids and BMD of femoral head and LS in JIA patients.
Very few longitudinal studies have been done in children with promising results. Trapani et al. [15] in patients with SLE reported decrease of 3.4% in BMD of LS after 1 year of steroid therapy. Decrease in BMD z score has also been reported in NS patients who received steroids for 3 months or more [16-18]. A longitudinal study of 6 months on patients who received systemic steroids of a period of 6–12 weeks, reported a gradual decline in BMD of WB, TBLH, LS, and DR [19].
No study has been reported where the effect of steroids of 2 to 6 weeks duration on BMC and BMD has been evaluated, hence this study was planned to determine the effect of use of systemic glucocorticoids of 2 to 6 weeks duration on BMD in children.
Methods
A longitudinal observational study was conducted in the Department of Pediatrics and Radio-diagnosis, in a tertiary care medical institution, New Delhi, India from 1st November 2018 to 30 April 2020 after obtaining permission from the Institutional Ethics Committee (No. 893 dated 24th October 2018). All the study subjects' caregivers gave the informed consent prior to the enrolment in the study and assent was given by adolescents
1. Sample size
The sample size was calculated on the basis of a study by Trapani et al. [15] in 20 patients of juvenile SLE who received steroids for 1 year. In this study, the mean difference in BMD at 2-point interval was 0.031. Since the standard deviation (SD) of the mean difference of 2 value at 2 times interval was not provided in this study, hence for calculation of the sample size a SD of the mean difference of 0.05 was assumed. To detect mean difference of 0.031 and with a SD of the mean difference of 0.05, alpha error of 0.05, beta error of 2, the sample size determined was 25.
2. Inclusion/exclusion criteria
Patients less than 18 years of age, who received systemic steroids for a duration of 2 to 6 weeks were enrolled for the study. Equal number of age- and sex-matched healthy children of hospital staff and nurses were taken as controls. Children suffering from chronic renal, liver, and endocrine diseases, malnutrition, malabsorptive disorders, rickets, and children receiving glucocorticoid as replacement therapy were excluded.
Informed written consent was obtained from parents or guardians and assent obtained where ever necessary.
3. Data collection
The anthropometry, biochemical parameters, BMC, BMD, z score, and x-ray lumbar spine-anteroposterior and lateral views were done and recorded in a predesigned proforma, at baseline, at the first follow-up (end of steroid therapy or at 6 weeks, whichever was earlier) and second follow-up at the end of 3 months from baseline in cases and at baseline only in controls.
The data recorded at baseline were name, age, sex, diagnosis, weight, height, BMI, Tanner sexual maturity rating (SMR) stage, date of start of steroid, dose of steroid received per day, date of stoppage of steroid, total duration, and cumulative dose of steroid received by each patient. In addition, daily dietary calcium and vitamin D intake, frequency of weight-bearing physical activity per week, daily sunlight exposure were obtained as per the method described by Dey et al. [13]. The patients were advised to take adequate dietary calcium and vitamin D or were supplemented if deficient. Fully ambulatory patients were also advised to have adequate sunlight exposure and do weightbearing physical activity of 1 hour per day at home. Adequacy of intake of calcium (800–1,000 mg/day) and vitamin D (600 IU/day), sunlight exposure and frequency of weight-bearing exercise per week were assessed every week by direct questioning.
Biochemical parameters included serum calcium, serum phosphorous, alkaline phosphatase (ALP) - measured by an automated analyzer; (Clinical Chemistry Analyzer AU 680, Beckman Coulter, Brea, CA, USA); 25(OH) vitamin D3, and parathyroid hormone (PTH) were estimated by an automated machine (Vitros ECiQ immunodiagnostics, Ortho Clinical Diagnostics, Johnson & Johnson, Irvine, CA, USA) by enzyme-linked immunosorbent assay using chemiluminescence technique. Reference range of normal levels of 25(OH) vitamin D3 was 40–145 mmol/L and PTH 14–75 pg/mL. Any subject found deficient in serum vitamin D3 level was treated with injection 600,000 IU vitamin D3 intramuscularly once.
Prednisolone equivalent of the steroid was calculated if the patient received systemic steroid other than prednisolone, for determination of the cumulative dose of steroid. For calculation purpose, the duration of prednisolone treatment was taken as, till the time a patient received the dose of prednisolone higher than the physiological dose (i.e., 2.5 mg/m2/day) [20].
BMC, BMD, and z score were determined at 4 skeletal sites (whole body [WB], distal radius [DR], lumbar spine [LS], and total body less head [TBLH]). A HOLOGIC (Discovery QDR series S/N 84571, Hologic Inc., Marlborough, MA, USA) bone densitometer was used to perform the DEXA scan on patients and controls and APEX System Software ver. 3.1 was used for data acquisition and derivation of areal BMD. DEXA scans were performed at following 3 sites on each of the patients and controls - WB, posteroanterior lumbar spine, and nondominant DR. TBLH BMC and BMD were derived as per the method described by the International Society of Clinical Densitometry [3].
Subject positioning was done as per the manufacturer’s guidelines. BMC and areal BMD (aBMD) values were obtained as a machine-generated printed report for each of the above skeletal sites. BMC was expressed as g and aBMD as g/cm2.
Z score of BMD at each skeletal site was determined by using the formula [13]:
Measured BMD at specific skeletal site minus mean BMD of control population divided by SD of BMD of control population.
X-rays of LS spine of the patients (both anteroposterior and lateral views) were done along with DEXA scans to look for any asymptomatic vertebral fracture.
4. Statistical analysis
Continuous variables were presented as mean with SD or median with interquartile range (IQR) and categorical variables as frequency with proportions. Scale variables between cases and controls were compared using Student t test. Chi-square/Fisher test was used for determining statistical significance between qualitative variables. Multiple linear regression analysis was used for identification of factors associated with BMD. Thereafter, mixed method repeated measures analysis of variance was used for detection of associated factors over time for different bone densitometric variables. Within subject pair wise comparison over the follow-up period for different parameters was done using Bonferroni correction. The P value less than 0.05 was considered as statistically significant. The IBM SPSS Statistics ver. 22.0 (IBM Co., Armonk, NY, USA) was used for entire analysis. The Pearson correlation coefficient was applied to find correlation between bone densitometric data and cumulative dose and duration of steroid.
Results
In this study, 25 patients were included who were on systemic glucocorticoids of 2 to 6 weeks duration. Out of the 25 cases, 21 were of tuberculosis (17 tubercular meningitis [TBM] - 14 stage II, 3 stage III, and 4 disseminated tuberculosis), 2 of systemic onset juvenile idiopathic arthritis (SOJIA), one each of inflammatory bowel disease, and autoimmune hemolytic anemia. Twentyfive age- and sex-matched healthy controls were also enrolled. The range of age of both cases and controls was 6 to 16 years with a median age of 12 years (IQR, 8–14 years). The sex distribution in study sample consisted of 40% males and 60% females among both cases and controls. The mean height SDS, mean weight SDS, and mean BMI SDS of controls were higher as compared to cases, the difference being statistically significant for mean weight and BMI SDS (Table 1). Most of cases belonged to Tanner stage II (44%) and Tanner stage III (40%), whereas in controls 52% belonged to Tanner stage III and 32% in Tanner stage 1. Mean serum calcium, phosphorus, and serum 25(OH) vitamin D3 levels were significantly lower in cases as compared to controls. There was no statistically significant difference in mean serum PTH level between cases and controls. The mean serum ALP level was found to be insignificantly high among controls as compared to cases (Table 1). The mean daily dietary intake of calcium and vitamin D, daily sun light exposure and weekly weight-bearing physical activity were lower in cases as compared to controls (Table 2).
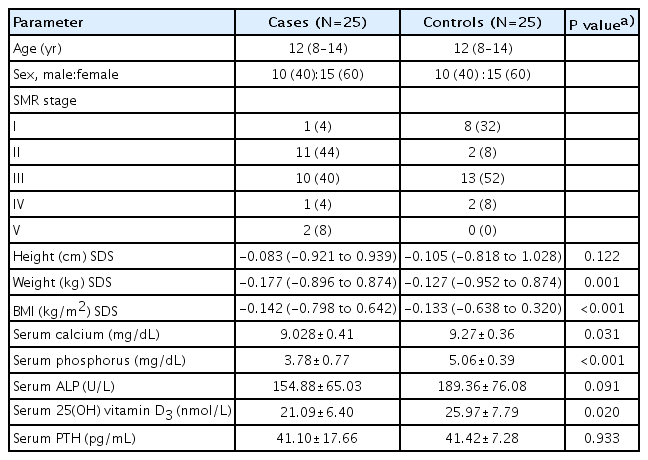
Comparison of baseline demographic variables, anthropometric parameters, and biochemical indices between cases and controls
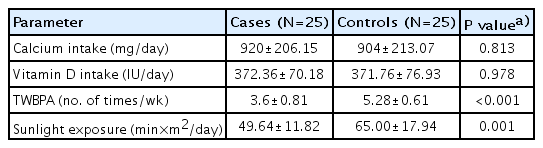
Comparison of baseline daily dietary calcium, vitamin D intake, total weekly weight-bearing physical activity, and daily sunlight exposure among cases and controls
Serum vitamin D3 levels were found to be deficient (<20 nmol/L) in 12 cases of which 5 were TBM stage II, 3 TBM stage III, 2 disseminated TB, and 1 SOJIA. Vitamin D3 level was also deficient in 4 controls. The cases and controls with vitamin D deficiency were treated with intramuscular injection of 600,000 IU vitamin D once.
In cases, there was a significant increase in weight SDS (-1.12 at baseline to -0.99 at 2nd follow-up, P=0.000) as well as BMI SDS (-0.99 at baseline to -0.67 at 2nd follow-up, P=0.000) but increase in height SDS was insignificant (-0.83 to -0.98, P=0.365). The levels of all the biochemical parameters were in normal range at the follow-ups. Mean levels of serum calcium and serum phosphorus were 9.028 mg/dL and 3.78 mg/dL at baseline and 9.04 mg/dL and 4.18 mg/dL at second follow-up. Similarly, the mean serum levels of vitamin D and PTH were 36.74 nmol/L and 38.8 pg/mL respectively at the second follow-up.
On linear regression analysis, it was found that there was low association of age, sex, weight, height, and BMI with BMD value but did not reach statistical significance. However, still further analysis was done using the adjusted values to account for the influence of the above-mentioned factors.
On comparing the adjusted BMC, BMD, and z score at the 4 skeletal sites between cases and controls, it was observed that BMC, BMD, and z score at WB and TBLH were higher in cases as compared to controls at baseline though the difference achieved significant levels for WB, whereas the BMC, BMD, and z score at LS and DR were higher in controls (Table 3).

Comparison of baseline bone densitometric measurements between cases and controls
The mean BMC, BMD, and z score at WB, TBLH, LS, DR progressively declined significantly in each follow-up (Table 4). The mean percentage decline in BMD at WB was 2.61% at first follow-up and 4.59% at the second follow-up as compared to baseline whereas at TBLH it was 1.87% and 3.50%, respectively.
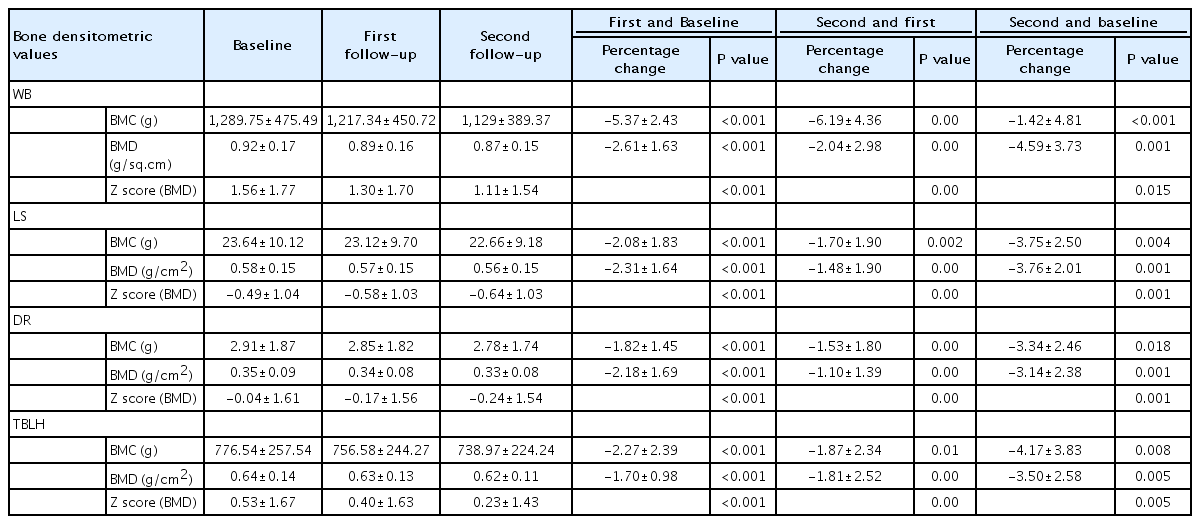
Percentage change of bone densitometric measurements between baseline and different follow-ups after systemic glucocorticoid use (N=25)
Similarly at LS, the mean percentage decrease in BMD was 1.70% and 3.76% at first and second follow-up respectively as compared to baseline and at DR the mean percentage decrease in BMD was 1.53% and 3.14%, respectively (Table 4).
The mean z score at WB, TBLH, LS, and DR at the end of steroid therapy was 1.30, 0.40, -0.58, and -0.17 respectively and at the end of 3 months (second follow-up) 1.11, 0.23, -0.64, and -0.24, respectively. Though the mean z score at each site decreased at each follow-up but it never declined below the cutoff value (-2SD) for osteoporosis in children as per the International Society for Clinical Densitometry [2] (Table 4).
Mean cumulative dose and mean duration of systemic glucocorticoids received by cases were 1,895.23±269.30 mg/m² (range, 1,411.95–2,345.34 mg/m2) and 39.48±3.42 days (range, 35–42 days), respectively.
At first follow-up as well as the second follow-up a significant negative correlation was found between cumulative dose of steroid and BMD and z score at WB, TBLH, and LS (Table 5).

Percentage change of bone densitometric measurements between baseline and different follow-ups after systemic glucocorticoid use (N=25)
A statistically significant negative correlation was found between duration of steroid treatment and BMD and z score of TBLH at first follow-up. All the bone densitometric values measured at other skeletal sites except for BMD and z score at DR revealed negative correlation which did not reach significant levels. Whereas, at second follow-up significant negative correlation was found between duration of steroid treatment and z score of WB and TBLH (Table 6).
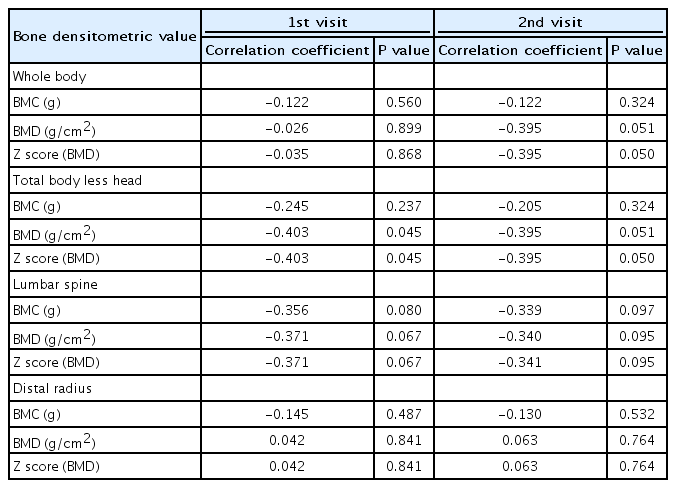
Correlation of duration of glucocorticoid with bone densitometric measurements at first and second follow-up visits
Over the 12-week follow-up period, none of the patients were found to have a fracture of lumbar spine on x-ray (anteroposterior and lateral view).
Discussion
The present longitudinal study revealed that (1) at baseline the mean BMC and BMD of LS and DR were higher in controls and that of WB, and TBLH were higher in cases as compared to controls contrary to expectation since vitamin D, calcium, and phosphorus levels, weight-bearing physical exercises, and sunlight exposure were higher in cases. Such unexpected result could be coincidental or due to more number of cases in SMR stage 3 and 4 as compared to stage 1 and 3 in controls; (2) In cases, BMC and BMD at all the 4 skeletal sites (WB, TBLH, LS, DR) decreased significantly at the first and the second follow-ups, meaning thereby that the progressive decline in BMC and BMD continued even after steroids were stopped. The mean percentage change in BMC and BMD was highest at whole body and lowest at distal radius; (3) At the end of first as well as second follow-up a significant negative correlation was observed between BMD and z score of WB, TBLH, LS, and cumulative dose of steroid and BMD and z score at TBLH and duration of steroid therapy; (4) No vertebral fractures were observed during the study period implying thereby that 6 weeks of steroid therapy did not lead to much loss of BMD to cause a fracture.
In the whole body, 80% of skeletal mass is cortical and 20% is trabecular. Lumbar vertebrae are mainly constituted by trabecular bone and distal radius by cortical bone. Bone mass accrual starts in infancy and continues till mid of third decade of life [21], making the human skeleton vulnerable to insults by diseases and certain drugs like steroids. Diseases like JIA, SLE have been reported to adversely affect bone mass accrual [9-12]. The dose and duration of steroid vary with institution, disease, response to treatment, and occurrence of flares or relapses. In children, the aim is to give steroids for a minimum period to avoid side effects. In patients with TBM, JIA, IBD, immune hemolytic anemia, at our center, the steroid is given at a dose of 1–2 mg/kg/day for 2–4 weeks depending on the response and then tapered over 2–3 weeks. No study has reported the association of variations in dose and duration of steroid with BMD in children.
This longitudinal study was designed to study the effect of a course of steroids of 2–6 weeks duration on both cortical and trabecular bones. No study on effects of steroids for short duration (<6 weeks) on BMD has been published in English literature. Hence the results could not be compared.
Most of the studies reported in literature on the effect of steroids on BMD in children have been cross sectional and revealed conflicting results, some reporting negative effect [4,11,12] and few reporting no effect [7,22].
Few longitudinal studies have been published on the effect of steroids on BMD over time and have shown a negative effect but the duration of steroid used in these studies has varied from 6 weeks to 2 years [6,15,16,18,23,24]. Most of these studies have evaluated the effect of steroid on BMD of LS [7,10,11,16,17,18,23,25], only 3 studies have evaluated BMD at total body, LS, and DR in children [9,14,19].
A longitudinal study in 20 children who received steroids for 12 weeks revealed a decreasing trend in LS BMD at 4 weeks and 12 weeks. The mean BMD was reported to significantly reduced at 4 weeks as compared to baseline (-1.77±1.46 g/cm2 vs. -1.49 ±1.44 g/cm2) and further decreased at 12 weeks (-2.25±1.5 g/cm2) [18]. Another study which evaluated the effect of 6–12 weeks of steroids on BMD also revealed progressive decline in BMD till 6 months [19]. The results were similar to the present study.
BMC, BMD, z score at WB, TBLH, and LS, showed a statistically significant negative correlation with cumulative dose of steroid. Similar results were shown by different studies [10,13-15,23,26,27] and contrary by other studies [7,10].
Similar negative correlation between the duration of steroid therapy and BMD and z score of TBLH, seen in the present study has been reported by Panda et al. [19].
Strength of our study is that we evaluated 4 different skeletal sites reflecting both trabecular and cortical bone after nullifying the confounding factors (age, sex, biochemical parameters, etc.).
This study has some limitations. A larger sample size would have been better to improve the power of the study. Muscle mass and muscle traction forces have been reported to influence bone mass accrual [8], these could have been confounding variables. These could not be completely negated by statistical adjustments.
The present study revealed that short duration of steroid of less than 6 weeks, decreased the BMD and z score at WB, TBLH, LS, and DR which declined further even after the steroid was stopped. More studies would be required with longer follow-up to determine whether the bone densitometric parameters improve with time or not after stoppage of steroids.
Notes
Conflicts of interest
No potential conflict of interest relevant to this article was reported.
Funding
This study received no specific grant from any funding agency in the public, commercial, or not-for-profit sectors.
Acknowledgements
We acknowledge the statistical analysis done by Dr Ashish Yadav-Statistician.