Expression profiling of cultured podocytes exposed to nephrotic plasma reveals intrinsic molecular signatures of nephrotic syndrome
Article information

Abstract
Background
Nephrotic syndrome (NS) is a common renal disorder in children attributed to podocyte injury. However, children with the same diagnosis have markedly variable treatment responses, clinical courses, and outcomes, suggesting molecular heterogeneity.
Purpose
This study aimed to explore the molecular responses of podocytes to nephrotic plasma to identify specific genes and signaling pathways differentiating various clinical NS groups as well as biological processes that drive injury in normal podocytes.
Methods
Transcriptome profiles from immortalized human podocyte cell line exposed to the plasma of 8 subjects (steroid-sensitive nephrotic syndrome [SSNS], n=4; steroid-resistant nephrotic syndrome [SRNS], n=2; and healthy adult individuals [control], n=2) were generated using microarray analysis.
Results
Unsupervised hierarchical clustering of global gene expression data was broadly correlated with the clinical classification of NS. Differential gene expression (DGE) analysis of diseased groups (SSNS or SRNS) versus healthy controls identified 105 genes (58 up-regulated, 47 down-regulated) in SSNS and 139 genes (78 up-regulated, 61 down-regulated) in SRNS with 55 common to SSNS and SRNS, while the rest were unique (50 in SSNS, 84 genes in SRNS). Pathway analysis of the significant (P≤0.05, -1≤ log2 FC ≥1) differentially expressed genes identified the transforming growth factor-β and Janus kinase-signal transducer and activator of transcription pathways to be involved in both SSNS and SRNS. DGE analysis of SSNS versus SRNS identified 2,350 genes with values of P≤0.05, and a heatmap of corresponding expression values of these genes in each subject showed clear differences in SSNS and SRNS.
Conclusion
Our study observations indicate that, although podocyte injury follows similar pathways in different clinical subgroups, the pathways are modulated differently as evidenced by the heatmap. Such transcriptome profiling with a larger cohort can stratify patients into intrinsic subtypes and provide insight into the molecular mechanisms of podocyte injury.
Key message
Question: Is it possible to classify nephrotic syndrome (NS) through gene expression profiling of podocytes exposed to NS plasma?
Finding: Our data showed different expression profiles in podocytes exposed to nephrotic plasma from different clinical groups, suggesting the molecular stratification of patients into intrinsic subtypes.
Meaning: Transcriptome profiling of podocytes treated with NS plasma can stratify patients into intrinsic subtypes and provide insight into the molecular mechanisms of podocyte injury.
Introduction
The primary treatment strategy for children with NS involves use of steroids and nonsteroidal immune-suppressants which poses therapeutic challenge for clinicians as this strategy is nonspecific and not always effective [1]. About 80% of NS patients who receive steroids respond to this therapy, labelled as steroid-sensitive nephrotic syndrome (SSNS) and have good outcome while, 10%–20% patients who do not respond to steroids are defined as steroid-resistant nephrotic syndrome (SRNS) and have a major risk of disease progression to end-stage renal failure. Renal biopsy shows 2 distinct histological variants among NS; minimal-change nephrotic syndrome and focal segmental glomerulosclerosis (FSGS) [1,2]. Despite the fairly favorable prognosis in steroid responsive patients, subsequent relapses are common, leading to increased morbidity and decreased quality of life. Due to heterogeneous nature of the disease, present classification based on steroid response and renal histopathology is unable to accurately predict the clinical course and outcome of patients. Therefore, there is a need to understand the underlying molecular mechanisms to identify biomarkers which will help in refining the classification of NS and also help identify therapeutic targets.
The central event in NS is podocyte injury leading to increased glomerular filtration barrier permeability as evidenced by genetic studies that identified inheritable variations in podocyte-specific genes to be the primary cause of SRNS [3]. As relapse in NS patients is mostly triggered by infections or allergies and because of their clinical response to immunosuppressive drugs or to plasmapheresis in recurrent FSGS patients, it was hypothesized that pathogenesis of nongenetic cases of NS is associated with immune dysfunction through Toll-like receptors signaling or potential circulating factors [4]. Since then, many studies have been conducted to identify circulating factors causing podocyte injury, however, the true nature of the factor still remains elusive.
Transcriptomic studies in recent years with kidney biopsy samples from diabetic nephropathy, lupus nephritis, and FSGS patients have shown a distinct gene expression fingerprint and demonstrated the utility of this approach in distinguishing patients with different kidney diseases [5-7]. However, use of RNA extracted from formalin-fixed paraffin-embedded tissue, for global gene expression profiling is debatable as quality and RNA integrity deteriorate during sample preparation [8]. Moreover, human rights and ethics, and limited availability of samples increase the challenges of such human studies. Use of animal models to study disease susceptibility, mechanisms, prognosis, and potential therapies, is difficult, time-consuming, costly and sometimes the findings do not validate in human clinical studies. Immortalized human podocyte cell line is a promising model to decipher kidney diseases especially glomerular diseases. Gene expression profiling studies of immortalized human podocytes exposed to high glucose, indicated the cell line to be a better model for studying the molecular mechanisms underlying podocytopathy in diabetes [9]. We hypothesized that, patients with SSNS as well as SRNS without genetic mutations have unique putative pathogenic component(s) in their plasma, that may induce characteristic gene expression pattern altering podocyte function specific to the NS subgroups. Such study may help not only to stratify patients into intrinsic subtypes and provide insight into molecular mechanisms of podocytes injury but may also help in identifying therapeutic targets.
Methods
1. Subjects
Six children with nephrotic syndrome, 2 diagnosed as SRNS and 4 as SSNS were selected from an on-going study as per selection criteria (Supplementary Table 1). Two apparently healthy young adult volunteers without a recent febrile illness (before/within 2 weeks of obtaining blood sample), or hypertension or history of chronic or acute disease associated with inflammation were used as controls (Table 1). All the patients received 2-mg/kg/day prednisone treatment at initial episode of nephrotic syndrome, and were classified according to the standard guidelines [1]. Both the SRNS patients were tested and identified as mutation-free for the commonly mutated genes (NPHS2 and WT1). Among the 4 SSNS patients, 2 had infrequent relapses (infrequent relapse nephrotic syndrome, IFRNS) and 2 had frequent relapses (relapse nephrotic syndrome, FRNS) (Table 1). Both the IFRNS patients were not on any medication during sampling while both the FRNS patients had relapsed while on levamisole at the time of sampling. On follow-up, FRNS patients were treated with cyclophosphamide while the SRNS patients received tacrolimus and cyclophosphamide as steroid sparing alternatives (Table 1). Blood samples (5 mL) were collected from all 6 nephrotic patients at the time of relapse (urine albumin ≥3+). Blood from all subjects collected in ethylenediamine tetraacetic acid tubes, were spun at 4℃ @ 5,000 rpm for 15 minutes to separate plasma which was then stored at -80°C until further use. We also confirmed podocyte injury following exposure to plasma from children with SSNS and SRNS by assessing changes in podocyte morphology using immunofluorescence microscopy and scratch assay. The methods have been detailed in supplementary data.
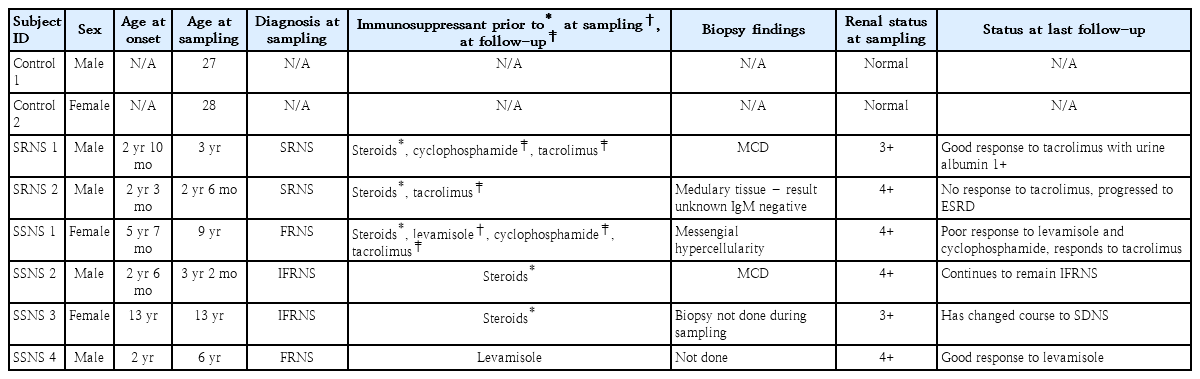
Clinical profile of the study subjects
2. Podocyte cell culture
Conditionally immortalized human podocyte cells (passage 22) obtained from Dr. Moin Saleem’s lab at University of Bristol, were used for these experiments. Cells were propagated at 33℃ until they were 70% confluent, and allowed to differentiate for 14 days at 37℃ in Rosewell Park Memorial Institute (RPMI) 1640 media with L-Glutamine and 25mM HEPES (N-2-hydroxyethylpiperazine-N-2-ethanesulfonic acid) supplemented with 10 % fetal bovine serum and 1% penicillin streptomycin with media change once in 2 days [10]. Differentiated cells were exposed to human plasma diluted to 5% with RPMI media (e.g., 1-mL culture medium contains 50 µL of human plasma + 950 µL of RPMI media) for 2 hours and total RNA was extracted using Trizol reagent (Invitrogen Life Technologies, Carlsbad, CA, USA) as per manufacturer’s instructions. RNA concentration was assessed using a NanoDrop 1000 spectrophotometer (ThermoFisher Scientific, Waltham, MA, USA) and integrity was analyzed using Bioanalyzer (Agilent Technologies, Santa Clara, CA, USA) through RNA integrity number (RIN).
3. Transcriptome profiling using microarray and data processing
Microarray was performed using single color (CY3) Agilent Human Whole Genome 8x60k Gene Expression Array (AMADID: 39494) as per the manufacturer’s instructions. Gene expression data were extracted from images using Feature Extraction software v 10.7 of Agilent, pre-processed for background correction and data normalization between arrays using R software [11]. The normalized file was further filtered to remove pseudo genes and obtain average intensity values for duplicate probes. Genes expressed in the diseased samples (SSNS and SRNS) with standard deviation ≤0.1 compared to the healthy control were removed because of low variance to obtain a subset of data (16,355 genes) used for all further analysis. Unsupervised hierarchical cluster analysis was performed with ‘gplots package’ from R by using the Pearson similarity metric and Ward D2 as a clustering method [12].
4. Differential gene expression analysis
Differential gene expression (DGE) analysis was performed using LIMMA package in R software in 2 ways – (1) diseased groups (SSNS or SRNS) versus healthy control and (2) between the diseased groups SSNS versus SRNS [13]. Genes with P<0.05 and -1≤ log FC ≥1 were filtered to identify significant differentially expressed genes (DEGs) with both the analyses (SSNS or SRNS vs. healthy control and SSNS vs. SRNS).
A Venn diagram was constructed with DEGs (SSNS or SRNS vs. healthy controls) which identified common and unique genes. These significant DEGs were annotated using PANTHER classification system (Protein Analysis THrough Evolutionary Relationships, http://pantherdb.org) [14]. To identify relevant pathways, web-based software WebGestalt (WEB based GEne Set AnaLysis Toolkit) and Enrichnet were used. Functional analysis of transcriptional networks and interactions between identified pathways were analyzed using Toppcluster and visualized using Cytoscape [15-18].
To identify intrinsic molecular subtypes and to visualize the gene expression pattern, a heatmap was constructed using corresponding expression values of DEGs (P<0.5) between SSNS and SRNS in R software. Further filtration criteria of (1< log FC >1) was applied to identify significant genes differentially regulated between SSNS and SRNS.
5. Validation by quantitative real time-polymerase chain reaction
To validate the microarray results, significant DEGs representing common pathways and genes with prior reports as podocyte injury markers were selected as candidate genes. The primers were designed using Primer 3 plus (http://primer3plus.com/cgi-bin/dev/primer3plus.cgi) (Supplementary Table 2) [19]. Total RNA extracted from podocytes exposed to plasma of same subjects diluted to 5% using Qiagen RNeasy mini kit was converted to cDNA with 1 μg of RNA as input using the high capacity reverse transcriptase cDNA kit (ThermoFisher Scientific). Amplification was performed in duplicate using the Power SYBR Green PCR master mix (ThermoFisher Scientific) in StepOneplus real-time PCR machine (ThermoFisher Scientific). The data was normalized using GAPDH (glyceraldehyde-3-phosphate dehydrogenase) expression and analyzed according to the ∆∆Ct method [20].
6. Compliance with ethical standard
All experiments were carried out according to protocols approved by Institutional Ethical Committee of St. John’s Medical College Hospital (approval number: 239/2015). Informed consent was obtained from all individual participants included in the study.
Results
1. Podocyte response to nephrotic plasma
To determine whether nephrotic plasma (SSNS and SRNS) was able to trigger morphological changes in podocytes leading to cytoskeletal disruption and footprocess effacement, we performed morphology assay, immunofluorescence microscopy, and scratch assay. Podocytes treated with SSNS as well as SRNS plasma showed morphological changes viz. rounding up of cells due to retraction of foot processes as early as 6 hours (Supplementary Fig. 1). Immunoflurescence assay showed focal adhesion complexes stained with antivincullin antibody as green punctate marks. The cytoskeleton was visualized by phalloidin antibody as red parallel strands of actin fibers (Supplementary Fig. 2). In a healthy podcyte (untreated and incubated with healthy control), focal adhesion complexes and intact cytoskeleton were observed in all-time points (1, 3, 6, and 12 hours). However, Podocytes treated with SSNS and SRNS plasma showed loss of focal adhesion complexes and disorganization of cytoskeleton (loss of parallel arrangement of actin fibers) at 6 hours. Scratch assay also showed exposure of nephrotic plasma (SSNS and SRNS) to podocytes leads migration of podocytes (Supplementary Fig. 3). Thus, it is evident that nephrotic plasma consists of putative toxic factors capable of inducing podocyte injury.
2. Identification of intrinsic subtypes in nephrotic syndrome
Unsupervised hierarchical clustering of global gene expression revealed 2 major clusters with 6 subclusters (Fig. 1). Correlation with patient’s clinical data such as drug response and disease outcome revealed that major clusters correctly represented the SSNS and SRNS subgroups of NS while the sub clusters correlated with treatment response and clinical course. Within SSNS cluster, podocyte exposed to plasma of IFRNS patients (SSNS 2 and 3) formed a single subcluster and were separated from FRNS patients (SSNS 1 and 4). Among the 2 FRNS patients, SSNS 1 placed in outer branch had poor response to levamisole and oral cyclophosphamide but responded to tacrolimus, while the other child (SSNS 4) who had a good response to levamisole was placed in a separate branch. Within SRNS subcluster, a child who attained complete remission on tacrolimus was separated from the child with poor response to tacrolimus who progressed to end-stage renal disease. Although podocytes treated with controls grouped with those treated with the more aggressive phenotype, they formed a distinct subcluster.
Unsupervised hierarchical cluster dendrogram. Unsupervised cluster analysis with a normalized and filtered (standard deviation ≤ 0.1) subset of podocyte gene expression profiles (16355) that revealed 2 major clusters and 6 subclusters. Group 1: all SSNS; group 2: SRNS versus control. SRNS, steroid-resistant nephrotic syndrome; SSNS, steroid-susceptible nephrotic syndrome.
3. Identification of DEGs
As compared to podocytes treated with healthy plasma, a total of 105 (58 up-regulated and 47 down-regulated) and 139 genes (78 up-regulated and 61 down-regulated) were identified as significant in SSNS and SRNS treated podocytes respectively (Supplementary Table 3). Of these, 55 genes (40%) were common in both SSNS and SRNS (Fig. 2A, Supplementary Table 3). Among the 105 DEGs in SSNS, 50 (47.6%) were unique to SSNS, while out of 139 DEGs in SRNS group, 84 (60.4%) were unique to SRNS. Gene ontology (GO) analysis for biological processes of DEGs in SSNS as well as SRNS, revealed genes to be involved in cytokine and interferon-mediated pathways, in defense response to virus and transcription regulation pathways (Supplementary Table 4A, B). Molecular function analysis showed that DEGs were mostly involved in binding and regulation of transcription factors (Supplementary Table 5A, B). Pathway analysis revealed the DEGs to be mainly involved in mitogenactivated protein kinase (MAPK) signaling pathway (6 genes), transforming growth factor (TGF)-β signaling pathway (5 genes), and osteoclast differentiation (4 genes) (Table 2). EnrichNet identified TGF-β pathway (ID3, ID1, SMAD7, GDF6, TNF) and Janus kinase-signal transducer and activator of transcription (JAKSTAT) pathway (CSF3, CLCF1, IL11, SOCS3) as important pathways (with high kidney specificity score) modulated during podocyte injury (Table 2).
DGE analysis between SSNS or SRNS and control identified significant genes and pathways. (A) Venn diagram indicating 55 genes (40%) of total DEG common to SSNS and SRNS. (B) Nephrotic plasma induced DEG network: The green boxes represent pathways and the red hexagons represent the significant DEGs in the respective pathways. Node size corresponds to the centrality of a particular network. Tumor necrosis factor is involved in multiple pathways such as transforming growth factor-beta signaling, cytokine and inflammatory, osteoclast differentiation, and mitogen-activated protein kinase signaling pathway. SOCS3 is another significant gene involved in the osteoclast differentiation pathway, cytokine signaling, the immune system, and type II diabetes. DGE, differential gene expression; DEGs, differentially expressed genes; SRNS, steroid-resistant nephrotic syndrome; SSNS, steroid-susceptible nephrotic syndrome.
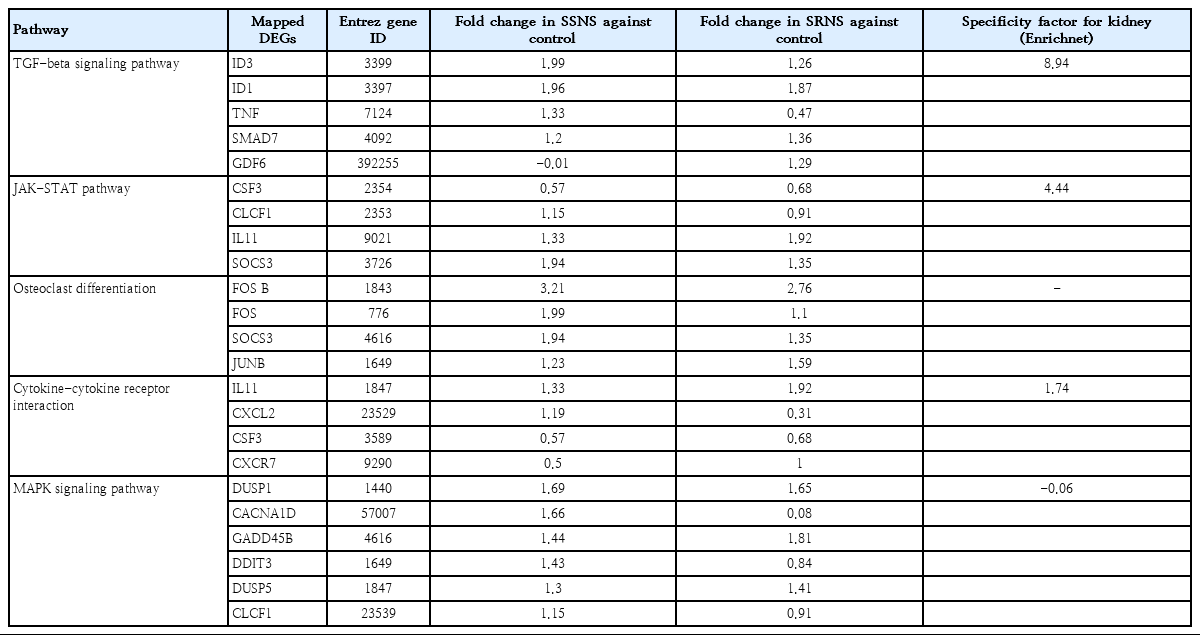
Pathway analysis of DEGs within disease groups (SSNS or SRNS vs. control)
Network analysis of the enriched genes revealed tissue necrosis factor (TNF) as a significant gene involved in multiple pathways such as TGF-β signaling, cytokine and inflammatory, osteoclast differentiation, and MAPK signaling pathway. SOCS3 was another significant gene involved in osteoclast differentiation pathway and cytokine signaling (Fig. 2B). For validation of microarray data, significant DEGs representing multiple pathways (ID1, ID3, FOSB, SOCS3, SMAD7) were selected as candidates that are modulated during podocyte injury. Additionally, among the down-regulated genes, those with prior reports as podocyte injury markers (FMC1 and LAMC3) were selected as candidates for validation.
DEG analysis between subgroups (SSNS vs. SRNS) identified 2,350 genes to be significant (P<0.5), with 1,409 up-regulated and 941 down-regulated genes. Heatmap showed that the gene expression pattern varied as per the disease subgroup (Fig. 3). To identify a significant gene signature contributing to variability in gene expression between the SSNS and SRNS, a fold change cutoff of -1< log FC >1 was applied. This filtering identified a total of 46 genes, 24 up-regulated and 22 down-regulated genes in SSNS compared to SRNS that are listed to the right of heatmap (Fig. 3). GO analysis revealed these genes code for enzymes involved in transcription or translation regulation, cell cycle regulation, apoptotic pathways, membrane trafficking, and signal transduction (Supplementary Table 6). Pathway analysis of these genes did not reveal involvement of any significant pathway due to small number of genes. However, among the significant genes, FMC1, LTBR, TAGLN2, and BAP1 had earlier reports of being involved in nephrotic syndrome and were thus selected for quantitative real time-polymerase chain reaction (qRT-PCR) validation.
DGE analysis of SSNS versus SRNS. The heat map was constructed with corresponding normalized values of genes (P≤0.05) in each subgroup to visualize the differences in expression patterns. On applying the cutoff of -1< log FC >1, a total of 46 genes (24 upregulated, 22 down-regulated) were identified (indicated to the right of the heatmap). DGE, differential gene expression; SRNS, steroid-resistant nephrotic syndrome; SSNS, steroid-susceptible nephrotic syndrome.
The expression pattern of selected candidate genes (ID1, ID3, FOSB, SOCS3, SMAD7, FMC1, and LAMC3), was similar in qRT-PCR and microarray (correlation of 0.95 and 0.89 of SSNS and SRNS respectively) (Fig. 4A, B). qRT-PCR also confirmed the expression pattern of candidate genes (FMC1, LTBR, BAP1, and TAGLN2) between the SSNS and SRNS with a correlation of 0.71 (Fig. 4C).

Verification of candidate genes identified in the microarray by qRT-PCR. Comparison of expressions of candidate genes identified in the differential gene expression analysis. (A) SSNS versus control, (B) SRNS versus control, and (C) SSNS against SRNS. The dark-colored bars represent the log fold change in microarray and light-colored bars represent log fold change in qRT-PCR. qRT-PCR, quantitative reverse transcription-polymerase chain reaction; SRNS, steroidresistant nephrotic syndrome; SSNS, steroid-susceptible nephrotic syndrome. MA, microarray.
Discussion
This study was planned to test the hypothesis that the plasma of nephrotic patients may cause subgroup-specific molecular signature leading to podocyte injury. Human podocyte cell line was exposed to plasma from well-characterized clinical subgroups of NS and the global gene expression profiles were studied. IFRNS and SRNS patients were not on any medication at the time of sampling thus eliminating the effects of steroids in blood. Although FRNS patients were on levamisole at the time of sampling, a relapse with urine albumin >3 indicates presence of the injury marker in spite of levamisole and thus plasma of such patients is expected to trigger similar gene activity in cultured podocytes.
First, we compared podocyte gene expression changes between all treated groups using unsupervised hierarchical clustering approach. As expected, clustering showed unambiguous separation of the samples as per plasma treatment hinting differential activation of pathways between NS subgroup during podocyte injury which can be a useful tool for molecular stratification of NS subgroups. Surprisingly, healthy control treated podocyte clustered with more aggressive disease group, SRNS. Although care was taken to collect samples from control individuals who did not have recent infection, no physical examination or standard laboratory tests were performed to ensure the health status. We speculate that these healthy individuals were either recovering from a recent infection or unaware of the infection or allergen contact. As NS is mostly related to immune dysfunctions, these factors may induce gene expression similar to disease group. However, a small sample size makes it difficult to comment on clustering of healthy controls with SRNS. Screening of more controls and SRNS samples may shed light on the possible reasons.
Further, to identify the pathways altered in podocytes due to nephrotic plasma exposure, we compared gene expression patterns between the diseased and healthy control groups. GO and pathway analysis of the significant DEGs identified their involvement in cytokine and interferon mediated pathways, in defense response to virus and regulation of transcription, TGF-β pathway and JAK-STAT pathway. TGF-β pathway, plays an important role in the development of glomerulosclerosis and tubulointerstitial fibrosis by stimulating the production of extracellular matrix protein collagen and fibronectin [21]. Focal segmental glomerular sclerosis with tubular fibrosis is seen in renal biopsy of steroiddependent nephrotic syndrome and SRNS patients [2,22]. On other hand, previous studies have shown activation of the JAK/STAT signaling cascade stimulates excessive proliferation and growth of glomerular mesangial cells in diabetic nephropathy, while it promotes podocyte apoptosis in idiopathic nephrotic syndrome [23]. Thus, it is indicated that these pathways and corresponding genes identified in the present study may prove to be candidate markers and should be studied in detail to understand their role in podocyte injury.
One of the candidates from TGF-β pathway, SMAD7, reported to be overexpressed in injured podocytes, is an important negative regulator of TGF-β pathway [24]. TGF-β and SMAD7 both induce apoptosis in injured podocytes through independent mechanisms and their coexpression amplifies TGF-β–mediated apoptosis of podocytes probably by mesangial cell matrix overproduction in progressive FSGS [25]. In the present study, SMAD7 was upregulated in both SSNS and SRNS. Validation of these findings in larger cohort is necessary and further studies are required to understand the precise role of SMAD7 in NS. Two more TGF-β/Smad signaling pathway genes, ID1 and ID3 were upregulated in both the clinical groups. Up-regulation of these genes reactivates BMP pathway through SMAD signaling and helps in self-renewal of mesangial cells, leading to fibrosis in patients recovering from Acute Kidney Injury (AKI) and Chronic kidney disease (CKD) patients [26]. Anti-TGF-β has been used as therapy for kidney fibrosis and our data also agrees that these pathways are activated in podocyte injury [27]. Therefore, we speculate that up-regulation of these genes in podocyte may lead to fibrosis. However, SSNS patients do not show fibrosis and more studies are required to understand the role of TGF-β signaling in SSNS. Together, these findings suggest that TGF-β mediated SMAD signaling should be studied in detail to decipher its role in podocyte injury in NS.
The other important pathway identified was JAK/STAT pathway which plays a principal role in multiple processes like maintaining cell homeostasis and immune development, cytokine and growth factor-mediated cell proliferation, differentiation, cell migration, and apoptosis [28]. This pathway is regulated by multiple mechanisms one being regulation by suppressors of cytokine signaling (SOCS) family of proteins. The SOCS family members particularly SOCS1 and 3, negatively regulate the JAK/STAT pathway by binding and inhibiting STAT phosphorylation. Previous studies observed increased expression of SOCS3 in cultured podocytes under inflammatory stimulus, in human kidney biopsies as well as rat models of diabetic nephropathy [29]. Other reports have demonstrated up-regulation of SOCS3 in circulating leukocytes of both SSNS and SRNS patients in relapse condition which reduced upon treatment with 6 weeks of corticosteroids in SSNS however remains the same in SRNS [30]. Supporting these findings our data also showed up-regulation of SOCS3 in podocytes treated with NS plasma hinting that JAK/STAT pathway plays a role in podocyte injury.
FOSB gene of osteoclast differentiation pathway along with Jun family proteins, forms transcription factor complex AP-1 which was found to be up-regulated in peripheral blood mononuclear cells isolated from CKD patients suggesting its possible role in progression of chronic kidney injury [31]. Up-regulation of FOSB is likely to regulate many molecular mechanisms such as cell proliferation, differentiation, apoptosis, and also regulates expression of various proinflammatory genes and is induced by inflammatory cytokine TNF and IL-6 [31]. FOSB was up-regulated in both NS groups indicating its involvement in podocyte injury.
Among the down-regulated genes LAMC3 codes for laminin subunit gamma 3 which forms components of basement membranes and plays a role in cell adhesion. Higher levels of LAMC1 have been reported in serum and urine of CKD patients indicating accelerated remodeling of both glomerular and tubular basement membrane in CKD [32]. Though none of the earlier reports have mentioned LAMC3 in relation to nephrotic syndrome, our data shows down-regulation of LAMC3 in both the clinical groups. Down-regulation of LAMC3 may disrupt focal adhesion points thus causing podocyte injury in nephrotic syndrome.
To identify molecular signatures that differentiate the diseased groups, we performed DGE analysis between them (SSNS vs. SRNS). This analysis identified genes involved in cell cycle, apoptosis, protein kinase activity, membrane trafficking, and signal transduction to be significantly up-regulated in SRNS as compared to SSNS (Supplementary Table 6). From significant DEGs, FMC1, LTBR, BAP1, and TAGLN2 were selected as candidates for qRT-PCR validation because of earlier reports as podocyte injury markers. C7orf55, also known as FMC1 (Formation of Mitochondrial Complex V Assembly Factor 1 Homolog) is a factor required for the assembly of the F1 sector of adenosine triphosphate (ATP) synthase at high temperatures. Loss of FMC1 directly and severely impairs ATP synthase assembly, while secondarily impairing the respiratory chain biogenesis and activity as well as mitochondrial membrane potential [33]. Increasing evidence points to generation of reactive oxygen species and mitochondrial dysfunction in development of several kidney diseases, including cell injury in FSGS, AKI, CKD, and diabetic nephropathy [34,35]. Down-regulation of FMC1 in both the subgroups, suggests increased mitochondrial instability and dysfunction which might play a role in apoptosis of podocytes. As podocyte apoptosis is a common phenomenon in SRNS, this finding suggests mitochondrial instability through inactivation of ATP synthase might be one of the mechanisms of the podocyte apoptosis in SRNS. However, its role in SSNS needs to be studied further.
We also identified 3 genes, LTBR, TAGLN2, and BAP1 which are involved in cellular differentiation and interferon responses to pathogens, cell migration, and cell cycle regulation, respectively, overexpressed in SSNS. Together these results suggest that podocyte injury is multifactorial involving several genes and pathways.
Interestingly, our analysis identified common pathways in SSNS and SRNS groups that are altered in podocyte injury. This could be due the exposure time point used in the present study which possibly captured the late podocyte injury event involving common molecular pathways in both SSNS and SRNS groups. However, the expression pattern of the genes varies as per the clinical subgroups, signifying that these pathways should be studied in detail to understand the contribution of DEGs in the subgroup-specific disease development. Studies capturing early podocyte injury may help to provide more insight into subgroupspecific disease mechanisms and studies with larger well-phenotyped subjects can confirm targets for early intervention.
In conclusion, this study identified TGF-β and JAK-STAT pathways to be differentially regulated in both SSNS and SRNS suggesting their role in podocyte injury. Being an exploratory study, sample size used in the study was small and the findings need to be validated in larger cohorts. As our study probably captured late events in course of podocyte injury, we could identify common pathways in both the clinical subgroups. Further studies at an early time point with larger cohort may help to reveal the subgroup-specific mechanism of podocyte injury and understand the exact role of candidate genes identified in this study.
Notes
No potential conflict of interest relevant to this article was reported.
Acknowledgements
This work was supported by Council of Scientific and Industrial Research. Sanction No. (27(0288)13EMR) ii; Navajbhai Ratan Tata trust - Health CKCC 20141118 and Union Grants Commission or Research Fellow Programme. 22/12/2013(ii)EU-V. The authors thank all the study participants and staffs involved in this study. We acknowledge Dr. Hamsa Reddy for helping us in counselling and recruiting patients for the study and Dr. Ashwini Raghavedra for her valuable inputs in manuscript editing.
Supplementary Materials
Supplementary Tables 1-6 and Figs. 1-3 can be found via https://doi.org/10.3345/cep.2020.00619.
Selection criteria of the subjects
Primer sequences and annealing temperature of candidate
Significant genes identified to be differentially expressed in podocytes exposed to plasma from SSNS and SRNS compared to that of healthy controls
Gene ontology biological processes – SSNS vs. control
Gene ontology biological processes – SRNS vs. control
Gene ontology molecular function – SSNS vs. control
Gene ontology molecular function – SRNS vs. control
Significant DEGs between SRNS and SSNS
Podocyte cell morphology at different time points following exposure to plasma from individuals with SSNS, SRNS, and healthy controls. Differentiated podocytes were treated with 5% plasma from healthy control, 1 SSNS, and 1 SRNS patients. The treated cells were incubated at 37°C for 12 hours and imaged at 0-, 2-, 6-, and 12-hour time points using an inverted microscope (Magnus, New Delhi, India) in ×10 magnification. Podocytes treated with SSNS as well as SRNS plasma showed morphological changes viz. rounding up of cells due to retraction of foot processes as early as 6 hours and cell detachment by 12 hours. However untreated podocytes and those treated with plasma form healthy controls did not show any visible changes. SSNS, steroid-susceptible nephrotic syndrome; SRNS, steroid-resistant nephrotic syndrome.
Immunofluorescence images of podocytes treated with nephrotic plasma for different durations stained for vinculin (focal adhesion complexes) and phalloidin (actin cytoskeleton) to assess podocyte cytoskeleton integrity. Differentiated podocytes were incubated in medium containing 5% plasma from healthy control, SSNS, and SRNS (without mutation in NPHS2 and WT1) for different durations (1, 3, 6, and 12 hours). After incubation these cells were fixed with 4% formaldehyde and incubated in antivinculin antibody, phalloidin antibody, and nuclei were stained with 4′,6-diamidino-2- phenylindole (DAPI; blue) and imaged using direct fluorescence microscope (Olympus, Tokyo, Japan) at ×40 magnification. In a healthy podocyte (untreated and incubated with healthy control), focal adhesion complexes can be visualized as green punctate marks at ends of red parallel strands of actin fibers representing the cytoskeleton. Podocytes treated with SSNS and SRNS plasma showed loss of focal adhesion complexes and disorganization of cytoskeleton (loss of parallel arrangement of actin fibers) at 6 hours as opposed to untreated cells and those treated with healthy plasma. SSNS, steroid-susceptible nephrotic syndrome; SRNS, steroid-resistant nephrotic syndrome.
Scratch assay to compare motility of cells treated with 5% healthy or SRNS or SSNS plasma. A single scratch with a 200-µL tip was performed in each well with differentiated podocytes. The cells were washed with 1XPBS and were treated with 5% plasma form healthy control, SRNS, and SSNS subjects). The treated cells were incubated at 37°C for 6 hours and then imaged using an inverted microscope (Magnus, New Delhi, India). Cells treated with plasma from SRNS as well as SSNS showed motility due to detachment of foot process while such motility was not observed in podocytes treated with plasma from healthy controls. SSNS, steroid-susceptible nephrotic syndrome; SRNS, steroid-resistant nephrotic syndrome.