Understanding the genetics of systemic lupus erythematosus using Bayesian statistics and gene network analysis
Article information
Abstract
The publication of genetic epidemiology meta-analyses has increased rapidly, but it has been suggested that many of the statistically significant results are false positive. In addition, most such meta-analyses have been redundant, duplicate, and erroneous, leading to research waste. In addition, since most claimed candidate gene associations were false-positives, correctly interpreting the published results is important. In this review, we emphasize the importance of interpreting the results of genetic epidemiology meta-analyses using Bayesian statistics and gene network analysis, which could be applied in other diseases.
Key message
• Bayesian false-discovery probability and false-positive report probability are the 2 major Bayesian methods used to evaluate noteworthiness of a genetic variant.
• Application of stricter P value is needed to confirm statistical significance in meta-analyses.
• Gene network analysis of noteworthy genetic variants shows a blueprint of the genetic background in complex diseases.
Introduction
Although the publication of meta-analyses has rapidly increased, researchers have started to determine that many of the statistically significant results are false-positive [1,2]. Most such meta-analyses have redundant duplicate topics and many errors [1,3]. Although there has been an impressive increase in meta-analyses from China, particularly those on genetic associations, most claimed candidate gene associations are likely false-positives, suggesting an urgent global need to incorporate genome-wide data and state-of-the art statistical inferences to avoid a flood of false-positive genetic meta-analyses. In this review, we emphasize the importance of discerning meaningful studies and interpreting their results using Bayesian statistics and gene network analysis. For this purpose, we adopted and reanalyzed significant genes from our previously published systemic meta-analyses of genetic association studies of systemic lupus erythematosus (SLE) as an example [4].
Current understanding of genetic associations with “noteworthiness”
The traditional interpretation of association studies was labeled as statistically significant by the chosen P value of less than 0.05 [5]. Over the past few decades, an unprecedented advance in genotyping technologies has led to a marked increase in the publication of genome-wide association studies (GWAS) [6]. GWAS results generally have much smaller P values than those of observational studies, which are expected to have higher numbers of false-positive noteworthy associations. However, in observational studies, the threshold P value is generally fixed at 0.05 and the small sample size of studies allows for a P value that is highly responsive to a change in the number of cases [5]. In the case of GWAS, the genome-wide significance threshold should be P<5×10⁻⁸ [7]. However, some uncertainty persists about the most appropriate genome-wide significance threshold. At the practical level, some initial GWAS used a threshold of P<1×10⁻⁷ [8-10]. The general rule, however, is that associations with P< 5×10⁻⁸ are considered replicable [11]. And, associations with P≥1×10⁻⁷ are not accepted unless proven by more stringent replication [5].
Discovering noteworthy variants
The common misunderstanding of the P value is that it is, in fact, not the probability of the null hypothesis being rejected by mistake but the probability of the null hypothesis. Therefore, the evaluation of the hypothesis requires a Bayesian approach that requires prior probability of the hypothesis and the data [12]. To date, 2 major Bayesian approaches in the assessment of false report probability were published, the false-positive report probability (FPRP) and the Bayesian false-discovery probability (BFDP) [12,13]. FPRP and BFDP have been used in various genetic studies and field synopses in cancer studies (i.e., lung, ovarian, colorectal, gastric, hematologic) to identify genuine noteworthy genetic variants [5,14-21]. However, attempts to discover noteworthy variants in autoimmune diseases using FPRP and BFDP are scarce.
1. False-positive report probability
FPRP is defined as “the probability of no true association between a gene variant and disease (null hypothesis)” for a statistically significant finding now assumed as a P<0.05 [11]. Developed by Wacholder et al. [12], FPRP is calculated with the observed P value, statistical power of the test, and the prior probability that an association is true. The prior probabilities we assumed when calculating FPRP were 10-3 for a candidate gene variant and 10-6 for a random single nucleotide polymorphism (SNP) as suggested by Wacholder et al. [12]. In our previous field synopsis of SLE [4], we calculated FPRP at those 2 assumed prior probabilities. The statistical power to detect an odds ratio (OR) of 1.2 and 1.5 was used for FPRP at both prior probabilities. Statistical power based on the ability to detect an OR of 1.5 (or its reciprocal 1/1.5=0.67 for an OR<1) was first proposed by Wacholder et al. [12], which we thought might be too conservative. Thus, we advocate using statistical power to detect an OR of the median among the results of studies and 1.5. The FPRP can be obtained using the following equation:
where π is the prior probability, α is the lowest level of significance at which a test is noteworthy (α=0.05), while (1-β) is the statistical power obtained using the following equation:
where φ is the cumulative distribution function of the standard normal distribution and Zα/2 is the α/2 point of the standard cumulative normal distribution. For the actual computation of FPRP, σ and Zα/2 are replaced by the standard error of the logOR estimates and the 2-sided P value point of the standard normal distribution. All FPRP computations were performed using the Excel spreadsheet provided by Wacholder et al. [12], and associations with FPRP <0.2 were considered noteworthy as recommended by the authors.
2. Bayesian false-discovery probability
BFDP values can be obtained using methods created by Wakefield [13]. This provides information based on the cost of a false discovery and a false nondiscovery. Different from FPRP, BFDP is calculated using the following equation:
where PO is the prior odds of the null hypothesis and is equal to πo/(1-πo) wherein πo is the prior probability of the null hypothesis and ABF is the approximate Bayesian factor computed using OR and standard error. Its approximation is based on a logistic regression model instead of a standard normal distribution. The noteworthiness is assessed with the cutoff value of 0.8 for BFDP, which means a false nondiscovery 4 times as costly as a false discovery [13].
BFDP seems more reasonable with sound methodological derivation than FPRP. While FPRP is stated as the lowest FPRP value at which a test would yield a noteworthy finding and assumes a specific point as a prior [12], BFDP uses average over all alternatives as a prior [13]. In other words, FPRP produces posterior null estimates that are smaller than those produced by BFDP because FPRP is essentially the lower bound on the posterior probability corresponding to the observed estimates [22]. All BFDP computations were performed using the Excel spreadsheet provided by Wakefield (http://faculty.washington/edu/jonno/cv.html) [13].
3. Tendencies of FPRP and BFDP with P values
The main purpose of the methods we introduced in this review is to discover false-positive results, which already satisfy the current scientific statistical standards regarding a P value indicating statistical significance. Therefore, with the published results of the SLE field synopsis and systematic review [4], we calculated the proportion of noteworthy variants relevant to the P value. A conventional meta-analysis of observational studies defines its significance with a P value of less than 0.05, whereas a meta-analysis of GWAS uses 5×10⁻⁸ as a threshold. We excluded data with which the results of FPRP or BFDP were not mathematically calculable, expressed as “NA.”
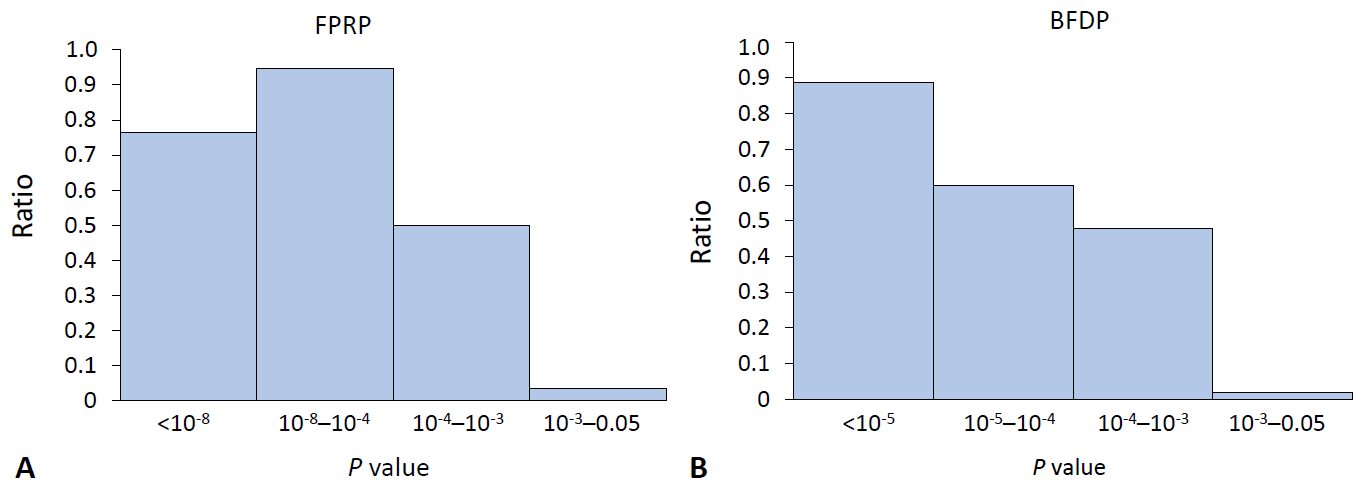
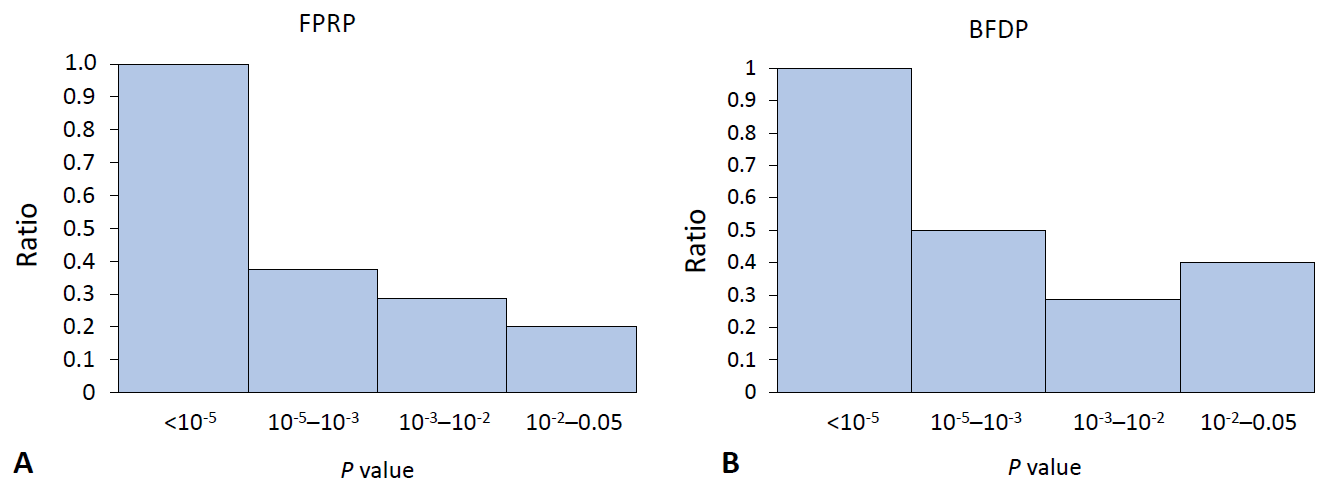
The ratio for the noteworthy variants out of positive findings in the meta-analysis of observational studies decreased stiffly as the P value exceeded 0.001 for both FPRP and BFDP (Fig. 1). In the same manner, the ratio of the noteworthy findings among the meta-analysis results of GWAS by FPRP computation decreased to 0.5 with a P value >10-5 (Fig. 2), while BFDP also showed a sudden decrease in the number of noteworthy variants at a P≥10-5. The difference between FPRP and BFDP is that more genetic variants located in the borderline (5×10⁻⁸ <P<0.05) significance in GWAS meta-analyses were noteworthy in BFDP than in FPRP (Fig. 2).

The ratio of noteworthy findings over statistically significant findings by FPRP and BFDP in the meta-analysis of observational studies. The y-axis is the ratio of noteworthy variants by FPRP (A): 0.76, 0.95, 0.5, 0.04 from left to right; and by BFDP (B): 0.89, 0.6, 0.48, 0.02. The x-axis is the range of P values. BFDP, Bayesian false-discovery probability; FPRP, false-positive report probability.

The ratio of noteworthy findings by FPRP and BFDP in the meta-analysis of genome-wide association studies. The y-axis is the ratio of noteworthy findings over statistically significant findings by FPRP (A): 1.0, 0.38, 0.29, 0.2; and by BFDP (B): 1.0, 0.5, 0.29, 0.4. BFDP, Bayesian false-discovery probability; FPRP, false-positive report probability.
The current cutoff for a P<0.05 might be too broad, as it would yield too many false-positive results, thus leading to the overinterpretation of the retrieved results. According to the findings of this review, the statistical significance in the meta-analysis of observational studies requires evaluation with a more stringent P value. Furthermore, GWAS meta-analysis results are highly reliable because all variants under a P value of 5×10⁻⁸ were noteworthy with FPRP and BFDP computations (Table 1).
Noteworthy genetic variants in SLE and their functions
Our previous systematic review of SLE calculated noteworthiness of published significant genetic variants using FPRP and BFDP [4]. Table 1 summarizes the proportion of noteworthy gene variants in each type of GWAS according to the different statistical approaches and significance thresholds. Seventy-five distinct genes with 133 genotype comparisons from observational studies were identified as significant. Of the 133 genotype comparisons, 23 (17%) and 11 (8%) were verified as noteworthy (<0.2) using FPRP estimation at a prior probability of 10-3 and 10-6 with statistical power to detect an OR of 1.2. In addition, 34 (26%) and 18 (14%) showed a noteworthiness at a prior probability of 10-3 and 10-6 with a statistical power to detect an OR of 1.5. In terms of BFDP, 50 (38%) and 29 (22%) comparisons had noteworthy findings (<0.8) at a prior probability of 10-3 and 10-6. Seventy genes with 89 genotype comparisons extracted from GWAS were reportedly significant with a P<5×10⁻⁸. On FPRP, 64 comparisons were noteworthy (<0.2) at both prior probabilities of 10-3 and 10-6 with a statistical power to detect an OR of 1.2 and 1.5. The noteworthiness of 25 comparisons was not available for the same reason as mentioned above. With respect to BFDP estimations, all of the calculated values at both prior probabilities of 10-3 and 10-6 were <0.8, indicating noteworthiness. As a result, all of the statistically significant results of the meta-analyses of GWAS were assessed to be definitely noteworthy under FPRP and BFDP. A total of 25 genes with 27 genotype comparisons were organized, which had a borderline statistical significance (P value of 0.05 to 5×10⁻⁸). Under FPRP estimation, 13 (48%) and 2 (7%) were assessed to be noteworthy at a prior probability of 10-3 and 10-6 with a statistical power to detect an OR of 1.2. Moreover, 13 (48%) and 2 (7%) were identified as noteworthy at a prior probability of 10-3 and 10-6 with a statistical power to detect an OR of 1.5. In terms of BFDP, 15 (56%) and 1 (4%) comparisons were found noteworthy at a prior probability of 10-3 and 10-6.
We found that the GWAS meta-analysis results were highly reliable because all variants under a P value of 5×10⁻⁸ were evaluated as noteworthy with FPRP and BFDP computations. The GWAS results with P<5×10⁻⁸ could be identically replicated in observational studies. In addition, of the 27 genotype comparisons that had borderline statistical significance, 13 (48%) were noteworthy under both Bayesian methods, suggesting that results with a P value of 0.05 to 5×10⁻⁸ may be genuine associations. To verify the results obtained from genetic analyses, both Bayesian approaches may have advantages, especially for the interpretation of results obtained from observational studies. When determining the results of GWAS with P values ranging between 0.05 and 5×10⁻⁸, statistical approaches other than single standard significance may be beneficial, and we were able to confirm significance in almost half of the genetic variants within this borderline significance range. Therefore, it is attractive to speculate that genetic variants with borderline significance require further analysis for a genuine association [4].
Noteworthy genetic variants in SLE and their functions are summarized in Table 2. Investigation of the sorted list of significant genes identified a prominent representation of genes that have a role in interferon (IFN) signaling, which was in line with previous reports [23,24]. These genes were IFIH1, IRF5, IRF8, and STAT4 from the observational studies and IFIH1, IRF5, IRF7, IRF8, PRDM1-ATG5, STAT4, ad TYK2 from GWAS. IFN-α, a type I IFN, is traditionally known to be concerned with a defense against viruses and its involvement in breaking self-tolerance via the activation of antigen-presenting cells after absorbing self-materials [25], which explains some essential parts of the current understanding of SLE [26]. In addition, the proportion of genes whose function is related to nuclear factor kappa B (NF-κB) signaling was also outstanding. NF-κB plays a critical role in proinflammatory processes through regulating the expression of tumor necrosis factor-α (TNF-α), toll-like receptors, and interleukin 1 receptor [27]. These were MECP2 and TNFAIP3 from observational studies and IKBKE, IRAK1, MECP2, SLC15A4, TNFAIP3, TNIP1, and UBE2L3 from GWAS. Other genes with relevance to the immune system such as complement activation, apoptosis, and neutrophil, monocyte, NK cell, and B- and T-cell signaling were significantly related to the genetic susceptibility loci for SLE [28].
Gene network analysis
As the bioinformatic open resources are overwhelming, we thought that using noteworthy genetic variants for gene network analyses with open source methods should derive a genuine etiopathology of the respective disease. Several databases have compiled data from experimental and computational sources, integrating extensive protein-protein interactions (PPIs) or gene-gene interactions. STRING (Search Tool for the Retrieval of Interacting Genes/Proteins) and GeneMANIA are representative freely available databases that were constructed from various biological and literature sources. The utilization of these interactions among genes aids the understanding of the underlying biological mechanisms as well as the hidden pathology of human disease associated with the genes [29]. Since different databases are constructed based on different biological evidence, the utilization of the appropriate network database is very critical for identifying meaningful interaction information. A recent interesting benchmarking study comparing the performance of different network databases in the context of virus-host interactions and STRING databases revealed overall good performance for detecting known host factors for various human genes [30]. In this review, we introduced the process of sorting out noteworthy variants from the known statistically significant variants; furthermore, we applied the 2 representative databases STRING and GeneMANIA and genetic variants associated with SLE in our previous field synopsis [4] to the STRING database to construct a PPI network.
1. GeneMANIA
The GeneMANIA database [31] includes 1,800 networks covering 500 million gene-gene interactions and PPI from 9 organisms (Arabidopsis thaliana, Caenorhabditis elegans, Danio rerio, Drosophila melanogaster, Escherichia coli, Homo sapiens, Mus musculus, Rattus norvegicus, and Saccharomyces cerevisiae). It provides a comprehensive compiled network from hundreds of different sources such as coexpression, genetic interactions, colocalization information, and shared protein domains. GeneMANIA utilizes linear regression models to combine different functional association networks from multiple data sources and Gaussian field label propagation methods are applied to predict the gene function based on composite functional networks. The combined edge scores are calculated as the weighted sum of scores by emphasizing the directly connected genes.
2. STRING database
The STRING 9.1 network database [32] is one of the largest databases of direct (physical) PPI and indirect (functional) interactions constructed from various data sources. The STRING database covers 9.6 million proteins from 2,031 different organisms and incorporates PPI information from a number of known databases, such as Reactome, KEGG pathways, HPRD, BioGrid, and MINT as well as automated text mining including PubMed abstracts and OMIM database. It also includes computationally predicted PPI by utilizing ortholog information between different species. The STRING database provides the PPI score using a naïve Bayesian algorithm to combine different scores from different biological evidence with a correction for random observation probability of interactions. Thus, the combined STRING edge score is used to indicate strong confidence for such PPI.
3. Construction of PPI networks using the STRING database
In our study, we used the STRING database to identify the PPI associated with gene mapping to genetic variants of SLE. First, our gene lists represented by gene symbol were converted to Ensembl protein identifiers using mapping information from the NCBI ftp server. Some of the gene symbols were preprocessed for conversion to official gene symbols before Ensembl ID mapping due to their ambiguity. Based on given Ensembl protein identifiers and the minimum PPI score, each PPI is extracted from the STRING databases. Depending on interests, we also extracted the closely associated genes with current gene lists using the Random Walk with Restart Algorithm [33], where functional closeness of 2 gene lists is represented by an XD score using the STRING database. We applied our in-house program written with Perl and C. Once the functionally related genes are selected, Cytoscape [34], which is a free software package for visualizing, modeling, and analyzing molecular and genetic interaction networks, is used for network visualization. To import the PPI file into Cytoscape, users must prepare the network input file constructed from at least 3 columns: source node, interaction type, and target node. Edge attributes such as interaction score can also be imported into the network. The node property file can be prepared to indicate any property of each gene/proteins such as name, function, and node type (i.e., node data source). These 2 files (i.e., network file, node property file) were imported into Cytoscape for the visualization.
4. PPI network for SLE
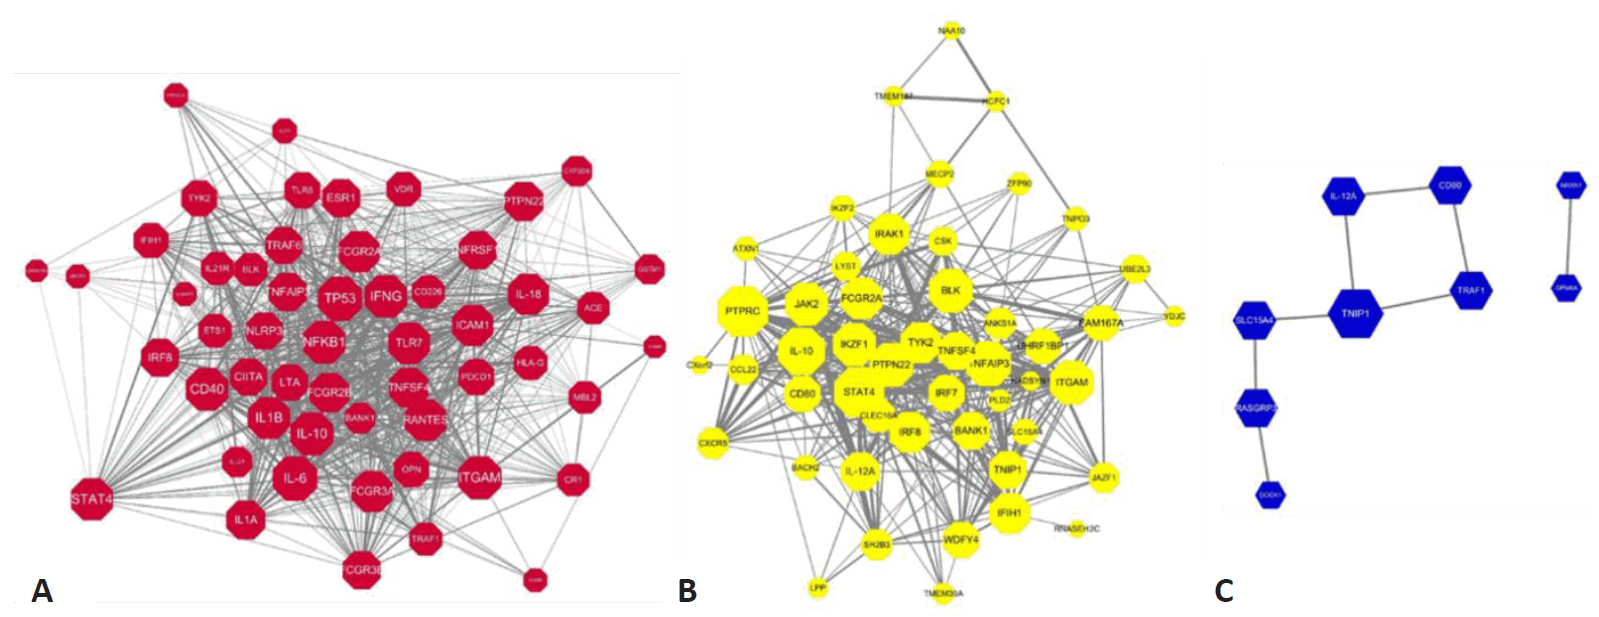
Here we constructed the PPI network with genes mapping to the compiled reported genetic variants of SLE. Fig. 3A represents the PPI networks with genes having genetic variants with statistical significance from observational studies. Among the 135 genetic variants mapping to 79 genes, 54 genes revealed 846 interactions between them and IL-6, TP53, IL-10, ITGAM, and NFKB1 were identified as strong hub nodes. In addition, TRAF6, IRF5, ITGAM, TNFAIP3, and BLK were identified as critical genes having more than 4 reported genetic variants in SLE, which shows a strong association of such genes with SLE. Fig. 3B and 3C also show the PPI networks with statistically significant and borderline genes from GWAS studies (i.e., P<5×10⁻⁸, 5×10⁻⁸ <P<0.05), respectively. TNFSF4, CD44, STAT4, and TNAFAIP2 also showed a strong association with SLE from GWAS studies. Moreover, PTPRC, STAT4, and IL-10 also revealed strong hubness in the PPI network.

PPI network with genes mapping to the statistically significant genetic variants. (A) Statistically significant genes from observational studies (T1: P<0.05), (B) statistically significant genes (T2: P<5×10⁻⁸) from GWAS, (C) statistically significant genes at the borderline (T3: 5×10⁻⁸<P<0.05) from GWAS. Node size represents the number of interactions, while edge width represents the PPI score from the STRING (Search Tool for the Retrieval of Interacting Genes/Proteins) databases. The width of interactions shows the strength of the interactions mapping to the STRING score. PPI, protein-protein interactions; GWAS, gene-wide association studies.
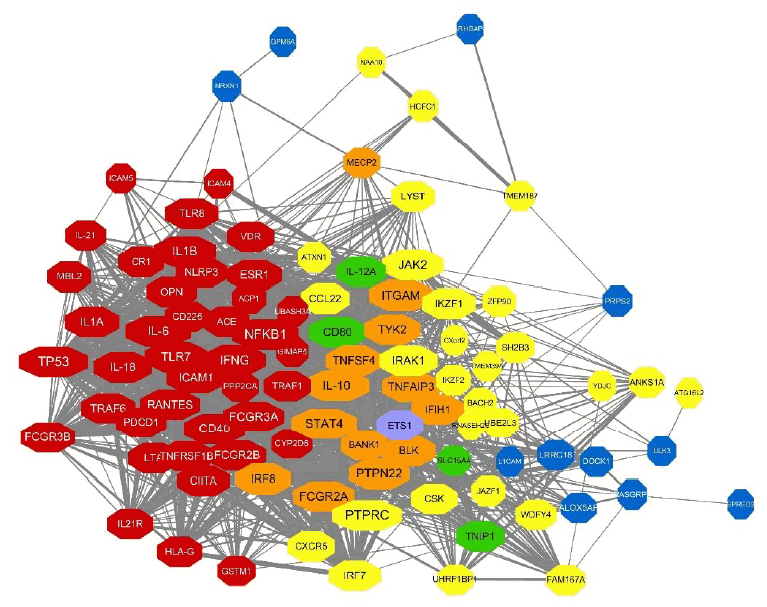
Next, we integrated these PPI networks with the genes mapping to overall genetic variants of SLE from 3 criteria. As shown in Fig. 4, genes from observational studies, GWAS with 2 different P values, are closely connected within the PPI network. Many genes have genetic variants identified from at least 2 studies (i.e., orange, green, and purple nodes). Among the 148 genes, 97 revealed 1,554 PPI. Interestingly, TP53, PTPRC, NFKB1, IL-6, IL-10, and STAT4 have more than 60 interactions in the PPI network and IL-10, STAT4, ITGAM, FCGR2A, and PTPN22 are also identified as genes having genetic variants in SLE from both observational and GWAS.

Compiled PPI network with genes mapping to the genetic variants identified using different criteria. The node color of genes represents the evidence for genetic variants mapping to genes. Red indicates genes from observational studies (T1), yellow indicates statistically significant genes from GWAS (T2), and blue indicates borderline significant genes from GWAS (T3). Orange, green, and purple genes are genetic variants of SLE identified from at least 2 criteria (T1 and T2, T2 and T3, and T1 and T3, respectively). Note that miR-146a is identified from all 3 criteria (T1, T2, and T3) but not shown in the PPI network. PPI, protein-protein interaction; GWAS, genome-wide association study.
Discussion
In this review, we provided general concepts for applying Bayesian methods and gene network analyses to interpret genetic epidemiology results. The Bayesian approach is unfamiliar in genetics and the need for filtering true-positive or “noteworthy” genetic variants is unavoidable due to the enlarging amount of research data. Although a meta-analysis provides one of the highest levels of evidence within research in the medical field, different meta-analyses from different groups must be integrated and rehighlighted. We refined scattered positive data of meta-analyses in SLE with discovering false-positive results using Bayesian approaches, FPRP and BFDP, consequently suggesting a comprehensive PPI for the disease.
The Bayesian approach and its value depend on the prior probabilities, the calculation of power (1-β), and the probability of type I error (α). FPRP has been criticized for its heuristic derivation of α and 1-β as P0(t) and Pδ(t), for which P0(t) is the probability of observing a value greater than |t| or less than -|t| under the null hypothesis, versus Pδ(t) under the alternative; in other words, α and 1-β are pre-study quantities as properties of a test, while P0(t) and Pδ(t) are post-study parameters [22], in fact, not related to the test genuine parameters. Also, FPRP calculates its likelihood with its tail-area; thus, information is lost compared to BFDP, in which the exact ratio of the probability densities in the indicated point is calculated. Still, both assessments are recommended in a study to determine the true impact of the discovery.
Our gene network construction with genes having noteworthy genetic variants found sound PPI in SLE. The hub genes with more than 50 interactions were PTPRC, TP53, NFKB1, IL6, STAT4, IL10, ITGAM, TLR7, IFNG, IL1B, FCGR2A, JAK2, CD40, FCGR3A, PTPN22, RANTES, ICAM1, IRAK1, FCGR2B, CD80, IL18, and TNFAIP3.
The PPI construction using the STRING database provides insight for further wet lab-based research. On the other hand, although observational studies or GWAS elicited statistically significant genetic variations, they might not reveal the actual biological mechanism until epigenetic or molecular changes are proven. To overcome this hurdle, a combination analysis of gene expression and the matching SNP profile may be the way forward for discovering the disease etiology.
Notes
No potential conflict of interest relevant to this article was reported.
Acknowledgements
This study was supported by Basic Science Research Program through the National Research Foundation of Korea (NRF) funded by the Ministry of Education (2017R1D1A1B03032457) and Hankuk University of Foreign Studies Research Fund.


