Clinical impact of admission hypothermia in very low birth weight infants: results from Korean Neonatal Network
Article information

Abstract
Background
Preterm infants have difficulty maintaining body temperature after birth. However, clinical guidelines advocate that neonatal body temperature should be maintained at 36.5°C–37.5°C.
Purpose
We aimed to investigate the incidence of admission hypothermia in very low birth weight (VLBW) infants and to determine the association of admission temperature with in-hospital mortality and morbidities.
Methods
A cohort study using prospectively collected data involving 70 neonatal intensive care units (NICUs) that participate in the Korean Neonatal Network. From registered infants born between January 2013 and December 2015, 5,343 VLBW infants born at less than 33 weeks of gestation were reviewed.
Results
The mean admission temperature was 36.1°C±0.6°C, with a range of 31.9°C to 38.4°C. Approximately 74.1% of infants had an admission hypothermia of <36.5°C. Lower birth weight, intubation in the delivery room and Apgar score <7 at 5 minutes were significantly related to admission hypothermia. The mortality was the lowest at 36.5°C–37.5°C and adjusted odd ratios for all deaths increased to 1.38 (95% confidence interval [CI], 1.04–1.83), 1.44 (95% CI, 1.05–1.97) and 1.86 (95% CI, 1.22–2.82) for infants with admission temperatures of 36.0°C–36.4°C, 35.0°C–35.9°C, and <35.0°C, respectively. Admission hypothermia was also associated with high likelihoods of bronchopulmonary dysplasia, pulmonary hypertension, proven sepsis, pulmonary hemorrhage, air-leak, seizure, grade 3 or higher intraventricular hemorrhage and advanced retinopathy of prematurity requiring laser therapy.
Conclusion
A large portion of preterm infants in Korea had hypothermia at NICU admission, which was associated with high mortality and several important morbidities. More aggressive interventions aimed at reducing hypothermia are required in this high-risk population.
Key message
Question: Is low temperature at NICU admission associated with mortality and morbidities in preterm infants?
Finding: The mortality was the lowest at normothermia (36.5°C–37.5°C) and increased with hypothermia at NICU admission. Admission hypothermia was also associated with bronchopulmonary dysplasia, pulmonary hypertension, sepsis, seizure, intraventricular hemorrhage, and retinopathy of prematurity.
Meaning: More aggressive approaches are required to reduce admission hypothermia in preterm infants.
Introduction
Preterm infants have difficulty maintaining body temperature after birth, and hypothermia can occur easily as a result of their large surface area-to-body mass ratio and poor thermoregulation [1,2]. The World Health Organization (WHO) classifies 36.0°C to 36.4°C as cold stress or mild hypothermia, 32.0°C to 35.9°C as moderate hypothermia, and lower than 32.0°C as severe hypothermia, and the WHO advocates that neonatal body temperature should be maintained at 36.5°C to 37.5°C [3]. In 2012, the American Academy of Pediatrics/American College of Obstetricians and Gynecologists distributed guidelines recommending an axillary temperature range of 36.5°C to 37.4°C in the delivery room (DR) [4]. Hypothermia has been confirmed to be significantly related to mortality [5] and morbidities, including necrotizing enterocolitis (NEC) [5-8], intraventricular hemorrhage (IVH) [9] and late-onset sepsis [8] in preterm infants. To reduce these complications, many studies have suggested ways to prevent hypothermia, including plastic wrapping without drying, covering the head with a cap, and using radiant warmers and exothermic mattresses [10-13]. Despite the knowledge and development of new approaches to better maintain body temperature, recent studies have noted that a significant proportion of preterm infants in high-resource countries have failed to maintain normothermia after delivery [7,9,14-18]. With the marked improvement of intensive care for preterm infants over the past few decades, mortality and main morbidities of very low birth weight (VLBW) infants have decreased in Korea but are still higher than those in the United States, Europe, and Japan [19,20]. We aimed to investigate the incidence of admission hypothermia in VLBW infants using the Korean national registry data and to determine the association of admission temperature with in-hospital mortality and morbidities.
Methods
1. Study participants and outcomes
We performed a cohort study using prospectively collected data from 70 neonatal intensive care units (NICUs) participating in the Korean Neonatal Network (KNN). The KNN database provides maternal, delivery, and neonatal data until the first NICU discharge, and the data are collected by trained staff using a standardized operating procedure [21]. The registration of data in the KNN was approved by the Institutional Review Board of each participating center (approval number: 2013-03-002). Informed consent was obtained from the parents of each infant prior to participation in the KNN registry.
From 5,860 registered VLBW infants between January 1, 2013, and December 31, 2015, we included 5,343 infants born at less than 33 weeks of gestation. To reduce the effects of other causes on study outcomes, we excluded infants with congenital respiratory, gastrointestinal or cardiovascular anomalies. Infants who had no data on admission temperature measured within 1 hour after the birth or who were transferred to other hospitals were also excluded. The admission temperature was defined as the infant’s axillary or rectal temperature measured on admission to the NICU within 1 hour after birth, in accordance with local routines. Because the WHO classification of moderate hypothermia includes a large range of temperature (32.0°C–35.9°C) and severe hypothermia (<32.0°C) is extremely rare, we divided included infants into 5 groups according to their admission temperature: <35.0°C, 35.0°C–35.9°C, 36.0°C–36.4°C, 36.5°C–37.5°C, and >37.5°C.
The maternal variables included diabetes, pregnancy-induced hypertension, histological chorioamnionitis, rupture of the membranes (>24 hours), cesarean section, and oligohydramnios. The neonatal variables included singleton or not, gender, gestational age, birth weight, small for gestational age, Apgar score at 5 minutes, immediate resuscitation at delivery including intubation, chest compressions and use of surfactant at the DR, immediate postnatal blood gas analysis results (measured within 1 hour after birth), pulmonary hemorrhage, pulmonary air-leak, bronchopulmonary dysplasia (BPD), pulmonary hypertension, NEC, bacterial sepsis, hypotension, seizure, IVH, periventricular leukomalacia (PVL), retinopathy of prematurity (ROP), automated auditory brainstem response (AABR) test results before NICU discharge, cumulative duration of invasive mechanical ventilation and parenteral nutrition, and survival to hospital discharge or death. We identified the time of death for infants who died (death before or after 28 days). The most severe stage of IVH was based on the results of all brain ultrasound findings until the first NICU discharge was recorded regardless of the time of first observation or occurrence, as this information was not collected. IVH grading was determined according to Papile’s classification [22]. NEC was defined according to a modified Bell staging classification. Bacterial sepsis was defined as a positive result on 1 or more bacterial cultures obtained from the blood of infants with clinical signs of infection or those treated with appropriate antibiotics for 5 or more days or until death. Pulmonary hypertension was considered present only when accompanied by medical treatment after diagnosis based on echocardiography. PVL was diagnosed based on the results of brain ultrasound or magnetic resonance imaging findings. The duration of mechanical ventilation was counted as each day that the infant received any respiratory support through an endotracheal tube because of respiratory insufficiency. Brief intubation for surgery with general anesthesia was not included in the calculation of mechanical ventilation duration. The duration of parenteral nutrition was the sum of the total number of days when any amino acids or lipids were provided intravenously before death or discharge.
The primary outcome was survival to hospital discharge or death. Secondary outcomes were the various in-hospital morbidities, including BPD, defined as the need for supplemental oxygen or positive pressure support at 36 weeks of postmenstrual age; grade 3 or 4 IVH; stage 2 or higher NEC; culture-proven bacterial sepsis or meningitis at older than 48 hours; PVL and advanced ROP followed by laser coagulation.
2. Statistical analysis
Demographic data are expressed as medians (interquartile ranges) or percentages. For univariate analysis, we used the Kruskal-Wallis analysis or chi-square test. We then evaluated the odds ratios (ORs) according to admission temperature using multivariate logistic regression analysis, with adjustment for factors that had a P<0.1 in the univariate analysis. We also estimated curves for mortality according to the admission temperature. P<0.05 was considered significant. Statistical analyses were conducted using IBM SPSS Statistics ver. 21.0 (IBM Co., Armonk, NY, USA).
Results
Of the 5,343 included infants, 670 infants (12.5%) were excluded for having congenital anomalies (n=127) or no data on admission temperature (n=243) or for being transferred to other hospitals before the first discharge (n=300). The remaining 4,673 infants were included in this analysis, and their characteristics are described in Table 1. Their median gestational age and birth weight were 28.6 weeks and 1,080 g, respectively. Of the 4,673 neonates, 12.8% were small for gestational age. A large proportion of infants were delivered by cesarean section (75.4%) and had been intubated in the DR (69.6%).
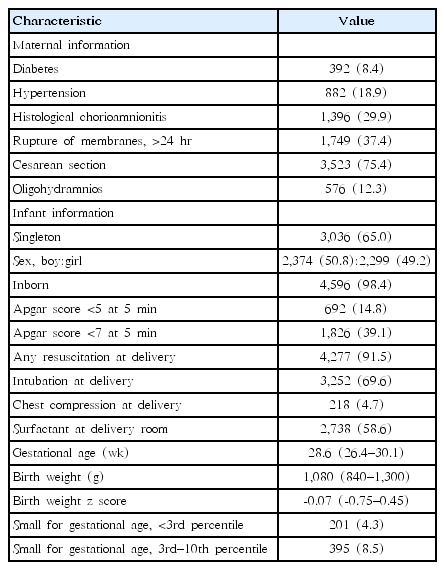
Characteristics of included infants (n=4,673)
The mean (±standard deviation) admission temperature was 36.1°C (±0.6°C), with a range of 31.9°C to 38.4°C. Only 25.2% of infants had a normal admission temperature between 36.5°C and 37.5°C (Fig. 1). Approximately 74.1% of infants had an admission temperature lower than 36.5°C, and 0.7% had an admission temperature higher than 37.5°C (Fig. 1). Approximately half of the study population (48.4%) had mild hypothermia ranging from 36.0°C to 36.4°C at admission to the NICU, and a quarter of the study population (25.7%) had moderate hypothermia ranging from 32.0°C to 35.9°C. Fig. 2 shows the distribution of admission temperatures according to the gestational age of the infants. Normal admission temperatures (36.5°C–37.5°C) were noted in less than 10% of infants born before 24 weeks of gestation. Although profound hypothermia less than 34°C was observed only in infants born at less than 28 weeks of gestation, the proportion of infants with normal admission temeratures was similar among those born from 26 to 32 weeks of gestation.
Admission temperature distribution. Only 25.2% of infants had a normal admission temperatures ranging from 36.5°C to 37.5°C. Approximately 74.1% of infants had hypothermia <36.5°C, and 0.66% had hyperthermia >37.5°C at neonatal intensive care unit admission.
Admission temperature distribution according to gestational age. Distributions of infants across the range of temperatures recorded according to gestational age.
The demographic characteristics of each group are provided in Table 2. Gestational age, birth weight, small for gestational age, delivery by cesarean section, Apgar score <7 at 5 minutes, intubation in the DR, maternal oligohydramnios, premature rupture of the membranes and chorioamnionitis were associated with admission temperature in the univariate analysis. The multivariate analysis showed that lower birth weight and intubation in the DR were significantly related to admission hypothermia, and an Apgar score of less than 7 at 5 min increased the risks of both hypothermia and hyperthermia at NICU admission (Table 3).
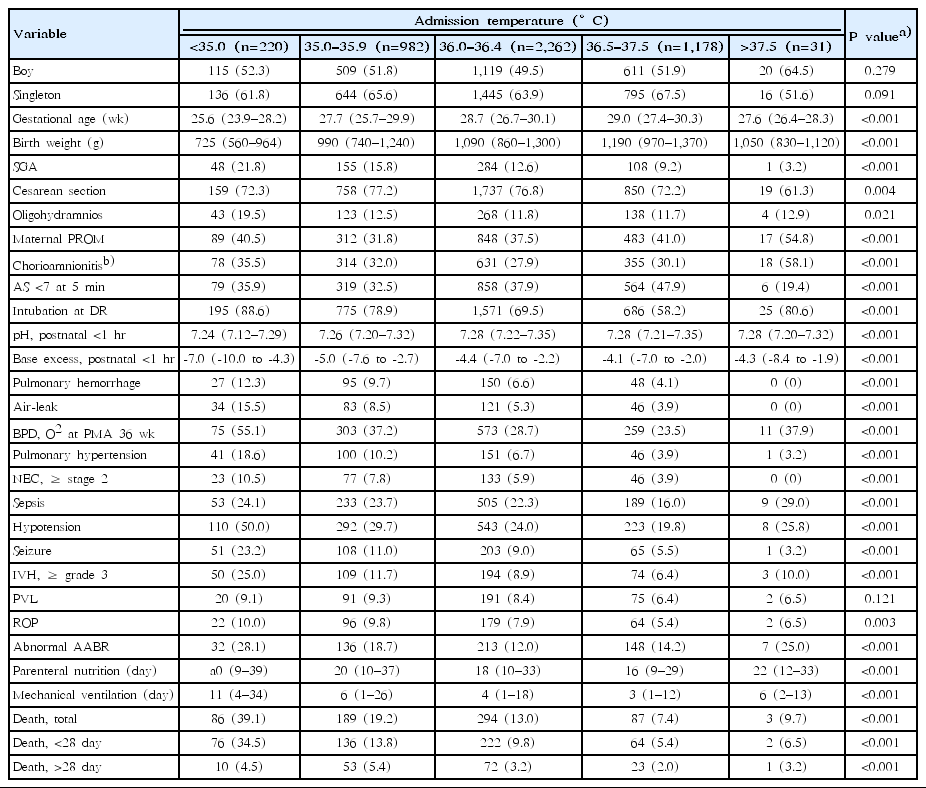
Univariate analysis of associations between characteristics and admission temperatures
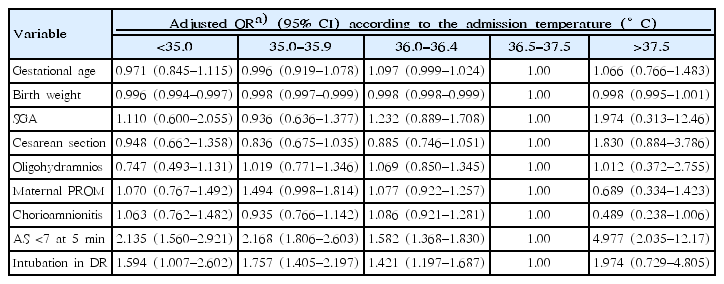
Logistic regression analysis for independent variables associated with the admission temperatures
The primary outcome, all mortality, was significantly associated with the admission temperature. Compared with infants with normothermia (36.5°C–37.5°C), the adjusted ORs for all deaths increased to 1.38 (95% confidence interval [CI], 1.04–1.83), 1.44 (95% CI, 1.05–1.97), and 1.86 (95% CI, 1.22–2.82) for infants with admission hypothermia of 36.0°C–36.4°C, 35.0°C–35.9°C, and <35.0°C, respectively (Table 4). The mortality in infants with an admission temperature of >37.5°C did not differ from those with normothermia (Table 4). When dividing mortality according to the time of death, the adjusted ORs of death before 28 days increased to 1.40 (95% CI, 1.02–1.92) and 2.16 (95% CI, 1.39–3.34) for infants with temperatures of 35.0°C–35.9°C and <35.0°C at NICU admission, respectively. Death after 28 days was not associated with admission hypothermia (Table 4). When we estimated the curve for mortality according to admission temperature, the curve was represented by a second-order equation and was statistically significant (P<0.001) (Fig. 3). Mortality was the lowest at admission temperatures ranging from 36.5°C to 37.5°C.
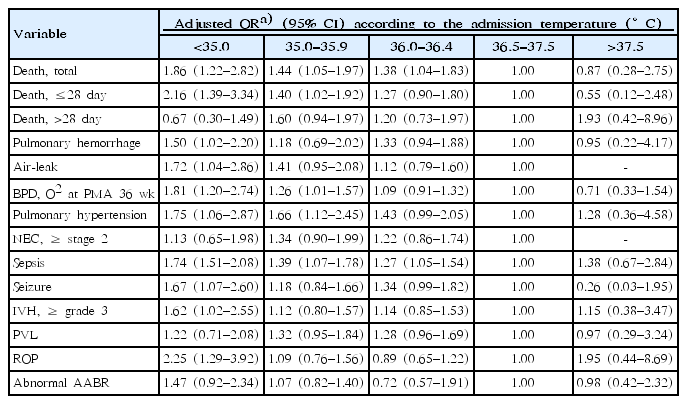
Multivariate analysis of the association between death and admission temperatures
Association of admission temperature with mortality rate. This curve represents the association of admission temperature with a mortality rate as a second-order equation. Mortality was the lowest at an admission temperature of 36.5°C –37.5°C (P<0.001).
The univariate analysis of the clinical influence of admission temperature indicated that pulmonary hemorrhage, air-leak, BPD, pulmonary hypertension, stage 2 or higher NEC, culture-proven sepsis, hypotension, grade 3 or higher IVH, advanced ROP requiring laser surgery, abnormal AABR test results, and the duration of parenteral nutrition and mechanical ventilation, but not PVL, were associated with admission temperature (Table 2). In the multivariate analysis, admission hypothermia was associated with pulmonary hemorrhage, air-leak, BPD at 36 weeks, pulmonary hypertension, proven sepsis, seizure, high-grade IVH, and advanced ROP requiring laser therapy (Table 4). Compared with infants who were normothermic (36.5°C–37.5°C), the adjusted OR of BPD and pulmonary hypertension increased to 1.26 (95% CI, 1.01–1.57) and 1.66 (95% CI, 1.12–2.45) for infants with admission temperatures of 35.0°C–35.9°C and 1.81 (95% CI, 1.20–2.86) and 1.75 (95% CI, 1.06– 2.87) for infants with admission temperatures <35.0°C. The adjusted ORs of sepsis increased to 1.27 (95% CI, 1.05–1.54), 1.39 (95% CI, 1.07–1.78), and 1.74 (95% CI, 1.51–2.08) for infants with admission temperatures of 36.0°C–36.4°C, 35.0°C–35.9°C, and <35.0°C, respectively. For pulmonary hemorrhage, air-leak, seizure, IVH grade 3 or 4 and advanced ROP requiring laser, significantly higher ORs were observed in infants with admission temperatures <35°C than in normothermic infants. NEC stage ≥2, PVL and abnormal AABR test results were not significantly correlated with admission temperature in the multivariate analysis (Table 4).
Discussion
This is the first large national cohort study to investigate the incidence of admission hypothermia and its association with in-hospital mortality and morbidities in Korea. From the estimated curve, we would be able to predict individual mortality according to admission temperature. Despite general enhancements in perinatal intensive care and many studies showing the relationship of admission hypothermia with neonatal mortality, we found that admission hypothermia (<36.5°C) is still common in Korea, occurring in 74.1% of VLBW and less than 33 weeks preterm infants. The proportion of infants with normal temperature ranges at NICU admission (25.2%) was much lower than those in other developed countries: 48.8% in a Brazilian cohort of less than 34 weeks [17], 57.2% in a Canadian cohort of less than 33 weeks [8] and 42.2% in a European cohort of less than 32 weeks [18]. More concerning is that the proportion of infants with hypothermia below 36.0°C was 25.7% in this Korean cohort compared to 11.9% in a Canadian cohort [8] and 22.3% in a European cohort [18].
Unfortunately, we did not include a comparison between centers. There might be large variations in the incidences and proportions of admission hypothermia among centers, which would be determined by the DR temperature and the policies of each center for preventing hypothermia at delivery. However, the DR temperature or thermoregulation policies of each center were not included in these cohort data, and the Korean Centers for Disease Control and Prevention did not permit individual data of each center to be evaluated. From the report of one center belonging to the KNN located in Seoul, which had a smaller proportion of infants (54.9%) with admission hypothermia (<36.5°C) than our national data (74.1%) [23], we can infer that the center-to-center difference would be large.
The key area to reduce admission hypothermia is in the DR. This hypothesis is supported by our results that a low Apgar score at 5 minutes and intubation in the DR were independently related to a lower admission temperature (Table 3). Infants who require resuscitation are usually sicker, and warming infants in the midst of resuscitation is difficult or neglected. According to the Neonatal Resuscitation Program guidelines [10], the temperature of the DR should be 23°C to 25°C for all preterm newborns and 25°C or higher for neonates less than 28 weeks of gestation. The American Colleges of Obstetricians and Gynecologists recommends prewarming of the DR to 26°C for neonates requiring any resuscitation [4]. In addition, other warming techniques should be performed to decrease heat loss, including placing the baby under a preheated radiant warmer, covering the baby in plastic wrapping, or using an exothermic mattress or prewarmed blankets or caps. In addition, the delivery of heated humidified gases in the DR and during neonatal transport might be helpful for infants requiring respiratory support at birth [24]. Warming and humidification of the inspired gas for respiratory support during neonatal resuscitation are not routinely performed in Korea. In a Brazilian study, the use of positive pressure ventilation with cold air in the DR and during transport increased the likelihood of hypothermia at NICU admission by 1.40 (95% CI, 1.03–1.88) fold and 1.51 (95% CI, 1.08–2.13) fold, respectively [17]. Although we could not determine whether the neonatal resuscitation policies of each center and their variation affects this high incidence of admission hypotension in Korea, our results will be useful for the application of evidence-based quality improvement activities in each center, aiming to reduce admission hypothermia in preterm infants.
The multivariate analysis in the present study indicated that the effect of gestational age alone was small but that birth weight was more strongly associated with admission hypothermia. Similar to the results of the multivariate analysis, the proportion of normothermic infants did not differ from 26 to 32 weeks of gestation in our study (Fig. 2). A mismatch between heat production and heat exchange with the ambient environment in the DR is determined by a large surface area and surface-to-weight ratio; thus, birth weight would be more closely associated with body temperature in preterm infants than gestational age.
This study has shown similar results to those of previous studies that have reported a significant correlation between admission hypothermia and mortality [5-9,15,17,18]. In 868 infants, including VLBW infants from 18 centers in Malaysia, the OR for early death was 2.0 (95% CI, 1.2–3.4) for infants with temperatures <36.5°C at NICU admission [15]. Laptook et al. [7] studied 5,277 VLBW infants and found that the risk of death increased 28% for every 1°C decrease in admission temperature. In a Brazilian cohort study of 1,764 infants less than 32 weeks of gestation, the likelihood of early death was 1.64 (95% CI, 1.03–2.61)-fold higher in infants with temperatures <35°C at NICU admission [17]. The adjusted OR of all death in our study was 1.86 (95% CI, 1.22–2.82) for infants with hypothermia <35.0°C. The OR of early death (<28 days) was higher than that of all death: 2.16 (95% CI, 1.39–3.34) in these infants. Mortality was inversely related to admission temperature, but the relationship was not linear, but rather a second-order equation. A second-order curve indicates that the existence of the lowest mortality point for admission temperature and hyperthermia should be avoided for the best outcome for these vulnerable preterm infants. The lowest mortality point of temperature reflects the lowest oxygen consumption and best clinical outcomes. Higher than normal temperature has been previously associated with mortality and morbidities [25], but we could not confirm these associations in this study. This might be explained by the low number of infants with admission hyperthermia in our study.
The association between admission temperature and variable clinical outcomes is mostly consistent with the results of previous studies [6-8,14,18,23,26]. The association in our study between admission temperature and several morbidities, including BPD, sepsis and high-grade IVH, provides a potential link to the relationship between admission temperature and mortality. Even mild hypothermia, called cold stress (36.0°C–36.4°C), increased the OR of sepsis to 1.27 (95% CI, 1.05–1.54) compared to the normal temperature group in our study. Laptook et al. [7] reported an 11% increase in sepsis with each 1°C decrease in admission temperature. Whether late-onset sepsis remote from birth is causally linked to admission temperature is unclear. From adult studies showing that perioperative normothermia reduces postoperative infectious complications and since low temperature impairs chemotaxis, phagocytic engulfment and digestion of human leukocytes, we can speculate that low temperature has a strong impact on the immature and unstable immune function of these premature infants [27,28].
Our study has several limitations. First, we could not obtain the hospital-specific data from each NICU registered in the KNN. Not only did we not know the temperature of the DR of each center, but we also could not evaluate the policies for preventing hypothermia in the DR at each center. Second, our study collected data from the national cohort of VLBW infants; growth-restricted mature infants could be included in this cohort. To overcome this limitation, we analyzed data only for infants less than 33 weeks of gestational age. Third, body temperature was not collected using uniform methods, and we did not register the site at which the temperature was measured, which might have influenced the precision of the temperature. Recent studies have shown differences between axillary and rectal measurements but have also indicated that the differences are smaller in infants of younger gestational ages [29-32]. Fourth, 243 infants (5.2%) had missing admission temperatures, and 300 infants (6.4%) were excluded due to transfer to other hospitals, which could have potentially biased the results.
Whether the prevention of low temperatures at birth decreases mortality or whether low admission temperature is part of a casual path or simply a marker for an increase in the likelihood of mortality cannot be determined from this observational analysis. The strengths of our study included the use of data from a large nationwide dataset. The large amount of data also enabled us to evaluate the association between hypothermia at NICU admission and neonatal outcomes. The results of this observational cohort study demonstrate that minimizing the extent of temperature reduction at birth for premature infants remains challenging. This could be achieved by a combination of interventions that together aimed to counteract physical mechanisms of heat loss of preterm infants through interdisciplinary approaches involving obstetric and neonatal teams. In addition, increasing awareness about both the prevalence and the possible risks associated with hypothermia may be the motivation for improving clinical practices and abolishing hypothermia [33,34]. Additionally, consistent and standardized measurement of admission temperature should be an integral part of any quality improvement work targeting hypothermia after very preterm birth.
Despite the recent focus on preventing hypothermia after preterm birth, a large proportion of VLBW infants in Korea still have low temperatures at NICU admission. Admission hypothermia is associated with high mortality. In particular, there is a high correlation with early death before the age of 28 days. Admission hypothermia is also associated with high likelihoods of pulmonary hemorrhage, air-leak, BPD, pulmonary hypertension, sepsis, seizure, high-grade IVH, and advanced ROP. Constant and more integrative approaches are required to better maintain body temperature immediately after birth in this high-risk population.
Notes
No potential conflict of interest relevant to this article was reported.
Acknowledgements
This research was supported by a research fund (2016-ER6307-02#) from the Korea Centers for Disease Control and Prevention. We thank the administrative staff of the KNN and all the members of each participating center for their efforts in data collection.