The effect of high fat dietary modification and nutritional status on the outcome of critically ill ventilated children: single-center study
Article information

Abstract
Background
Ventilator dependency constitutes a major problem in the intensive care setting. Malnutrition is considered a major determinant of extubation failure, however, attention has been attracted to modulating carbon dioxide production through decreasing carbohydrate loading and increasing the percent of fat in enteral feeds. The detected interrelation between substrate oxidation and ventilation outcome became the base of several research to determine the appropriate composition of the nonprotein calories of diet in ventilated patients.
Purpose
We aimed to assess the effect of high-fat dietary modification and nutritional status on ventilatory and final outcomes of pediatric intensive care.
Methods
Fifty-one ventilated children (1 month to 12 years of age) with pulmonary disease who could be enterally fed, in the Cairo University Pediatric intensive care unit, were divided into 2 groups: group A included 25 patients who received isocaloric high-fat, low-carbohydrate diet; group B included 26 patients who received standard isocaloric diet. Comprehensive nutritional assessment was done for all patients.
Results
Group A had a significant reduction in carbon dioxide tension, but no similar reduction in the duration or level of ventilatory support. Assisted minute ventilation was predicted by weight-for-age and caloric intake rather than the type of diet. Poor nutritional status was associated with higher mortality and lower extubation rates. Mild hypertriglyceridemia and some gastrointestinal intolerance were significant in group A, with no impact on the adequacy of energy or protein delivery.
Conclusion
The high-fat enteral feeding protocol may contribute to reducing carbon dioxide tension, with mild hypertriglyceridemia and negligible gastrointestinal intolerance as potential adverse effects. Optimization of nutritional status rather than dietary modification may improve ventilatory and survival outcomes in critically ill-ventilated children.
Introduction
Ventilator dependency constitutes a major problem in the intensive care setting. Many factors are implicated in the pathophysiology of extubation failure, however, malnutrition is considered a major determinant [1]. In the 1980s, reports began to appear in the literature describing the effects of nutrition on ventilator settings. Excessive carbohydrate loading in parenteral nutrition was suggested to precipitate respiratory acidosis in adult patients with chronic obstructive pulmonary disease who were unable to adequately compensate for increased carbon dioxide (CO2) production [2,3].
Thus, attention has been attracted to using nutritional therapy as a means of modulating CO2 production [4]. Further studies were done on ventilated intensive care adult patients supporting the use of low carbohydrate-high lipid diets. They showed favorable outcomes in the reduction of CO2 production and the duration of mechanical ventilation (MV) with significant improvement in ventilation settings and respiratory indices [5,6]. The detected interrelation between substrate oxidation and ventilation outcome became the base of several discussions to determine the appropriate composition of the nonprotein calories of diet in ventilated patients [1].
Being a tertiary care center with four busy medical pediatric intensive care units (PICUs), our attention was directed towards finding a new helpful feeding protocol for these patients. Many of critically ill patients experience prolonged ventilation and/or ventilator dependency with distressing financial and social burdens. In addition, ventilator dependency is associated with prolonged length of stay and increased morbidity and mortality. The effect of nutritional status on the outcome of ventilated children has been a point of interest of many pediatric intensive care researchers with no more focusing on the effect of modulating the fat composition of their diets. The present study aimed to test the efficacy of a high-fat feeding protocol in reducing CO2 production, shortening of the duration of MV and improving final PICU outcomes in pediatric critically ill ventilated patients. The effect of clinical and biochemical nutritional status on all these parameters was tested as a secondary outcome.
Methods
1. Patients
A randomized controlled trial was carried out at the PICUs of Cairo University Children Hospitals, from October 2015 to January 2017. Closed envelopes were used to randomize patients to the type of diet. Identification number for the clinical trial is PACTR20180200 292319. An informed consent form is signed by all parents upon admission to the PICU.
The study included critically ill ventilated children aged one month to 12 years. All patients had at least one acute respiratory problem that necessitated ventilation at any time during PICU stay. Some patients were admitted to the PICU for other reasons than respiratory and then enrolled in the study when they developed a respiratory problem. Patients were recruited when hemodynamic stability was achieved (normal blood pressure and perfusion with no desaturation for 24 hours) and gastrointestinal tract was functioning (no upper or lower gastrointestinal bleeding, no bilious output with normal intestinal sounds). Patients were excluded if they had inborn errors of metabolism or chronic hepatic, renal or endocrinal disorders.
2. Initial assessment (within 24 hours of recruitment)
1) Respiratory status
Ventilation and oxygenation status were assessed via arterial blood gases analysis for PO2, PCO2, and base deficit. Initial MV mode, ventilation settings and lung indices readings were recorded from the digital display of the ventilator. Assisted minute ventilation (mL/m2/min) was calculated using the recorded expired tidal volume (mL/m2 surface area) multiplied by respiratory rate (breaths/min) at day-1 and -7 of enrollment. It was used as an indicator for the level of ventilatory support delivered to patients.
2) Mortality scoring
Pediatric index of mortality score 2 (PIM-2) score online calculator was used (www.sfar.org/scores2/pim22.html).
3) Anthropometric measurements
Weight was recorded using a digital infant scale for patients less than 2 years. For those older than 2 years, the difference between 2 measures was taken: the nursing staff weight with and without carrying the child. The supine length was performed for most patients. For spastic cerebral palsy patients, a predictive equation was used [7]. World health organization z score values were calculated for weight-for-age, weight-for-length, length-for-age, body mass index (BMI)-for-age, mid-upper arm circumference (MUAC)-for-age and triceps skinfold-for-age using WHO Anthro (version 3.2.2, January 2011) and macros.
4) Laboratory tests
Complete blood count with a differential white cell counts, quantitative C-reactive protein and chemistry involving liver and kidney function tests and lipid profile were performed. Prealbumin, as a specific nutritional biomarker, was assayed using immunoturbidimetric assay on chemistry autoanalyzer [8].
3. Nutritional management
Patients were divided into 2 groups using sealed envelopes for randomized allocation: Group A, high fat feeding group, included 25 patients who received isocaloric high fat low carbohydrates feeding (30% carbohydrates, 50% fats). Fat content was reconstituted to represent 50% of the nonprotein calories (proteins were not included in energy calculations to be spared for tissue healing, immunity and growth). Group B, standard feeding group, included 26 patients who received standard isocaloric feeding protocol (55% carbohydrates, 25% fats).
Predicted resting energy expenditures (PREE) were calculated using the World Health Organization’s Equations [9]. Target caloric requirements were calculated by multiplication of a stress factor (1.5–2) by the PREE. Protein requirements were determined based on ASPEN 2009 recommendations [10]. Feeds were gradually advanced over 6 days.
Infants younger than 4 months of age were fed a ready-made formula with fat representing 50% of nonprotein calories (Infatrini, Nutricia). For those older than 4 months of age, high-fat enteral feeds are formulated by adding olive oil to blended food (Supplementary material), after revising the national mimeographic data of Food Composition Tables for Egypt, Ministry of Health and Population, General Organization for Teaching Hospitals and Institutes, National Nutrition Institute, 2nd edition, May 2006.
4. Monitoring
All clinical parameters related to the respiratory system (ventilator settings, lung indices and arterial blood gases) at day 7 of recruitment. All basic laboratory tests and prealbumin were repeated at day 7 of recruitment. Daily record of feeding advancement and interruption was done with documentation of the reasons for interruptions. Percentage of target calories and proteins achieved at day 7 of recruitment was recorded.
5. Outcome parameters
The effect of dietary modification as a primary outcome on: extubation rate, carbon dioxide tension (pCO2) and pH, assisted minute ventilation, biochemical markers, and mortality.
6. The effect of nutritional status on the previous parameters was tested as a secondary outcome: data management
Clinical and laboratory data were analyzed using SPSS ver. 16 (SPSS Inc., Chicago, IL, USA). In variables that were normally distributed, mean and standard deviation were performed and chi-square test was used for analysis of nonparametric data. Median and interquartile range were obtained for variables that were not normally distributed. Statistical significance is considered when P value is less than or equals to 0.05. Difference between outcome groups was assessed using the 1-way analysis of variance (ANOVA) with Fisher Least Significant Difference used as post hoc test. Multistep regression analyses were performed to determine the predicting variables for outcome parameters. Multistep regression analysis and multivariate ANOVA (MANOVA) were used to determine multiple dependent factors affecting day-7, -14, and final outcomes.
7. Ethical committee approval
The study was approved by the ethical committee of the Pediatrics department, Faculty of Medicine, Cairo University (approval number: I-050314).
Results
The study included 51 critically ill children fulfilling the inclusion criteria, divided according to the type of diet into 2 groups as previously detailed. Thirty-five patients (68.6%) were enrolled within 24–48 hours of admission (early enrollment group) and the rest of patients were enrolled after more than 48 hours (late enrollment group) with no significant difference between groups. Demographic characteristics of the included patients are shown in Table 1.
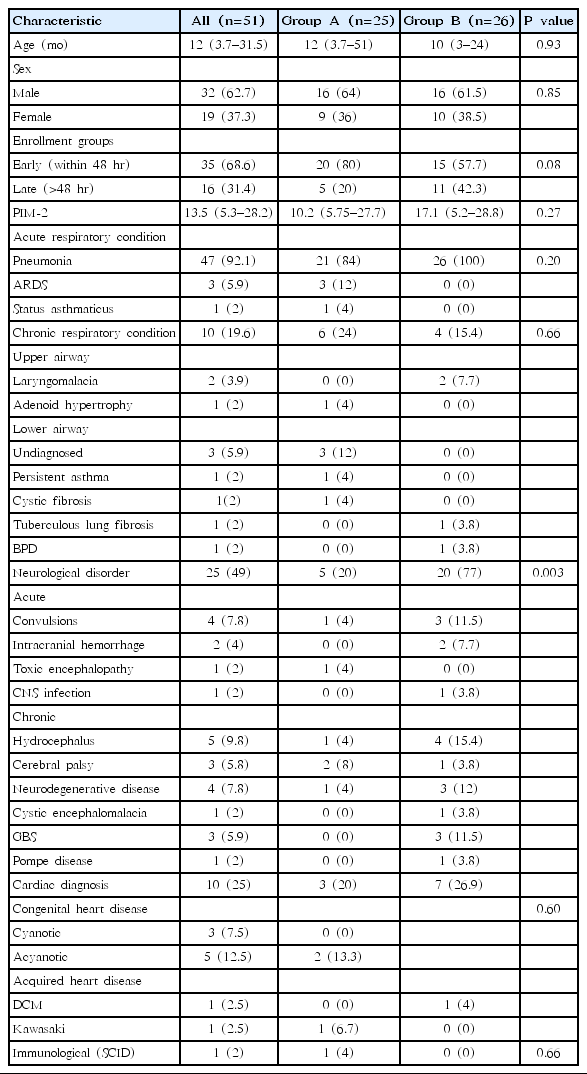
Demographic characteristics of the study groups
Both study groups were homogenous as regards age, gender and PIM-2 scoring. All patients had at least one acute respiratory problem; pneumonia was the most frequent presenting diagnosis (n=47, 92.2%), some patients had additional chronic upper or lower respiratory problems. Forty patients (78.4%) had associated nonrespiratory diagnostic categories including several neurological, cardiac, musculoskeletal and immunological diseases. Neurological diseases were the most frequent associated conditions (n=25, 49%) with statistically significant higher frequencies among group B (P=0.003*) (Table 1).
Malnutrition was highly prevalent among both groups (defined as World Health Organization z scores ≤ -2 standard deviation [SD]) in terms of the following parameters: weight-for-age (n=35, 68.6%), weight-for-length (n=32, 62.7%) and BMI-for-age (n=31, 60.8%) with no significant differences. Severe malnutrition (defined as z scores ≤ -3 SD) was more frequent among group B with statistically significant differences in terms of weight-for-age, weight-for-length, and BMI-for-age. No similar difference between both groups was noted in terms of MUAC-for-age (Table 2).
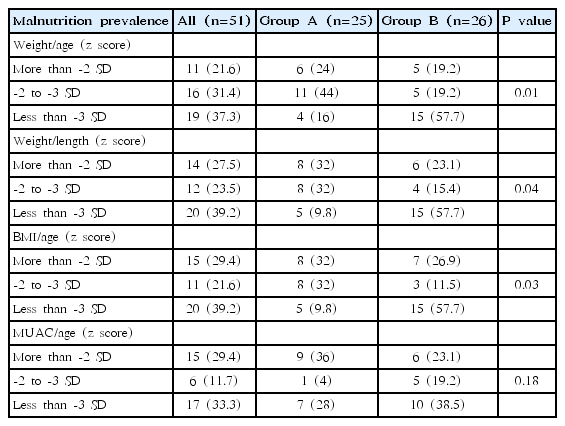
The prevalence of malnutrition among the study groups
Feeding was initiated within 24–48 hours of admission. Several avoidable and nonavoidable causes of feeding interruption were recorded, such as severe respiratory distress, gastrointestinal bleeding, paralytic ileus, poor adherence of PICU staff to feeding regimens were recorded. Higher frequency of interruptions due to gastrointestinal intolerances was recorded among the high-fat feeding group with no statistically significant impact on the percent of energy and proteins achieved at day 7 (Table 2).
1. MV outcomes
Patients were ventilated for a median of 7 days and a range of 3– 11 days for group A and a median of 5 days and a range of 4–7 days for group B with no significant difference in the duration of MV according to the type of diet. Synchronized intermittent mandatory ventilation (SIMV) was the most commonly used initial ventilation mode with no difference between the groups A and B. Both groups showed a significant change in ventilation modes before and after the intervention, Table 3.
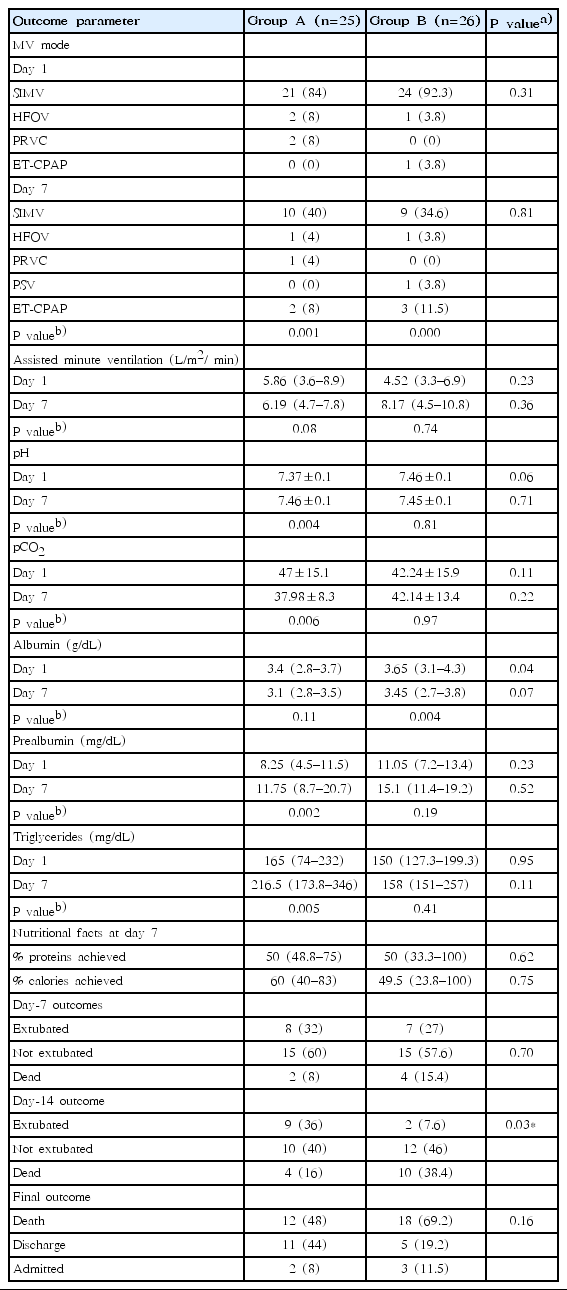
Outcome parameters of the study groups
Fifteen patients (29.4%) were extubated at day 7 with no statistically significant difference between both groups. Significantly lower extubation rates at day 14 were detected among group B with no significant correlation to the type of diet (β=0.378, P=0.22). The day-14 outcome showed a significant correlation to weight for age (β= -0.633, P=0.01), therefore, the lower extubation rates for group B at day 14 may be attributed to the higher prevalence of severe malnutrition among this group as previously discussed. Several anthropometric and laboratory parameters showed significant differences in multiple group comparison for day-14 outcome (Table 4).

Multiple group comparisons for day-14 outcome
A higher level of ventilatory support was needed for group B at day 7 as evident by a 2-fold increase in assisted minute ventilation, however, the difference was not statistically significant (Table 3). Assisted minute ventilation was significantly predicted by weight for age (β=-0.485, P=0.04) and caloric intake (β=0.66, P=0.001), rather than the type of diet (Fig. 1).
Weight-for-age and caloric intake as predictors of assisted minute ventilation at day 7.
2. Laboratory outcomes
There were no significant differences between the groups A and B in the initial blood gases, blood counts, routine chemistry, prealbumin, and lipid profiles. Stepwise regression analysis revealed a statistically significant difference in the laboratory outcome parameters based on the type of diet given to the patients (F=3.72, P= 0.006, Wilk’s β=0.446, partial η2=0.55). High-fat feeding group showed a significant pH rise (F=8.21, P=0.007, partial η2=0.21) and pCO2 reduction after the intervention compared to nonsignificant changes among group B. Significant improvement of prealbumin and elevation of triglyceride levels (F=5.08, P=0.03, partial η2=0.14) were detected among group A at day 7 of enrollment (Table 3). No similar difference was noted according to the presence of neurological diseases (F=1.02, P=0.44, Wilk’s β=0.746, partial η2=0.25).
3. Mortality
Thirty patients (58.8%) were dead by the end of the study period with 5 patients were still admitted to the intensive care unit due to ventilator dependency. No significant differences were found in day-7 mortality and overall mortality rates between the groups A and B. The mortality group showed significantly lower anthropometric z score values and biochemical markers with higher mortality scoring (Tables 4, 5). Significantly higher group B mortality rates at day 14 were detected (P=0.03) (Table 3), could be attributed to higher prevalence of severe malnutrition among this group.
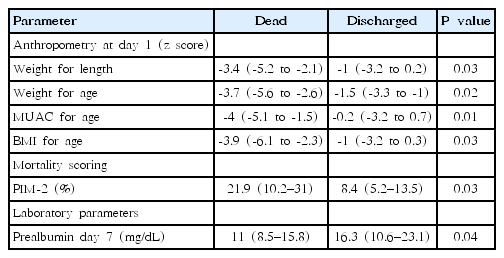
Multiple group comparisons for the final outcome
Final outcome was significantly predicted by weight for age (β= -5.725, P=0.001), BMI for age (β=3.95, P=0.004), and MUAC for age (β=0.77, P=0.005), with no effect of the dietary modification (β= 0.002, P=0.98) or the presence of neurological diagnosis (β=0.136, P=0.35). The overall model fit was R2=0.543, P=0.003. With stepwise regression analysis, all variables were excluded and MUAC for age was the strongest predicting variable (β=0.467, P=0.001) (Fig. 2).

Stepwise regression analysis showing mid-upper arm circumference (MUAC)-for-age as the strongest predictor of the final outcome. SD, standard deviation.
Discussion
The high-fat diet was reported to reduce CO2 and improve pH values and this was a significant result shared between the current study and some previous adult studies on ventilated patients with respiratory diseases [5,6]. However, spot measurement of pH and CO2 cannot be used as a sole indicator of diet efficacy. This CO2 reduction was associated with a similar significant reduction in the level of ventilatory support needed for those patients [5,6], unlike the current study; it did not induce a similar effect on assisted minute ventilation used as an indicator for the level of ventilatory support.
Many studies found that the caloric intake rather than the amount of fat or carbohydrate ingested was the predictor of hypercapnia [11], in the current study, caloric intake was a significant predictor for assisted minute ventilation rather than the type of diet. The total duration of ventilation was reduced by high fat dietary modification in some reports [5,6], while in the current study and other literature reports, it did not seem to induce a similar effect [12].
To our knowledge, pediatric studies about the effect of the high-fat dietary modification on mechanically ventilated patients were lacking till the time of manuscript writing. This makes referring to the previously mentioned adult studies is not very ideal due to different physiology and age-specific pulmonary diseases.
Ventilation outcomes in the current study were rather affected by nutritional status. This could be justified by better anthropometric z score values for extubated patients and weight for age as a predictor for the level of ventilatory support. Similar results were previously reported by Grippa et al. [13] where the duration of MV was significantly predicted by weight for age and upper arm muscle area for age. Many studies reported that underweight children according to BMI z scores required prolonged ventilatory support [14,15]. Albumin and prealbumin levels were significantly higher among extubated patients, however, they were not predictors for the outcomes of MV, similar to what is reported by Grippa et al. [13]
Improvement of prealbumin levels in the high-fat group cannot be justified with the available data because of achieving similar caloric and protein intake at the time of follow up by both groups. It would have been better explained if bio-electrical impedance was available for body composition analysis. Lean tissue index would have particular importance due to its positive correlation to prealbumin level [16]. Also, further research is required to assess the effect of high-fat diet on protein metabolism in critically ill children.
Mortality was predicted by the nutritional status as reported by Nourmohammadi et al. [17] rather than the effect of high-fat diet. Several anthropometric parameters were significantly different between survivors and non-survivors similar to the report of Bechard et al. [14] Prealbumin concentrations were found to be significantly higher in patients who survived to discharge, however, showed no consistent association to final PICU outcomes [18].
We faced some limitations in the current study which were similar to Grippa et al. [13] report in many aspects. Both are single-center studies and cannot be extended to other PICUs with different characteristics. During the study period, there were many patients with associated nonrespiratory conditions. This might have interfered with prompt evaluation of diet efficacy on the respiratory system alone. Many patients with high-risk diagnoses according to PIM-2 scoring were enrolled, added to the high prevalence of malnutrition among the study groups which was nearly 3 times higher compared to the report of Grippa et al. [13] This may have contributed to the observed high mortality during the study period than the average mortality of PICUs. Self-funding limited the nutritional markers measured and lead to lack of continuous CO2 tracking. Taking the anthropometric measurements was challenging especially in edematous patients. Additionally, in some neurological cases the height was calculated by predictive equations7) which may not be very accurate.
To conclude, high-fat enteral feeding protocol may contribute to the reduction of PCO2 with no major impact on ventilatory and final PICU outcomes. Optimization of nutritional status has a major role in improving ventilatory and survival outcomes in critically ill ventilated children. Further advanced multicentric clinical trials are required in pediatric critically ill ventilated patients with respiratory diseases to determine the optimal macronutrient composition of their enteral feeds.
Notes
No potential conflict of interest relevant to this article was reported.
Acknowledgements
I would like to thank all the PICU team, the laboratory team and all my patients’ caregivers for their cooperation during the study period. Special thanks go to Dr. Radwa Marawan Abdel Halim, lecturer of Chemical Pathology, Cairo University for her sincere cooperation in facilitating all the laboratory procedures.
Supplementary material
Supplementary data can be found via https://doi.org/10.3345/kjp.2018.06835.