The changes of prevalence and etiology of pediatric pneumonia from National Emergency Department Information System in Korea, between 2007 and 2014
Article information

Abstract
Purpose
Understanding changes in pathogen and pneumonia prevalence among pediatric pneumonia patients is important for the prevention of infectious diseases.
Methods
We retrospectively analyzed data of children younger than 18 years diagnosed with pneumonia at 117 Emergency Departments in Korea between 2007 and 2014.
Results
Over the study period, 329,380 pediatric cases of pneumonia were identified. The most frequent age group was 1–3 years old (48.6%) and the next was less than 12 months of age (17.4%). Based on International Classification of Diseases, 10th revision diagnostic codes, confirmed cases of viral pneumonia comprised 8.4% of all cases, pneumonia due to Mycoplasma pneumoniae comprised 3.8% and confirmed cases of bacterial pneumonia 1.3%. The prevalence of confirmed bacterial pneumonia decreased from 3.07% in 2007 and 4.01% in 2008 to 0.65% in 2014. The yearly rate of pneumococcal pneumonia also decreased from 0.47% in 2007 to 0.08% in 2014. A periodic prevalence of M. pneumoniae pneumonia (MP) was identified.
Conclusion
The increased number of patients with pneumonia, bacterial pneumonia, pleural effusion, and empyema in 2011 and 2013–2014 resulted from an MP epidemic. We provide evidence that the frequency of confirmed cases of bacterial pneumonia and pneumococcal pneumonia has declined from 2007 to 2014, which can simultaneously reflect the effectiveness of the pneumococcal conjugate vaccine.
Introduction
Pneumonia is the leading cause of hospitalization in developed countries and is associated with a high mortality rate worldwide [1]. The prevalence and mortality rate of pneumonia is particularly high in underdeveloped countries having poor healthcare resources and poor quality of sanitation. Understanding the incidence rate of pediatric pneumonia and identifying the pathogen for community-acquired pneumonia (CAP) forms the basis for diagnosis, therapeutic treatment, and intervention. In a study of 154 children hospitalized for CAP in the United States, between January 1999 and March 2000, a period prior to the universal use of pneumococcal conjugate vaccine (PCV), Michelow et al. [2], identified a bacterial pathogen in 60% of cases of pneumonia. The Streptococcus pneumoniae bacteria strain was identified in 73% of bacterial pathogen. S. pneumoniae was a common pathogen of CAP at that time [2]. The causal pathogen of CAP was very different in a survey of children under the age of 18 years who were hospitalized for pneumonia in designated hospitals in southern and Western part of US, between January 2010 and June 2012, a period after the universal use of PCV [1]. In this latter survey, a viral or bacterial cause was identified in 81% of cases, with more than one kind of virus detected in 66% of cases [1]. An exclusive bacterial cause was identified in only 8% of cases, with both bacterial and viral causes identified in 7% of cases. Therefore, by 2012, viruses had emerged as more significant pathogens of pneumonia than bacteria.
A multicenter retrospective study undertaken in Korea between 1996 and 2005 identified invasive bacterial infection as the most prevalent cause of pneumonia in children, with S. pneumoniae being the most common pathogen for bacterial pneumonia, meningitis and bacteremia among children 3 months to 5 years of age [3]. S. pneumoniae was also reported as a major pathogen for pediatric empyema in a multicenter survey conducted in Korea between 1999 and 2004 [4]. A single center in Korea identified the cause of lobar/lobular pneumonia among children 2 to 15 years of age, between June 2006 and May 2008. Mycoplasma pneumoniae (50.7%) was the most common organism in all age groups and bacteria was 5.9%. S. pneumoniae (88.9%) was the major cause of bacterial pneumonia including mixed infection [5].
S. pneumoniae and Haemophilus influenzae were major bacterial pathogens of pneumonia. S. pneumoniae had caused 11% of deaths in children aged under 5 years globally in the pre-PCV era [6]. As medical costs associated with pneumonia are substantial, there have been continuous worldwide efforts to reduce the rate of pneumoniaassociated morbidity and mortality, including the use of vaccines. Changes in complications, morbidity, and the rate of pneumonia of PCV use were analyzed in the United States but not in Korea. The aim of the study was to describe the epidemiology of CAP in Korea, including yearly trends in incidence, frequency of viral and bacterial pathogens and the impact of PCV.
Materials and methods
This is a retrospective and observational study in which data from children and adolescents under 18 years of age, visited to one of the 117 Emergency Departments (EDs) in Korea between 1 January 2007 and 31 December 2014 were analyzed. The data were obtained from the National Emergency Department Information System (NEDIS) for children and adolescents under 18 years of age. The patients with diagnosis codes for CAP, based on International Classification of Disease, 10th revision diagnostic codes (Table 1) which was provided at the time of discharge from ED or after hospitalization were selected to identify eligible cases.

International Classification of Diseases, 10th revision (ICD-10) diagnostic codes used in the study
Categorical data was performed chi-square test, depending on age. Annual and seasonal distribution of ED visits were described by the number and % of total. The tau values were calculated using the Mann-Kendall method to analyze increasing or decreasing trends. Monthly incidence rate of diseases from data in 2008–2014 were decomposed and plotted into three components of trend, seasonality and remainder using LOESS procedure. Analyzes were performed using SAS ver. 9.4 (SAS Institute Inc., Cary, NC, USA), with a P value≤0.05 deemed significant.
Institutional Review Boards waived deliberation of this study.
Results
1. CAP under 18 years of age during 2007–2014
Over the 8-year study period, 329,380 children and adolescents were diagnosed with pneumonia, with a male-to-female ratio of 1:0.8. The age and yearly distribution of pneumonia cases, as well as the rate of hospitalization, are summarized in Table 2. Children 1 to 3 years old comprised the majority of cases (160,093 patients; 48.6% of cases), followed by children under the age of 1 year (57,295 patients; 17.4% of cases). Adolescents, 13 to 18 years old, comprised the smallest proportion (21,012 patients, 6.4% of cases). The yearly prevalence of pediatric pneumonia increased from 30,521 cases in 2007 to 68,451 cases in 2014. Among the 329,380 cases, 45.6% (150,110 patients) were hospitalized and 1.1% (3,770 patients) admitted to the intensive care unit (ICU). The rate of hospitalization was highest among patients under the age of 1 year (63.7%), with the rate decreasing with age to a rate of 30.0% among patients 13 to 18 years old. The ICU admission rate was highest under 1 year old group (3.0%), followed by 13 to 18 years old group (2.56%; Table 2).
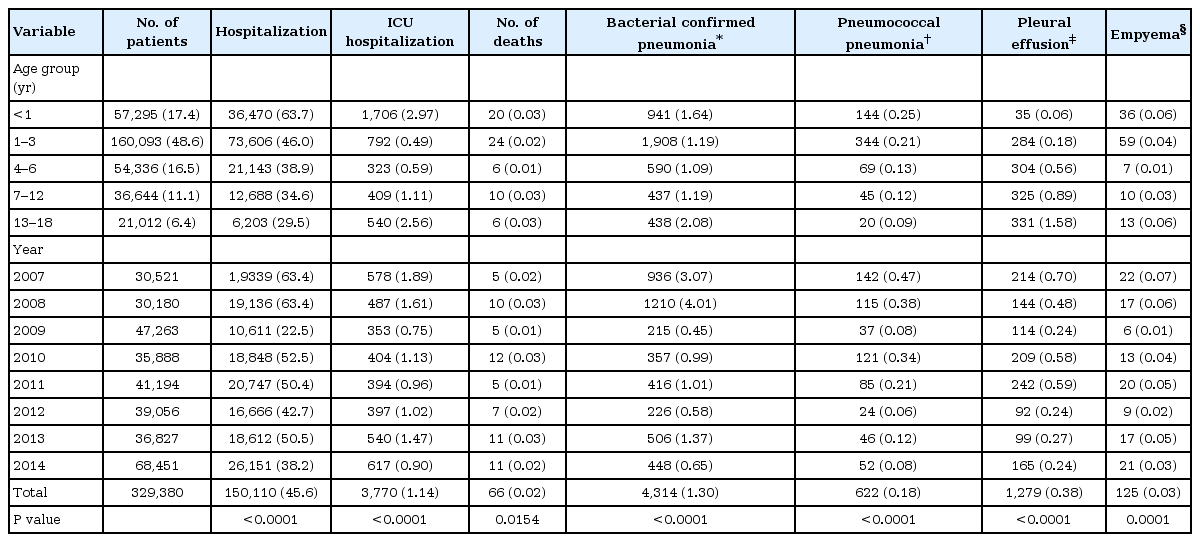
The clinical features of patients with pneumonia who visited Emergency Departments by age group and year in 2007–2014
Although the incidence rate of ED visit increased from 2007 through 2014, the rate of hospitalization declined, from 63.4% in 2007 to 38.2% in 2014. Peculiarly, the hospitalization rate was markedly lower in 2009, at 22.5%. The yearly ICU admission rate declined over the study period, from 1.9% in 2007 to 0.9% in 2014 (Table 2).
Overall, 66 deaths were reported, with a comparable rate of mortality of 0.01% to 0.03% for children under the age of 18 years (Table 2). Among children who died, 16 deaths (24.2% of death) were caused by aspiration pneumonia, with 11 patients (16.7% of cases) having a neurological disorder or congenital disease.
Over the 8-year period of the study, there were 2 peak patients number in February and November. In 2014, the rate of pneumonia was highest in February. In 2009, the number of patients was peak in November, followed by October (Fig. 1).
Monthly distribution of community-acquired pneumonia in children and adolescents younger than 18 years, January 2007 to December 2014, Korea.
The prevalence of bacterial and viral pneumonia is summarized in Table 3. The etiology of pneumonia was not specified in 67.3% of cases (221,723 patients, diagnosis code J18–J18.9). Among the remaining cases with a clear etiology, viral pneumonia were diagnosed 27,607 patients; 8.4% of total pneumonia patients. The yearly prevalence of viral pneumonia varied between a low of 4.5% in 2007 to a high of 31.3% in 2009 during an influenza pandemic. When we broadly consider viral pathogens, including influenza, parainfluenza, and respiratory syncytial virus, as well as adenovirus and human metapneumovirus, the influenza virus was the most prevalent (11,553 patients, 41.8% of viral pneumonia), followed by the respiratory syncytial virus (4,771 patients, 17.3% of viral pneumonia).
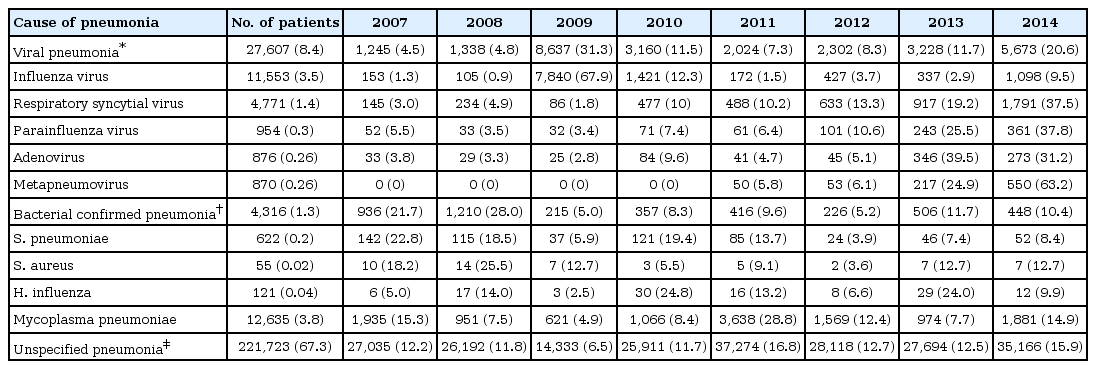
Community-acquired pneumonia: identified pathogens in children and adolescents under 19 years of age in 2007–2014
Bacterial confirmed pneumonia was identified in 1.3% cases (4,316 patients, diagnosis codes J13, J14, J15–J15.9 excluding J15.7, J17.0). The yearly incidence of bacterial pneumonia decreased from 3.07% in 2007 and 0.65% in 2014 (Table 2). Among patients with bacterial pneumonia, 622 patients were diagnosed with pneumococcal pneumonia, with the yearly rate decreasing from 0.47% in 2007 to 0.08% in 2014 (Table 2).
M. pneumoniae pneumonia (MP) was diagnosed in 3.8% of cases (12,635 patients; Table 3). The 8-year monthly prevalence of MP is shown in Fig. 2. There was an increase in the number of patients in 2007. The prevalence of MP rose again in 2010 and 2011, due to a large epidemic, burgeoning again in early 2014 (Table 3, Fig. 2). Pleural effusion was identified in 0.4% of total cases (1,279 patients), accounting for 1.6% (68 patients) of cases of bacterial pneumonia and 2.0% (251 patients) of cases of MP. The yearly rate of patients presenting with pneumonia and pleural effusion is summarized in Table 2 and varied between 0.2%, in 2009 and 2012, and 0.7% in 2007. Empyema was identified in 125 patients (0.03% of cases), with the yearly rate varying between 0.01% in 2009 and 0.07% in 2007 (Table 2).
Monthly distribution of Mycoplasma pneumoniae pneumonia in children and adolescents younger than 18 years, January 2007 to December 2014, Korea.
The annual proportion of patients with pneumococcal pneumonia and age of patients are reported in Table 2, with significant yearly and age-specific differences identified. The expected number of patients with bacterial pneumonia, pneumococcal pneumonia, pleural effusion, and empyema per 100,000 population between the ages of birth and 18 years is shown in Fig. 3. The upsurge of bacterial pneumonia in 2011 is presumed to have been associated with the increased prevalence of pneumonia-related complications, including pleural effusion and empyema, in 2011. The expected number of patients with pneumococcal pneumonia also rose in 2011, although, overall, there was a decreasing trend in the prevalence of bacterial pneumonia, pneumococcal pneumonia, pleural effusion, and empyema compared to that in 2007.
The monthly incidence of bacterial pneumonia, pneumococcal pneumonia, pleural effusion and empyema in children and adolescents younger than 18 years per 100,000 population in 2008–2014 (Korean Statistical Information Service did not provide monthly population in 2007).
2. Time series analysis
There was no decreasing or increasing trend in the number of patients with bacterial pneumonia, pneumococcal pneumonia, pleural effusion, and empyema per 100,000 population per year during the period from 2007 to 2014 (Table 4). In the annual deaths, stratified by age, the number of deaths per 10 million people in the 13 to 18-year-old group was significantly increased (tau=0.725, P=0.0239) (Table 4). In annual ICU hospitalized patients, an increasing trend was observed in the age group 7-12 years (tau=0.643, P=0.0354) (Table 4). Since Korean Statistical Information Service did not provide the monthly population in 2007, the monthly trend test was conducted for the period from 2008 to 2014. Bacterial pneumonia and empyema showed monotonic trend taking 12-month seasonality into account. The bacterial pneumonia and empyema peaks were in December and May, respectively (Figs. 3, 4; Table 5).
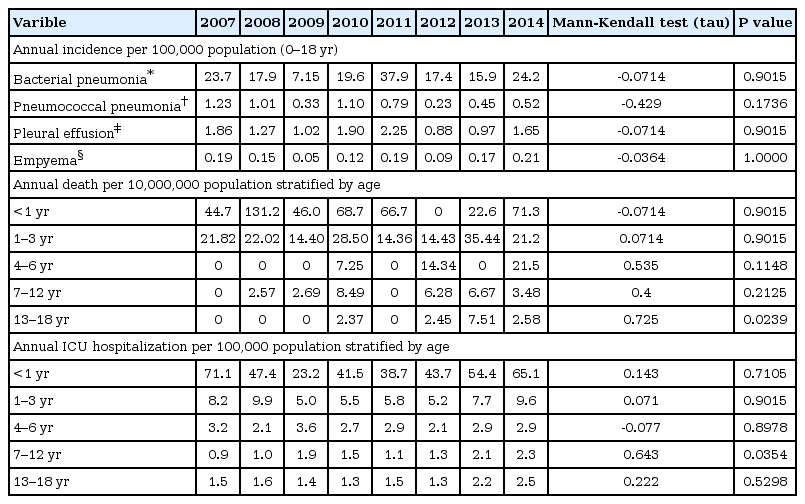
Time series trend test of incidence, death and intensive care unit (ICU) hospitalization stratified by age in 2007–2014

Seasonal trend decomposition plot of monthly incidence for bacterial pneumonia and empyema in 2008–2014 (Korean Statistical Information Service did not provide monthly population in 2007).
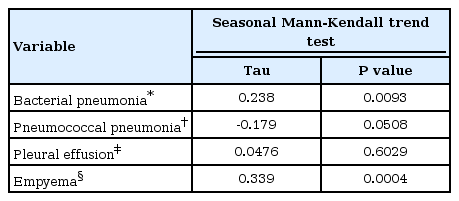
Results of the Mann-Kendall trend test with pneumonia based on the seasonal pattern for 12 months (2008–2014)
In time series trend test of annual incidence of bacterial pneumonia, pneumococcal pneumonia, pleural effusion and empyema per 100,000 population, there were not significant increasing or decreasing trend (Table 6).
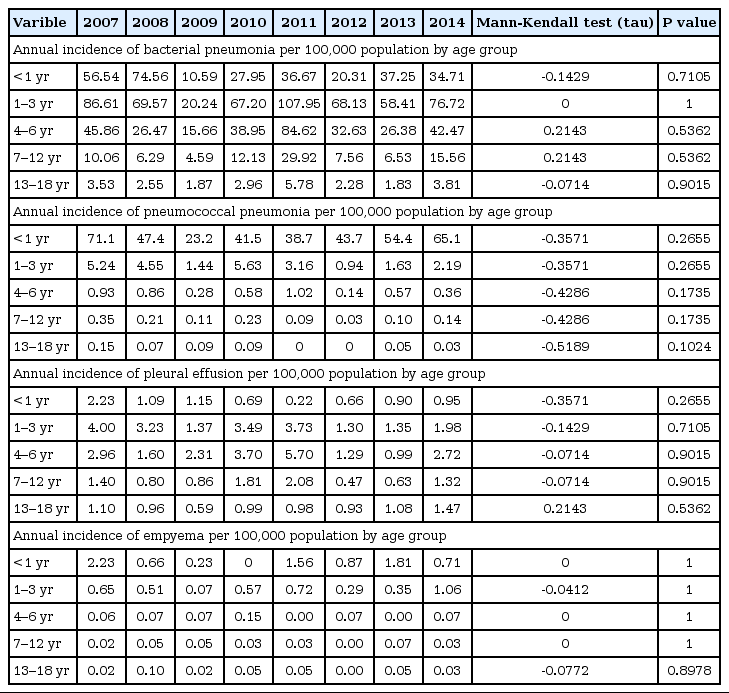
Time series trend test of annual incidence of bacterial pneumonia, pneumococcal pneumonia, pleural effusion, and empyema per 100,000 population
Discussion
Over the 8-year period of our study, from 2007 to 2014, the prevalence of ED visits for pediatric pneumonia increased, spiking in 2009 and 2014. According to the census published by Statistics Korea, the increase in children and adolescents with pneumonia between 2007 and 2014 occurred amid an overall decrease in the number of children under the age of 18 years in the general population, from 24,338 cases per total population of 100,000 in 2005 to 15,367 cases per total population of 100,000 in 2010 [7]. The prevalence ED visits for pediatric pneumonia spiked during in 2009 due to an influenza epidemic and in 2011 and 2014 due to a cyclical MP epidemic that recurs every 3 to 4 years in Korea [8-10].
The pathogens for CAP varied widely based on age, region, and season. Bacteria and viruses were the most typical pathogens, with M. pneumoniae being a common pathogen among preschool-aged children. The difficulty in identifying the causative pathogen due to difficulty in collecting specimen, such a sputum or mouth culture, for microbiological diagnosis, likely explains why an etiology was not specified in two-thirds of our cases. Among those with a clear etiology, viral pathogens were the most common, followed by M. pneumoniae and bacteria. In our case series from 2007 through 2014, the highest prevalence of viral pneumonia occurred in 2009 due to an outbreak of H1N1 influenza, although the prevalence of viral pneumonia did increase from 2007 through 2014 (Table 3). We speculate that the introduction of multiplex real time-polymerase chain reaction (RT-PCR) improved the diagnosis of viral pathogens of pneumonia in Korea over the 8-year period of our study [11,12]. In fact, our data clearly indicate this, with an increase in the diagnosis of human metapneumovirus pneumonia using multiplex RT-PCR since 2011. Multiplex RT-PCR is a test for the addition of human metapneumovirus, coronavirus, and rhinovirus to conventional respiratory virus detection (respiratory syncytial virus, adenovirus, influenza virus, parainfluenza virus). In Korea, a study on respiratory virus using multiplex RT-PCR has been started in 2006 [13,14] and was gradually expanded [11,14]. Human metapneumovirus was a newly discovered virus, and it would take time for the ICD code to be created and used in Korea.
Seven-valent PCV (PCV7) was developed in 2000 and universally used to effectively prevent S. pneumonia, a major pathogen for severe invasive bacterial diseases in addition to pneumonia, in children under the age of 2 years [15,16]. The efficacy of the PCV7 for preventing invasive infections and acquiring herd immunity has been confirmed in several studies, including through monitoring by the US Centers for Disease Control [15,17]. The PCV has been associated with a >25% decrease in streptococcal pneumonia, as well as lowering the risk of invasive pneumococcal disease and of pneumonia caused by antibiotics-resistant pneumococcal strain [15]. In Korea, the increasing trend in deep infection caused by one of the subtypes of S. pneumoniae in children under the age of 5 years from 1991 to 2003 was reversed in 2004 to 2006, presumably due to PCV immunization programs implemented in November 2003 [18]. Our data indicates the presence of a herd immunity among unvaccinated individuals, with a decrease in the prevalence of bacterial and pneumococcal pneumonia among children 7 to 18 years of age, although the PCV7 optional immunization program was only introduced in Korea in November 2003 [19].
MP usually affects preschool- and school-aged children, with a cyclical epidemic occurring every 3 to 4 years in Korea [8,10]. According to an epidemiological survey conducted by the Korea National Research Institute of Health, the incidence of mycoplasma infection increased in 2007, with a subsequent upsurge between 2010 and 2011 [9]. MP is associated with diverse radiological findings, including concomitant pleural effusion and lobar pneumonia, which makes its differential diagnosis from bacterial pneumonia difficult merely based on clinical presentations and chest radiographs [20,21]. Further, it is not uncommon for M. pneumoniae infection to coexist with infections from other pathogens [22]. Therefore, the prevalence and effects of a M. pneumoniae infection should be considered whenever the prevalence of bacterial pneumonia is evaluated. Over our 8-year study period, although not significant, though, the prevalence of bacterial pneumonia decreased between 2007 and 2014, with the exception of a unique spike in 2011. The increase in the total number of patients with pneumonia, the number of patients with bacterial pneumonia, the number of patients with pleural effusion and empyema in 2011 and the prevalence of bacterial pneumonia among children in the 4–6 and 7–12 years age groups in 2011 are speculated to have resulted from an nationwide MP epidemic extending from late 2010 to early 2012 (Fig. 2). The increased prevalence three years later (2013–2014) also likely resulted from a MP epidemic.
When prevalence was analyzed according to age groups, pneumonia in the age group of 1 to 3 years accounted for the largest proportion of all cases of pediatric pneumonia. However, among all age groups, the prevalence of bacterial and pneumococcal pneumonia was lower in 2014 than in 2007. Notably, the decreasing trend in the prevalence of pneumococcal pneumonia, and concomitant pleural effusion or empyema (Table 2), suggests that, similar to other countries, the introduction of PCV in Korea had a specific effectiveness against pneumococcal pneumonia and its complications.
According to research data published outside of Korea, since its introduction in 2010, the PCV13 seems to be more effective than the PCV7 [23]. In a French study evaluating the effectiveness of the PCV13 in pediatric patients, 1 month to 15 years of age who were radiologically diagnosed with pneumonia at the ED between 2009 and 2012, the prevalence of CAP decreased by 16% after the introduction of PCV13, with a 63% decrease in pneumococcal pneumonia and a 53% decrease in pleural effusion. The decreased prevalence of CAP was more evident in children under the age of 2 years [23].
The PCV7 was introduced in Korea in November 2003, with the PCV10 and PCV13 introduced in June 2010 as an optional. In May 2014, PCV10 and PCV13 were incorporated in the national immunization program in Korea [21]. With regard to the immunization rate achieved, about 40% of the candidates for vaccination are estimated to have received the PCV7 as of 2007 [15]. The 2011 national immunization rate survey of 3-year-old children (born in 2007) reported a PCV vaccination rate of 67.1% for the first dose, 60.5% for the second dose, 56.7% for the third dose, and 51.4% for the fourth dose, with a complete vaccination rate of 49.7% [24]. The 2013 national immunization rate survey of three-year-old children (born in 2009) showed an increased rate of PCV vaccination, with a vaccination rate of 83.4% for the first dose, 80.5% for the second dose, 77.8% for the third dose, and 70.4% for the fourth dose [25]. Although we could not evaluate immunization rate among the patients included in our analysis, we were able to confirm a vaccination rate of 50% among 3 years old in our 2007 cohort, which increased to about 70% for this age group in 2013. A limitation of our data set, which spans 2007–2014, is the difficulty in determining if the decline in pleural effusion and empyema could be explained by an increase rate of vaccination with the PCV7 or the introduction of the PCV10 and the PCV13 in 2010. The cyclical MP epidemic in Korea also influences the prevalence of pneumonia, making difficult to clearly distinguish the effects of PCV7 from those of the PCV10 or the PCV13.
Currently, we only identified a lowering in the prevalence of pneumonia types caused by serotypes included in the PCV7, with S. pneumoniae strains that cause invasive infection becoming less frequent, as well as being less frequently identified in oropharyngeal swabs obtained from healthy children [15,19]. Overall, however, there is a paucity of data regarding changes in the incidence of pneumococcal infections in children in Korea after the introduction of the PCV10 and the PCV13, as well on the overall effects of these vaccines [26]. A detailed evaluation of the effects of pneumonia vaccines in Korea is challenging as it requires accurate specimen collection and identification of bacteria, as well as laboratories and researchers to support the entire research process. Nevertheless, our analysis of a relatively large cohort of children with pneumonia over an 8-year period does provide evidence of a declining prevalence of bacterial pneumonia, pleural effusion and empyema with the exception of a unique spike in prevalence in 2011. Our findings provide preliminary evidence of the probable contribution of the PCV vaccination program in lowering the risk for pneumonia in children and adolescents.
However, there is a significant increase in deaths per 10 million populations between the ages of 13 and 18, and the increasing trend of hospitalization for ICU between the ages of 7 and 12 is very worrisome. Active vaccination is needed and studies and countermeasures against the increase of antibiotic resistant bacteria are needed.
The rate of ICU admission in this study varied greatly with age groups, with those <1 and 13–18 years of age showing particularly high ICU admission rates. Infants <1 year of age also had high rates of ED hospitalization, presumably due to factors related to their age. Newborn and infants <1 year of age accounted for the highest proportion of pediatric patients diagnosed with aspiration pneumonia, because of their physiological tendency for gastro esophageal reflux [27].
The yearly ICU admission rate declined over the study period, from 2007 to 2014. Domestic humidifier disinfectants were used until 2011, therefore severe interstitial lung disease was nationally prevalent. Since 2011, the use of humidifier disinfectants has been banned, severe interstitial lung disease has been reduced. It would have contributed in part to the reduction in the hospitalization rate of pneumonia and the rate of admission to the ICU [28].
In this study, bacterial pneumonia and empyema found significant seasonality in December and May, respectively. This is similar to the results of previous studies in other areas of PCV introduction and the cause of seasonality in pneumococcal disease [29,30]. These results suggest that prevention of severe pneumonia complications, vaccination and health measures are needed more.
The findings of this study are limited by the use of NEDIS data, which is based on the diagnoses written in the medical records from the ED. It did not include those who were treated in outpatient clinics or those who were hospitalized through outpatient clinics; therefore, it did not reflect the total number of pneumonia patients. The reliability of diagnosis and treatment may be limited by the proficiency of primary care physicians. We do not know about the vaccination status of the subjects. The incidence of pneumococcal pneumonia was decreased, but no significant decreasing trend was found in frequency per 100,000 population.
Nevertheless, as the first nationwide analysis regarding the trend of pediatric pneumonia over the course of 8 years and within the context of naturally occurring epidemics of influenza and M. pneumoniae, we provide an evidence of a benefit of PCV vaccination in Korea in lowering the prevalence of pediatric bacterial pneumonia. We also confirmed an increase in bacterial pneumonia, pleural effusion, and empyema during the MP epidemic breakout in 2011, which calls for prudence during data analysis due to the substantial overlap in the clinical manifestation of bacterial pneumonia and M. pneumoniae infection.
Notes
No potential conflict of interest relevant to this article was reported.
Acknowledgements
We thank to the National Emergency Department Information System.