Clinical and laboratory profiles of hospitalized children with acute respiratory virus infection
Article information

Abstract
Purpose
Despite the availability of molecular methods, identification of the causative virus in children with acute respiratory infections (ARIs) has proven difficult as the same viruses are often detected in asymptomatic children.
Methods
Multiplex reverse transcription polymerase chain reaction assays were performed to detect 15 common respiratory viruses in children under 15 years of age who were hospitalized with ARI between January 2013 and December 2015. Viral epidemiology and clinical profiles of single virus infections were evaluated.
Results
Of 3,505 patients, viruses were identified in 2,424 (69.1%), with the assay revealing a single virus in 1,747 cases (49.8%). While major pathogens in single virus-positive cases differed according to age, human rhinovirus (hRV) was common in patients of all ages. Respiratory syncytial virus (RSV), influenza virus (IF), and human metapneumovirus (hMPV) were found to be seasonal pathogens, appearing from fall through winter and spring, whereas hRV and adenovirus (AdV) were detected in every season. Patients with ARIs caused by RSV and hRV were frequently afebrile and more commonly had wheezing compared with patients with other viral ARIs. Neutrophil-dominant inflammation was observed in ARIs caused by IF, AdV, and hRV, whereas lymphocyte-dominant inflammation was observed with RSV A, parainfluenza virus, and hMPV. Monocytosis was common with RSV and AdV, whereas eosinophilia was observed with hRV.
Conclusion
In combination with viral identification, recognition of virus-specific clinical and laboratory patterns will expand our understanding of the epidemiology of viral ARIs and help us to establish more efficient therapeutic and preventive strategies.
Introduction
Acute respiratory infections (ARIs) are a main cause of morbidity and mortality in children, with viruses being responsible for more than 80% of ARIs worldwide.12) Clinical manifestations of ARI can hardly differentiate bacterial from viral etiologies, which can lead to the unnecessary use of antibiotics. Recent development of the multiplex reverse transcription polymerase chain reaction (RT-PCR) assay makes noninvasive identification of respiratory pathogens possible. However, a more accurate diagnosis of causative ARI pathogens does not decrease hospital admissions or antibiotic use in children with ARI.3) Since viruses are often detected in asymptomatic children,4) identification of a virus by RT-PCR does not always imply that it is the culprit for a current ARI. Because these viruses are sometimes asymptomatic carriers and sometimes pathogens, a diagnosis should not be based solely on viral identification in respiratory samples. Moreover, new respiratory viruses have been increasingly recognized, but their clinical significance remains unclear.56) Thus, in addition to multiplex RT-PCR assays, a better understanding of these viruses is required to improve clinical management.
In this study, we assessed the viral epidemiology of ARI in hospitalized children under age of 15 years, and we characterized the virus-specific clinical and laboratory profiles as well as clinical outcomes. Together with RT-PCR results, this data will help us understand the clinical course of viral ARI and to establish more effective preventive and therapeutic strategies.
Materials and methods
1. Study population
This retrospective cohort study was approved by the Institutional Review Board of Korea University Guro Hospital (KUGH). Hospitalized patients under 15 years of age with a discharge diagnosis of ARI from January 2013 to December 2015 were enrolled. ARI was diagnosed based on one of symptoms or signs; fever of more than 37.8℃, cough, rhinorrhea, sore throat, tonsillar injection, wheezing, crackle, chest wall retraction.
Nasopharyngeal aspirates from all patients were obtained within 48 hours of admission for multiplex RT-PCR assay to detect the following 15 common respiratory viruses: influenza virus A and B (IFA, IFB), respiratory syncytial virus A and B (RSV A, RSV B), parainfluenza virus 1-4 (PIV 1, PIV 2, PIV 3, PIV 4), human coronavirus 229E and OC43 (hCV-229E, hCV-OC43), human rhinovirus (hRV), human enterovirus (hEV), adenovirus (AdV), human bocavirus (hBV), and human metapneumovirus (hMPV). Only a single sample was taken from the patients during the admission. RT-PCR results were used to evaluate the incidence of respiratory viruses. Laboratory parameters on the first day of admission, as well as overall clinical profiles including baseline characteristics, presenting symptoms and signs, treatments and clinical outcomes, were analyzed in patients with single-virus infections. Any possible bacterial coinfections were excluded by sputum and blood culture and clinical course. Mycoplasma coinfections were excluded by sputum PCR or by a serial increase of antibody titer or a high initial IgM titer without history of recent respiratory disease.
2. Molecular laboratory procedures
Respiratory samples from children were collected by nasopharyngeal aspiration. The presence of each virus was determined using the Seeplex RV15 RT-PCR assay (Seegene, Inc., Seoul, Korea). Two sets of primers were designed based on conserved regions of genetic sequences for the 15 respiratory viruses mentioned above. Amplified PCR products were analyzed by electrophoresis on 2% agarose gel and were compared with the reference band size provided by the manufacturer.7)
3. Statistical analysis
Statistical analysis was performed using IBM SPSS Statistics ver. 20.0 (IBM Co., Armonk, NY, USA). Data were expressed as mean±standard deviation or as percentages, as appropriate. A multiple-way analysis of variance was run to test differences between viral groups. Then, each viral group was compared with the other viral groups using chi-square tests for categorical data and unpaired Student t tests for continuous data. A P-value <0.05 was considered statistically significant.
Results
1. Distribution of respiratory viruses
From respiratory samples of a total of 3,505 patients, viruses were detected in 2,594 patients (74.0%). After excluding 170 patients with bacterial coinfections (mycoplasma in 154 cases, other bacteria in 14 cases, and mycoplasma with other bacteria in 2 cases), 2,424 patients (69.1%) were found to have viral ARIs. In those cases, the most common were hRV (727 of 2,424, 30.0%), AdV (493 of 2,424, 20.3%), and RSV A (411 of 2,424, 17.0%) (Fig. 1). Of those examined, 1,747 (49.8%) had a single virus detected on PCR, and 677 (19.3%) had more than one virus detected (Table 1). Of these 677 cases, 558 (82.4%) had 2 viruses detected, 92 (13.6%) had three viruses detected, and the remainder (4%) had 4 or more viruses detected. Of the 1,747 single-virus cases, the most commonly identified viruses were hRV (326 of 1,747, 18.7%), RSV A (297 of 1,747, 17.0%), RSV B (211 of 1,747, 12.1%), AdV (210 of 1,747, 12.0%), hMPV (130 of 1,747, 7.4%), IFA (114 of 1,747, 6.5%), and hEV (113 of 1,747, 6.5%). PIVs were detected in 176 cases (10.1%) with PIV 3 (70 of 1,747, 4.0%) and PIV 1 (67 of 1,747, 3.8%) being most common. PIV 2, PIV 4, hCV-229E and hCV-OC43 were detected sparingly (8 cases of PIV 2, 31 cases of PIV 4, 20 cases of hCV-229E, 38 cases of hCV-OC43) and were analyzed as a group of PIV and hCV (Table 2).
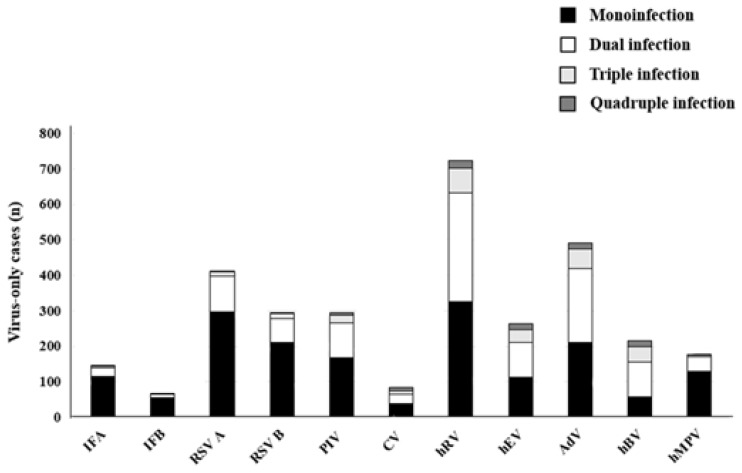
Frequency of single and multiple virus detection. IFA, influenza A virus; IFB, influenza B virus; RSV A, respiratory syncytial virus A; RSV B, respiratory syncytial virus B; PIV, parainfluenza virus; hCV, human coronavirus; hRV, human rhinovirus; hEV, human enterovirus; AdV, adenovirus; hBV, human bocavirus; hMPV, human metapneumovirus.
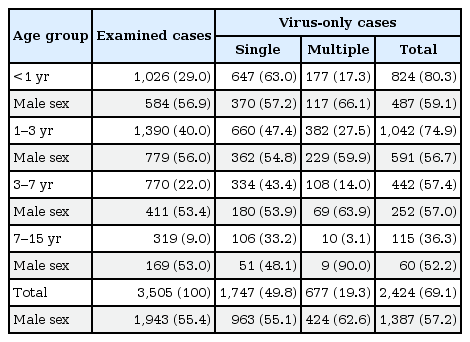
Respiratory virus isolation according to age and sex
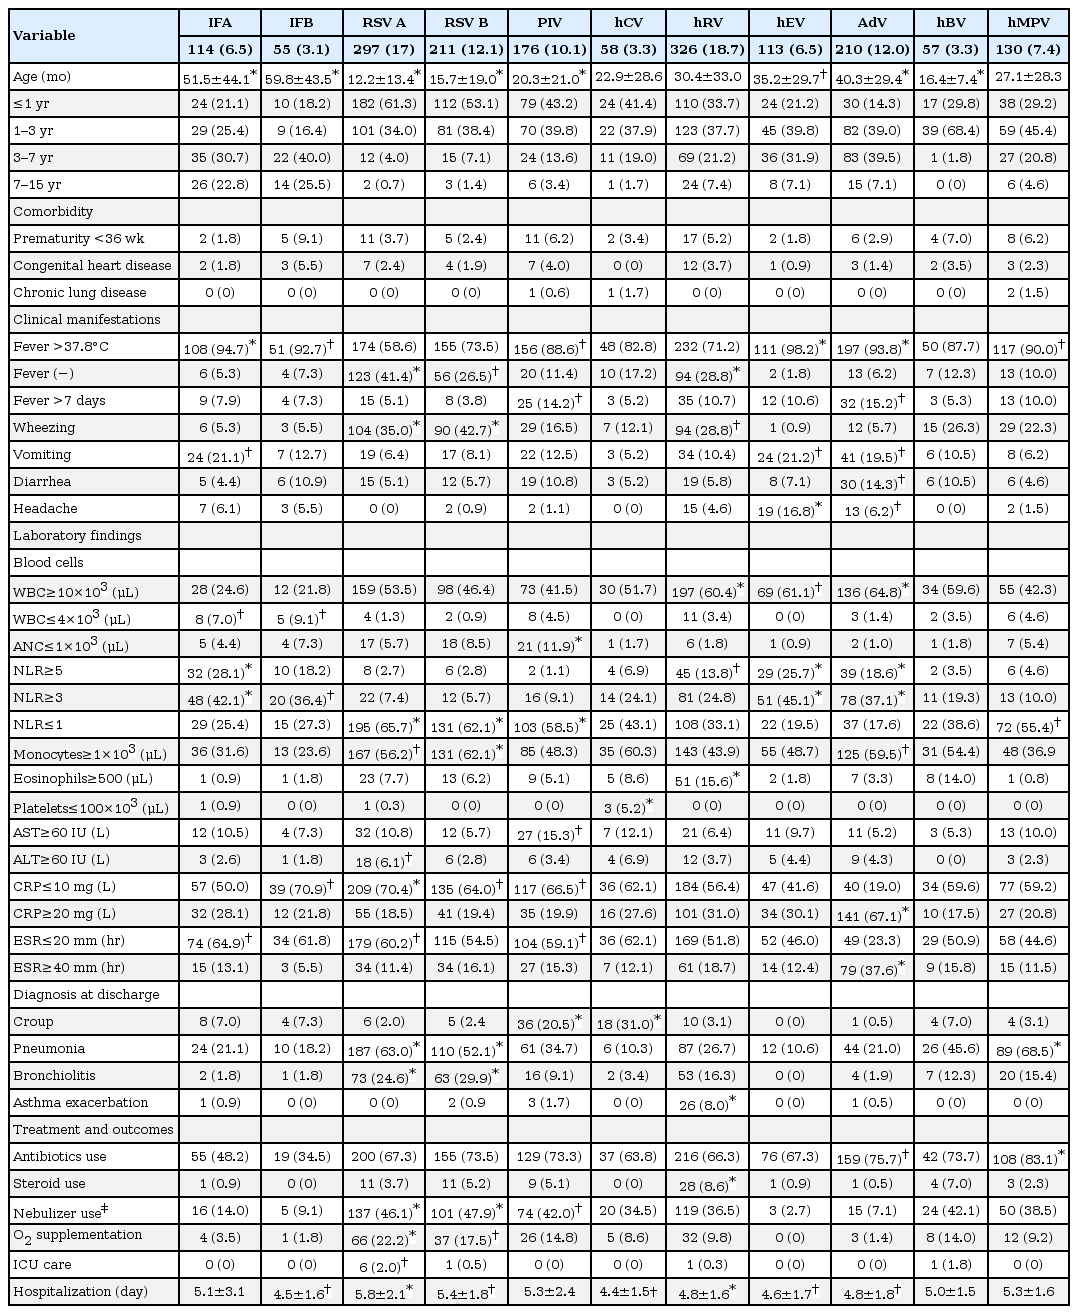
Comparisons of clinical and laboratory profiles in cases with a single respiratory virus infection
2. Age and sex distribution of detected viruses
Viruses were detected more frequently in younger cases (≤1 year old vs. >7 years old was 80.3% vs. 36.3%, P=0.000). Cases with multiple viruses tended to be male-dominant when compared to single-virus cases (62.6% vs. 55.1%, P=0.001) (Table 1). A total of 1,747 single-virus cases were analyzed for their distribution at different ages (Fig. 2). Seventy-five percent of single-virus cases were identified in patients younger than 3 years old. While RSV A, RSV B, hBV, and PIV were major pathogens in patients younger than one year of age, IFA, IFB, hEV, and AdV were common in patients older than three years of age. HRV was a predominant single virus that was seen across all ages. Although not as common as hRV, hMPV was also prevalent across all ages.

Distribution of respiratory virus infection among different pediatric age groups. IFA, influenza A virus; IFB, influenza B virus; RSV A, respiratory syncytial virus A; RSV B, respiratory syncytial virus B; PIV, parainfluenza virus; hCV, human coronavirus; hRV, human rhinovirus; hEV, human enterovirus; AdV, adenovirus; hBV, human bocavirus; hMPV, human metapneumovirus.
3. Seasonal distribution of detected viruses
During the observation period, many viruses showed seasonal patterns. IFA and IFB were most common from winter to spring, while hMPV was predominant in the spring, and PIV and hEV common from spring to summer. RSV A and B peaked during fall and winter biennially. Although not common, hBV was prevalent during the spring and hCV was seen during fall and winter. HRV and AdV did not show a discrete seasonal pattern (Fig. 3). Although each virus prevailed throughout preferred seasons during the observation period, there was annual deviations.

Seasonal distribution of respiratory virus infection in children. IFA, influenza A virus; IFB, influenza B virus; RSV A, respiratory syncytial virus A; RSV B, respiratory syncytial virus B; PIV, parainfluenza virus; hRV, human rhinovirus; hEV, human enterovirus; AdV, adenovirus; hMPV, human metapneumovirus; hBV, human bocavirus; hCV, coronavirus.
4. Clinical features of respiratory viruses
There were no differences in comorbidities such as premature birth, congenital heart disease and chronic lung disease among viral ARI cases. RSV A, RSV B, and hMPV were more associated with lower ARI compared with other viruses. Croup was most commonly associated with PIV and hCV (20.5%, 31.0%), while pneumonia was associated with RSV A, RSV B, and hMPV (63.0%, 52.1%, and 68.5%). Additionally, bronchiolitis was associated with RSV A and B (24.6% and 29.9%), while asthma exacerbations were associated with hRV (8.0%, P<0.001) only. Most cases of ARI presented with cough and rhinorrhea (data not shown). While fever was associated with many viruses, RSV A, RSV B, and hRV were not significantly associated with fever (41.4%, 26.5%, and 28.8%, P<0.05). AdV and PIV were associated with fever lasting more than 7 days (15.2%, 14.2%, P<0.05). Wheezing was significantly associated with RSV A, RSV B, and hRV (35.0%, 42.7%, and 28.8%, P<0.05). Vomiting was significantly associated with IFA, hEV, and AdV (21.1%, 21.2%, and 19.5%), while diarrhea was associated with AdV (14.3%, P<0.05). Headache was significantly associated with hEV and AdV (16.8% and 6.2%, P<0.05). Antibiotics were used more frequently in cases with AdV and hMPV (75.7% and 83.1%, P<0.05), and steroids were used more frequently in cases with hRV (8.6%, P<0.001). RSV was associated with greater nebulizer use, O2 supplementation and intensive care unit care, and it was also associated with a longer hospital stay (Table 2).
5. Characteristic laboratory features of respiratory viruses
Cases of AdV, hEV, and hRV had a greater tendency to show leukocytosis over 10,000/L when compared to other viruses (60.4%, 61.1%, and 64.8%, P<0.05). Although leukopenia less than 4,000/L was observed more with IFA, IFB (7.0%, 9.1%, P<0.05), an absolute neutrophil count less than 1,000/mL was more associated with PIV (11.9%, P<0.001). While neutrophil-dominant inflammation, represented by a neutrophil-to-lymphocyte ratio ≥3, was more associated with IFA, IFB, AdV, hRV, and hEV, lymphocyte-dominant inflammation with a neutrophil-to-lymphocyte ratio ≤1 was more associated with RSV A, RSV B, PIV, and hMPV. Monocytosis greater than 1,000/L was observed more with RSV A, RSV B, and AdV (56.2%, 62.1%, and 59.5%), while eosinophilia greater than 500/L was observed more with hRV than with other viruses (15.6%, P<0.05). Although not common, thrombocytopenia less than 100,000/L was observed more with hCV-OC43 (7.9%, P=0.000). Elevated levels of aspartate aminotransferase and alanine aminotransferase were associated more with PIV and RSV A. C-reactive protein levels less than 10 mg/L were associated with IFB, RSV A, RSV B, and PIV (70.9%, 70.4%, 64.0%, and 66.5%, P<0.05), and an erythrocyte sedimentation rate less than 20 mm/hr were associated with IFA, RSV A, and PIV (64.9%, 60.2%, and 59.1%, P<0.05). Both C-reactive protein levels greater than 20 mg/L and erythrocyte sedimentation rates greater than 40 mm/hr were associated with AdV (P<0.05) (Table 2).
Discussion
In this study, viruses were detected in 74.0% of all ARI cases, but when cases of bacterial coinfection were excluded, viruses were detected in 69.1% of cases. Bacterial infection may be erroneously estimated because we counted all possible cases, even if not confirmed. Additionally, we did not routinely test for bacterial infection at presentation. Nevertheless, viral detection rates in this study were comparable to those of other studies.89) Although hRV, AdV, and RSV are the most prevalent viruses, RSV was more present as a single pathogen, whereas hRV and AdV were more seen with multiple pathogens. RSV, hRV, and PIV were the most prevalent single pathogens in patients younger than 3 years old. After the age of three, the prevalence of RSV decreased while the prevalence of IF and AdV increased, making hRV, IF, and AdV the most prevalent after three years of age. The younger age group shows higher virus positivity compared with the older age group, which may reflect prolonged shedding of respiratory viruses in young children.10)
Cases with multiple detected viruses are more likely to be males, while the sex ratio in single-virus cases is concordant with that of cases examined. The incidence of infectious disease is also reported higher among males.1112) It is possible that after viral infection, viral clearance may be delayed in males, resulting in a greater chance for viruses to accumulate. The significance of multiple viral coinfections has been controversial. While it is unlikely to be associated with more severe illness,91314) specific pathogen pairs such as RSV with influenza virus may be associated with increased severity.9) Studies report strong causal attribution of RSV, IF, and hMPV, less strong evidence for hRV and no attribution of AdV, hBV and hCV,151617) which is in agreement with the ratio of single to multiple detections of each virus in our study. Quantitative viral analysis may help to distinguish active infection from viral shedding in cases with multiple viral coinfection.9)
Because the clinical significance of multiple viral infections remains controversial and hard to interpret, we compared single-virus cases to understand characteristics of each virus. Seasonality of some respiratory viruses is an important clue for early recognition. In addition to the strong seasonal patterns observed with IF, RSV, and hMPV, it is interesting that RSV A and B have an apparent biennial seasonality. While hRV and AdV are prevalent throughout the year, seasonal patterns of viruses are discrete. Each respiratory viruses differ in seasonal onset as well as activity, but this can slightly vary from year to year. Knowing the seasonality of each virus will help to plan effective control strategies and to make epidemiological diagnosis.
Analysis of virus-specific clinical profiles showed that cases of RSV A, RSV B, hBV, PIV, and hCV affect patients who are significantly younger than those with IFA, IFB, AdV, and hEV ARIs. Premature birth history, and presence of congenital heart disease and chronic lung disease are not associated with any specific virus. While fever is a common symptom of ARI, cases of RSV and hRV are significantly afebrile. Infants younger than 6 months with RSV infection tend to be afebrile, which may be due to a lack of a pyrogenic cytokine response.1819) While patients with afebrile RSV cases are significantly younger than febrile RSV cases (2.6 months vs. 11.4 months, P=0.000 for RSV A, 4.9 months vs. 13.9 months, P=0.002 for RSV B), there is no age difference between afebrile and febrile hRV cases (23.8 months vs. 25.8 months, P=0.614) in this study, suggesting that pyrogenic immune responses might be different depending on the virus. Some viral respiratory infections are associated with asthma and asthma exacerbation.20) Cases of RSV and hRV ARI present more commonly with wheezing, but eosinophilia and a diagnosis of asthma exacerbation are associated only with hRV infection in this study. A study performed in children with acute wheezing illness reports that RSV is the predominant virus in patients with no previous wheezing, whereas hRV is predominant in patients with a history of wheezing.21) Whether RSV infection causes asthma is still debatable, but it is possible that lower ARI with pathogens such as hRV and RSV could precipitate the development of asthma, especially in children with atopic features.22)
The total leukocyte, neutrophil, lymphocyte and monocyte counts, and specific associations between blood cells, especially the neutrophil-to-lymphocyte ratio have been used as markers of inflammation and infection.2324) Viral ARIs show leukocytosis rather than leukopenia and furthermore, this study shows that IF, hRV, hEV, and AdV are associated with neutrophil-dominant inflammation whereas RSV, PIV, and hMPV are associated with lymphocyte-dominant inflammation. Of note, monocytosis is observed with RSV A, RSV B, and AdV ARIs. Other inflammatory markers such as erythrocyte sedimentation rate and C-reactive protein levels are not significantly increased in most viral ARIs except for AdV infection. Thus, AdV ARI present with neutrophil-dominant leukocytosis, a high erythrocyte sedimentation rate and a high C-reactive protein level, which mimics the response to bacterial infections.
The decision to use antibiotics is determined by clinical and laboratory evaluation. In this study, antibiotics are used more often in cases of hMPV and AdV, and they are also used more when infection in young infants who are potentially immune-incompetent, manifests as a lower ARI. Concerns of bacterial superinfection often cause us to continue the use of antibiotics, even after identification of a viral pathogen. Application of a clinical rule without consideration of virus-specific clinical and laboratory characteristics may lead us to make a wrong decision.25)
This study has some limitations. Not all patients were examined for a bacterial etiology at presentation, and the use of antibiotics might affect bacterial detection. Thus, it is possible that this study overestimates the number of viral ARIs. Also, the RT-PCR assay used in this study did not quantify the viral load. It is still possible that even the single virus detected in a patient with a symptomatic ARI might not be the causative pathogen.
In conclusion, the epidemiology of predominant viral pathogens associated with ARIs among children differs seasonally as well as regionally. Using routinely available hospital laboratory data will be a great addition to current virus surveillance and will help to identify the viruses circulating in the community and to predict their timing, trends and impact.26) In addition to viral identification, recognition of the virus-specific clinical and laboratory patterns presented in this study will expand our understanding of the epidemiology of viral ARI and will help us to improve management and prevention of viral infections.
Notes
Conflicts of interest: No potential conflict of interest relevant to this article was reported.

