Relationship between serum sodium level and coronary artery abnormality in Kawasaki disease
Article information
Abstract
Purpose
Kawasaki disease (KD) is an immune-related multisystemic vasculitis that occurs in children, especially ensuing from a coronary artery abnormality. Sodium level is known to be related to vascular injury, which could affect the progress of KD. The purpose of this study was to determine the serum sodium levels that could predict the occurrence of cardiac and coronary artery events in KD.
Methods
We conducted a retrospective review of medical records for 104 patients with KD from January 2015 to December 2015. Patients with serum Na levels of <135 mEq/L at the time of initial diagnosis were assigned to the hyponatremia group. Laboratory findings and echocardiographic data were analyzed for various aspects.
Results
Among the 104 patients with KD, 91 were included in the study, of whom 48 (52.7%) had hyponatremia. The degree of fever, white blood cell count, percentage of neutrophils, percentage of lymphocytes, total bilirubin level, brain natriuretic peptide level, erythrocyte sedimentation rate, and C-reactive protein level were higher in the patients with hyponatremia. They also demonstrated a trend of larger coronary artery diameters based on Z scores.
Conclusion
The severity of vascular inflammation in acute KD with hyponatremia might worsen the prognosis of coronary vasculature. Although no statistically significant correlation was found between the initial serum sodium levels and coronary arteriopathy in the patients with KD in this study, a long-term follow-up study with a larger number of enrolled patients should be designed in the future to elucidate the relationship between serum sodium level and coronary arteriopathy in patients with KD.
Introduction
Kawasaki disease (KD) is a vasculitis of unknown etiology which affects small and medium-sized arteries. Classical diagnostic criteria for KD include 5 days of fever and at least 4 of 5 clinical features, including nonexudative conjunctival injection, erythema of oral mucosa with strawberry tongue, atypical rash, edema or erythema of hands and feet, and cervical lymphadenopathy1). Since KD is a systemic vasculitis, multiple organ involvement can occur, and cardiac and coronary vascular involvement is the most important factor which is closely associated with the prognosis of patient.
Several studies revealed that sodium is related to vascular injury234). Aldosterone, the final product of renin-angiotensin-aldosterone system which is produced mostly by adrenal gland, is known to induce vasculopathy5). Decrease in serum sodium level increases the secretion of aldosterone which regulates contractility and remodeling of the vessel wall6).
Meanwhile, after Laxer and Petty7) reported the existence of hyponatremia in patients with KD in 1982, several studies reported about the relevance between serum sodium level and inflammation status of disease. During acute phase of inflammation, proinflammatory cytokines such as tumor necrosis factor-α (TNF-α), interleukin (IL)-1β, and IL-6 are secreted into the systemic circulation, and this process is related to antidiuretic hormone (ADH) secretion. This may lead to syndrome of inappropriate secretion of antidiuretic hormone secretion and hyponatremia in KD8).
Currently low sodium levels are thought to be reflecting the progress of inflammation in patients with KD. By this study, we examined the relationship between serum sodium levels and the occurrence and severity of coronary arteriopathy in acute phase KD.
Materials and methods
One hundred four patients diagnosed as KD by classical diagnostic criteria1) who were admitted to the Department of Pediatrics at Gangnam Severance Hospital (Seoul, Korea) between January 2015 and December 2015, were retrospectively reviewed. All the medical records for clinical characteristics, laboratory data, and echocardiograph results were inspected. Acute phase data was achieved at the time of admission, and follow-up data was achieved at 4 to 8 weeks after discharge.
Hyponatremia was defined as serum sodium level<135 mEq/L9). Coronary artery lesions were assessed by 2-dimensional echocardiography. Measurements of the intraluminal diameters of coronary segments were made from one inner edge to the other inner edge. The left main coronary artery was measured at its midpoint. The left anterior descending (LAD) coronary artery and right coronary artery (RCA) were measured 3 to 5 mm distal to their origins in the parasternal short-axis view10). The coronary artery dimensions were standardized for body surface area as z scores (standard deviation from a predicted normal mean) based on nonlinear regression equations derived from a normal nonfebrile population11). Each measurement was performed by one sonographer.
Data for nonnormally distributed variables were expressed as medians and interquartile ranges. We compared hyponatremia group and normal serum sodium group using the Mann-Whitney U test, and paired data from each group using Wilcoxon matched pairs. Spearman correlation test was used to assess the relationships between variables and the serum sodium level. Analyses were performed using IBM SPSS Statistics ver. 24.0 (IBM Co., Armonk, NY, USA). A P value of <0.05 was considered to be significant.
Results
Among one hundred four patients with KD, 91 subjects were included. 13 patients were excluded from this study as they had previous KD history or they had insufficient initial laboratory or echocardiographic data.
Finally 91 patients were investigated in this study, 48 patients (52.7%) showed hyponatremia (serum sodium<135 mEq/L). Two patients (2.2%) revealed a serum sodium less than 130 mEq/L. The lowest concentration of serum sodium was 128 mEq/L. Clinical manifestation showed difference between the hyponatremia and contrast groups. The degree of fever were higher in hyponatremia group than contrast group (38.6℃ vs. 38.0℃, P=0.012).
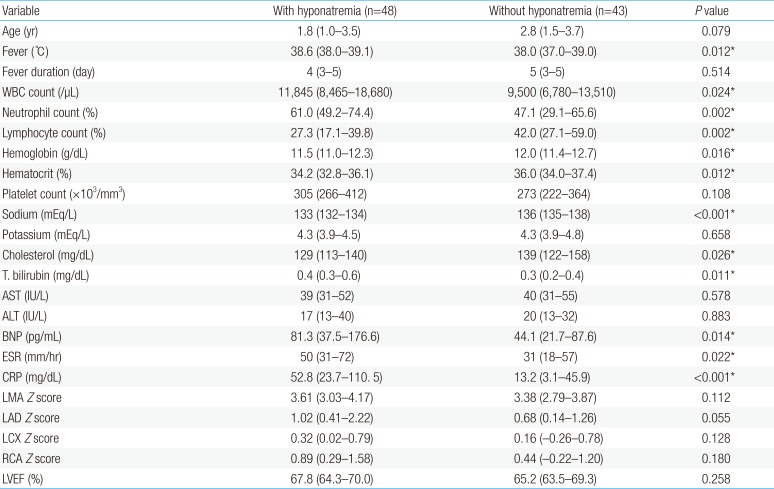
In laboratory finding, white blood cell (WBC) count (11,845/µL vs. 9,500/µL, P=0.024), percentage of neutrophils (61.0% vs. 47.1%, P=0.002), percentage of lymphocytes (27.3% vs. 42.0%, P=0.002), total bilirubin (0.4 mg/dL vs. 0.3 mg/dL, P=0.011), brain natriuretic peptide (BNP) (81.3 pg/mL vs. 44.1 pg/mL, P=0.014), erythrocyte sedimentation rate (ESR) (49.5 mm/hr vs. 31.0 mm/hr, P=0.022), C-reactive protein (CRP) (52.8 mg/dL vs. 13.2 mg/dL, P<0.001) were higher in patients with hyponatremia. The hemoglobin (11.5 g/dL vs. 12.0 g/dL, P=0.016), hematocrit (34.2% vs. 36.0%, P=0.012), serum concentrations of cholesterol (129 mg/dL vs. 139 mg/dL, P=0.026) were lower in patients with hyponatremia (Table 1).

Comparison of laboratory data between the patients with and the patients without hyponatremia
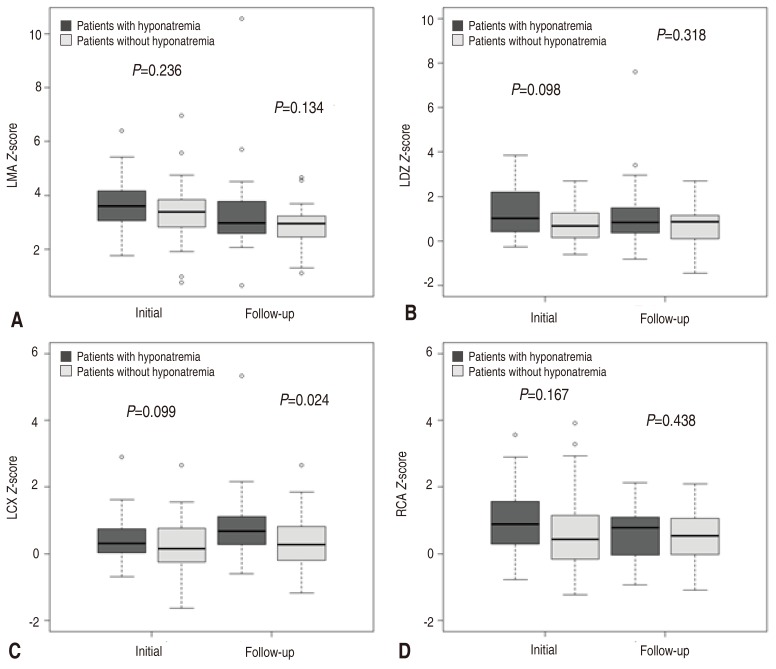
In echocardiographic findings, although there was no statistical significance, the hyponatremia group demonstrated the trend of larger coronary artery diameter with z score. The left main artery (LMA) Z score was 3.61 in hyponatremia group and 3.38 in contrast group (serum sodium≥135 mEq/L) (P=0.112), LAD artery Z score was 1.02 in hyponatremia group and 0.68 in contrast group(P=0.055). Left circumflex (LCX) artery Z score was 0.32 in hyponatremia group versus 0.16 in contrast group (P=0.128), and RCA z score was 0.89 in hyponatremia group and 0.44 in contrast group (P=0.180) (Fig. 1).
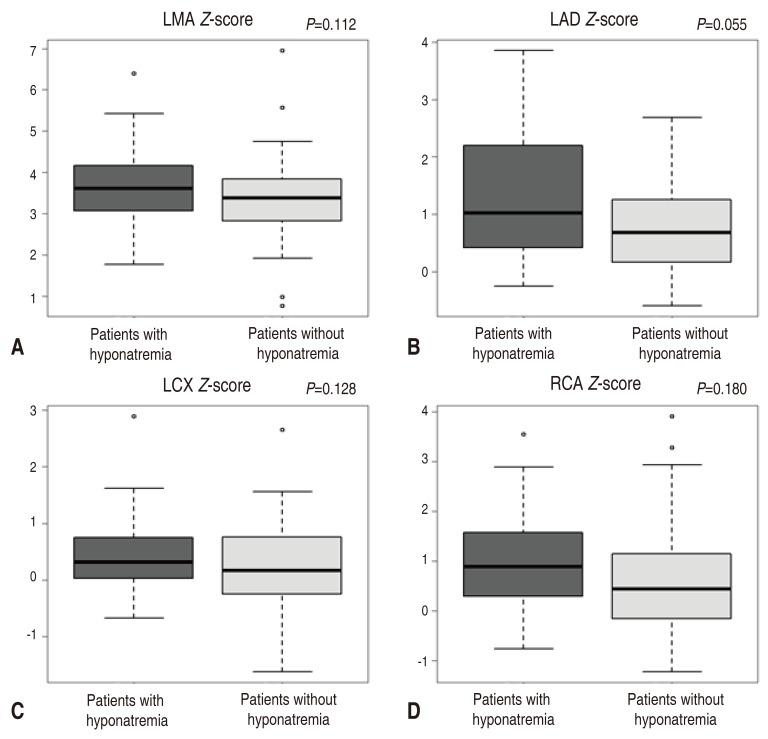
Comparison of the coronary Z scores of LMA (A), LAD artery (B), LCX artery (C), and RCA (D) between the patients with Kawasaki disease who had hyponatremia and those who had no hyponatremia. LMA, left main artery; LAD, left anterior descending; LCX, left circumflex; RCA, right coronary artery.
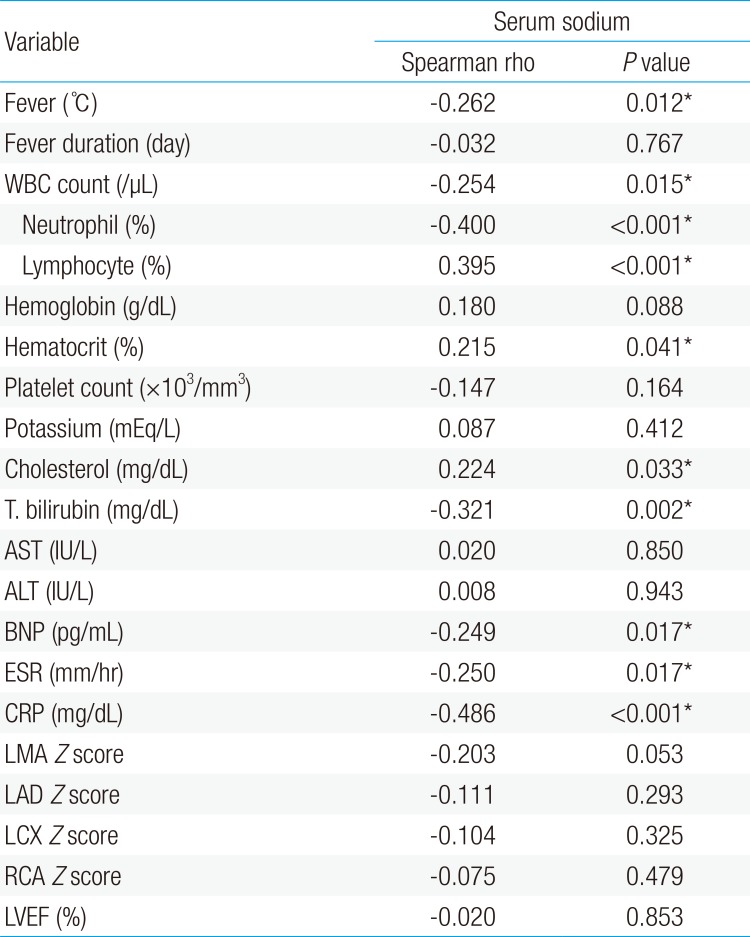
The relationship between serum sodium levels and laboratory data values or echocardiographic findings was presented at Table 2. Serum sodium level and degree of fever (r=-0.262, P=0.012), WBC count (r=-0.254, P=0.015), percentage of neutrophil (r= −0.400, P<0.001), percentage of lymphocyte (r=0.395, P<0.001), hematocrit (r=0.215, P=0.041), cholesterol (r=0.224, P=0.033), total bilirubin (r=−0.321, P=0.002), BNP (r=−0.249, P=0.017), ESR (r=−0.250, P=0.017) showed mild correlation. Serum sodium and CRP demonstrated moderate correlation (r=−0.486, P<0.001) (Fig. 2, Table 2).

Correlations between serum sodium and C-reactive protein (CRP) levels in 91 patients with acute Kawasaki disease.
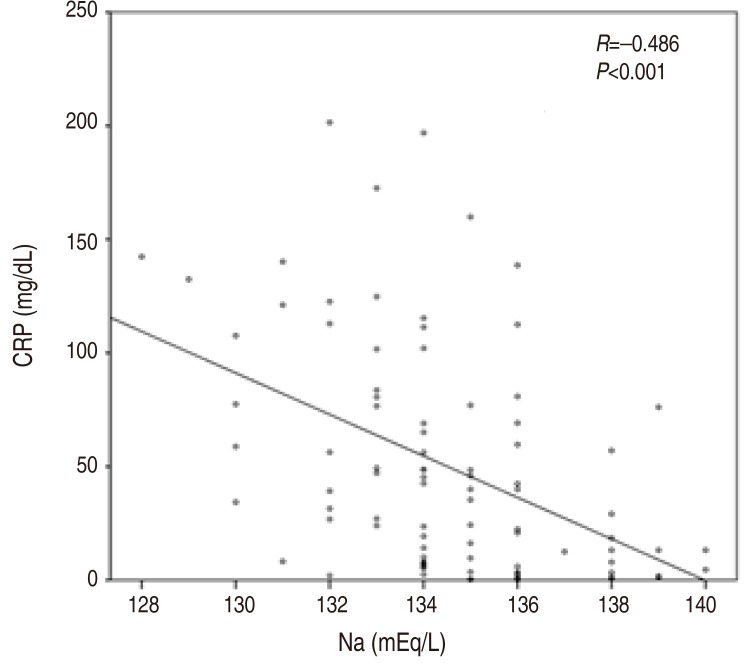
Correlations between serum sodium and C-reactive protein (CRP) levels in 91 patients with acute Kawasaki disease.
The subjects underwent blood test and echocardiogram in 4 to 8 weeks after discharge. From the 91 patients with KD, 2 patients were lost follow-up, 4 patients had insufficient data, One patient visited the out patient clinic less than 4 weeks after discharge, 5 patients visited more than 8 weeks after discharge, and 4 patients had febrile illness at the time of visit. Taken together, 16 patients were excluded from the initial patients group, and finally 75 patients were reviewed about the difference between the initial data and follow-up data in hyponatremia group versus normal group.
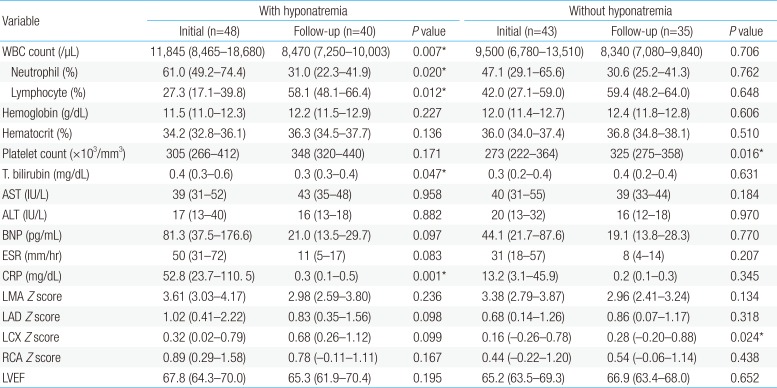
In hyponatremia patients group, WBC count (11,845 /µL vs. 8,470/µL, P=0.007), percentage of neutrophil (61.0% vs. 31.0%, P=0.02), percentage of lymphocyte (27.3% vs. 58.1%, P=0.012), total bilirubin (0.4 mg/dL vs. 0.3 mg/dL, P=0.047), CRP (52.8 mg/dL vs. 0.25 mg/dL, P=0.001) showed significant difference. However, in KD patients without hyponatremia group, only platelet count (273×103/mm3 vs. 325×103/mm3, P=0.016) had relevant difference and others showed no statistical significant difference.
Only LMA Z score showed more than 2 and others showed less than 2 which were in normal range. Initial LMA Z score was larger in hyponatremia group (3.61 vs. 3.38), and the follow-up data was similar in hyponatremia group and contrast group (2.98 vs. 2.96). Both group showed improvement of coronary ectasia in follow-up data, even though there was no statistical significance (Table 3).

Comparison of initial laboratory data and the mean values of follow-up data between the hyponatremia and “normal serum sodium level” groups
Discussion
The mechanisms of hyponatremia may include hyponatremic dehydration due to persisting fever, poor oral intake, or the syndrome of inappropriate ADH secretion induced by IL-1 and IL-6. Many inflammatory cytokines, vascular endothelial growth factor, TNF-α, IL-2, IL-6, effect on vascular wall, resulting in vascular hyperpermeability and vascular leakage, which can bring hyponatremia as well as hypoalbuminemia8).
Hyponatremia is the most common electrolyte disorder and can be encountered in a variety of inflammatory disease including vasculopathy8). Hyponatremia increases the secretion of aldosterone which regulates contractility and remodeling of the vessel wall6). As aldosterone has been recognized to yield some different adverse effects on the vasculature, aldosterone blockade could help to improve endothelial dysfunction, which is important to decrease imminent occurrence of cardiovascular events5).
Nakabayashi and Shimizu12) reported that CRP, neutrophil count, and incidence of coronary arteriopathy were higher, and hemoglobin and total protein were lower in hyponatremia group of KD patients which were indicating hyponatremia group had more severe inflammation. Watanabe et al.13) reported that KD patients with hyponatremia had significant higher alanine transaminase, CRP levels, and incidence of coronary arteriopathy than did KD patients without hyponatremia. Lim et al.14) reported neutrophil count, CRP, and N-terminal pro-brain natriuretic peptide were higher, and serum albumin were lower in KD patients with hyponatremia than in those without hyponatremia.
In our study, hyponatremia occurred in 48 of 91 patients with KD (52.7%), the KD patients with hyponatremia exhibited more severe inflammatory findings, including a higher degree of fever, WBC count, percentage of neutrophils, percentage of lymphocytes, total bilirubin, BNP, ESR, and CRP, together with lower concentrations of hemoglobin, hematocrit, and serum concentrations of cholesterol which were compatible with previous studies. Moreover, the CRP level showed moderate significant correlation with serum sodium level.
Especially, we focused on the severity of coronary arteriopathy depending on the patient's initial serum sodium level. No researches have mentioned about the severity of coronary ectasia according to initial hyponatremia. Even though our result showed no statistical significant difference, the hyponatremia group showed a certain trend of bigger coronary artery Z score. Abnormal results generally improved at the follow up data which were performed 4 to 8 weeks after discharge in outpatient clinic. Definitely, the measurement of Z score with coronary artery diameter decreased in follow-up, especially, the left main coronary artery which was most dilated at the initial presentation showed the largest differential among them (Fig. 3).
Comparison of initial coronary Z scores and follow-up coronary Z scores between the hyponatremia and “normal serum sodium level” groups. Left main artery (LMA; A), left anterior descending (LAD) artery (B), left circumflex (LCX) artery (C), and right coronary artery (RCA; D).
There are some limitations to this study. One is the small sample size, which could have affect the result finding out the connection between the cardiovascular sequelae and initial serum sodium level of acute phase KD patient. The second limitation of this study is the short follow-up duration. Long-term follow-up data might have shown statistically significant relationship between the initial serum sodium level and the coronary arteriopathy. The final limitation of this study is that the day of illness when the laboratory data were obtained was not identical for all patients. The laboratory result change by the progress of the illness so that the day of illness when the data was obtained could have been one of the important factors which should be adjusted.
In conclusion, KD is a vasculitis to develop coronary arteriopathy and potential future cardiovascular sequelae. The severity of vascular inflammation in acute phase of KD combined with hyponatremia to induce aldosterone, which might deteriorate the prognosis of coronary vasculature. Although there was no statistically significant correlation between initial serum sodium level and coronary arteriopathy in patients with KD in this study, long-term follow-up data with more enrolled patients should be designed in future to discover the relationship between the serum sodium level and coronary arteriopathy of patients with KD.
Notes
Conflict of interest: No potential conflict of interest relevant to this article was reported.