Lipopolysaccharide-binding protein plasma levels as a biomarker of obesity-related insulin resistance in adolescents
Article information
Abstract
Purpose
Lipopolysaccharide-binding protein (LBP) is a 65-kDa acute phase protein, derived from the liver, which is present in high concentrations in plasma. Data regarding the association between circulating plasma LBP levels and obesity-related biomarkers in the pediatric population are scarce. We aimed to determine whether there was a difference in plasma LBP levels between overweight/obese and normal-weight adolescents and to assess the correlation of circulating LBP levels with anthropometric measures and obesity-related biomarkers, including insulin resistance, liver enzyme levels, and lipid profiles.
Methods
The study included 87 adolescents aged 12–13 years; 44 were overweight/obese and 43 were of normal-weight. We assessed anthropometric and laboratory measures, including body mass index (BMI), blood pressure, insulin resistance, liver enzyme levels, and lipid profiles. Plasma LBP levels were measured using an enzyme-linked immunosorbent assay.
Results
The mean age of the participants was 12.9±0.3 years. Circulating plasma LBP levels were significantly increased in overweight/obese participants compared with those in normal-weight participants (7.8±1.9 µg/mL vs. 6.0±1.6 µg/mL, P<0.001). LBP levels were significantly and positively associated with BMI, systolic blood pressure, aspartate aminotransferase, alanine aminotransferase, total cholesterol, low density lipoprotein-cholesterol, fasting glucose and insulin, and insulin resistance as indicated by the homeostatic model assessment of insulin resistance (HOMA-IR) (all P<0.05). In multivariate linear regression analysis, BMI and HOMA-IR were independently and positively associated with plasma LBP levels.
Conclusion
LBP is an inflammatory biomarker associated with BMI and obesity-related insulin resistance in adolescents. The positive correlation between these parameters suggests a potentially relevant pathophysiological mechanism linking LBP to obesity-related insulin resistance in adolescents.
Introduction
Obesity has become a significant public health concern and is now occurring at younger ages worldwide1). Mounting evidence suggests that childhood overweightness and obesity often continues into adulthood and is associated with increased morbidity and mortality in adulthood2). This metabolic disorder increases the risk of cardiovascular diseases, ultimately causing premature death3).
In recent years, it has become apparent that increases in a variety of inflammatory biomarkers are associated with obesity in children and their morbid consequences4). However, the mechanisms that trigger the increased inflammatory burden remain elusive. A previously unrecognized source of proinflammatory factors includes the complex ecology of mucosal surface microbes and, most importantly, the gut microbiome5). Changes in the gut microbiome stimulate microbial translocation, i.e., the transfer of microbial organisms or some of their products across intestinal mucosal barriers without definite low-grade bacteremia6). Obesity is one of various conditions related to increased microbial translocation, in particular of lipopolysaccharide (LPS)789).
One of the endogenous reactive biomarkers produced in response to microbial translocation is lipopolysaccharide-binding protein (LBP), a 65-kDa soluble acute phase protein that is mainly produced by hepatocytes10) but is also expressed and released by intestinal epithelial cells11) and visceral adipocytes12). Plasma LBP levels increase greatly in response to inflammatory challenges, including bacterial sepsis13) and a high-fat, high-carbohydrate meal14). Although the molecular basis of LBP formation is not fully established, LBP is known to bind to LPS (and LPS substructures, such as lipid IVa) via recognition of lipid A15). Plasma LBP dramatically accelerates the binding of LPS monomers released from aggregates to CD1416), thereby increasing the sensitivity of cells to LPS. Additionally, LBP functions as a lipid transfer protein, a function consistent with its sequence homology to lipid transferases (phospholipid transfer protein and cholesterol ester transfer protein)9). LBP copurifies with high-density lipoprotein (HDL) particles and previous studies have demonstrated that LBP can relocate LPS to lipoproteins, counteracting the LPS effects17).
Despite increasing evidence that LBP plays an important role in the pathophysiology of cardiovascular diseases18) and obesity91920), no studies have investigated the relationship between circulating concentrations of LBP and obesity-related biomarkers in adolescent populations. Understanding these relationships in adolescent populations might help advance our understanding of the pathophysiology of adolescent obesity, which is generally known to persist into adulthood, and might lead to prevention, early diagnosis, and the development of novel treatments for obesity.
The aims of the present study were to determine whether there is a difference in plasma LBP levels between overweight/obese and normal-weight subjects and to assess the relationship between plasma LBP levels and anthropometric measures and obesity-related biomarkers, such as insulin resistance, liver enzymes, and lipid profiles, in a population of adolescents.
Materials and methods
1. Study subjects
One hundred two adolescents aged 12 to 13 years underwent Student Health Examinations at a designated health promotion center in Seoul, Korea from May through August 2015. Subjects meeting any of the following criteria were excluded (n=15): any missing covariate information; a medication history of steroids, insulin, glucose regulators, or antihypertensive drugs; refusal to take the test; or failure to fast for at least 12 hours before blood sampling. After these exclusions, 87 subjects (55 boys and 32 girls) were included in the final analysis. Health examinations were performed by a single physician according to a standardized procedure. Body weight and height were measured to the nearest 0.1 kg and 0.1 cm, respectively, using an automatic height–weight scale and with the subjects wearing light indoor clothing and no shoes. BMI was calculated as weight (kg)/height (m2). The BMI percentiles for age and sex were determined according to the 2007 Korea Growth Charts21). The subjects were subdivided into 2 groups according to their BMI value: a normal-weight subgroup (BMI<85th percentile) and an overweight/obese subgroup (BMI≥85th percentile). A registered nurse measured blood pressure (BP) a maximum of 3 times on the right arm in seated subjects after a 5-minute rest using a sphygmomanometer. The sexual maturity rating was assessed according to Tanner stages by the physician. The Institutional Review Board approved the study, and written informed consent was obtained from the subjects and their parents or guardians.
2. Laboratory analyses for obesity-related biomarkers
Following a 12-hour overnight fast, blood samples were obtained from the antecubital vein of each subject by venipuncture and were immediately centrifuged, aliquoted, and frozen at -20℃. The frozen serum and plasma samples were stored at -80℃ until analysis. Fasting serum glucose, total cholesterol, triglyceride, and HDL-cholesterol (HDL-C) levels were measured by enzymatic methods using a Hitachi Modular D2400 automated chemistry analyzer (Hitachi, Tokyo, Japan). Levels of low-density lipoprotein-cholesterol (LDL-C) were calculated using the following formula: LDL-C=total cholesterol-HDL-C-(triglyceride/5). Serum aspartate aminotransferase (AST) and alanine aminotransferase (ALT) levels were measured. Fasting insulin levels were measured using a chemiluminescent microparticle immunoassay (Abbott Architect system, Irving, TX, USA). Insulin resistance was estimated using the homeostatic model assessment of insulin resistance (HOMA-IR) and calculated using the following formula: HOMA-IR=[fasting insulin (µIU/mL)×fasting glucose (mg/dL)/18]/22.522).
3. Measurement of plasma LBP
Concentrations of plasma LBP were measured using commercially available enzyme-linked immunosorbent assay (ELISA) kits (Duoset, R&D Systems, Minneapolis, MN, USA) in duplicate according to the manufacturer's instruction. Plasma samples were diluted 1,000 folds. The minimum detectable concentration of LBP was 0.78 ng/mL. No cross-reactivity or interference was observed with LBP. The absorbance values for the ELISA were determined using an Infinite 2000 Pro Multimode Plate Reader (Tecan, Vienna, VA, USA) at an optical absorbance of 450 nm. The final concentration was determined with reference to a standard curve.
4. Statistical analysis
All continuous variables are presented as mean±standard deviation or are shown as scatter plots. Between-group differences were compared using independent Student t tests, Kruskal-Wallis tests, Mann-Whitney U tests, or chi-square tests, as appropriate. Pearson correlation analyses were used to calculate the correlation between plasma LBP levels and anthropometric measures and obesity-related biomarkers. Anthropometric and biochemical parameters according to LBP quartiles were summarized using the Kruskal-Wallis test for continuous variables and the chi-square test for categorical variables. LBP quartiles were categorized separately as follows: Q1, <5.4; Q2, 5.4–6.6; Q3, 6.7–8.2; and Q4, >8.2. To examine independent correlates of plasma LBP levels, a multivariate linear regression analysis was conducted with plasma LBP level as the dependent variable. All statistical analyses were performed using SAS ver. 9.2 (SAS Institute Inc., Cary, NC, USA). All statistical tests were two-sided, with a P value <0.05 indicating statistical significance.
Results
1. Population characteristics
The mean age of the study subjects was 12.9±0.3 years. Forty-four subjects were overweight (25 subjects) or obese (19 subjects) and 43 subjects were of normal-weight. There were 55 boys (63.2 %) and 32 girls (36.8%) in the study population.
2. Comparison of clinical and laboratory parameters between overweight/obese and normal-weight subjects
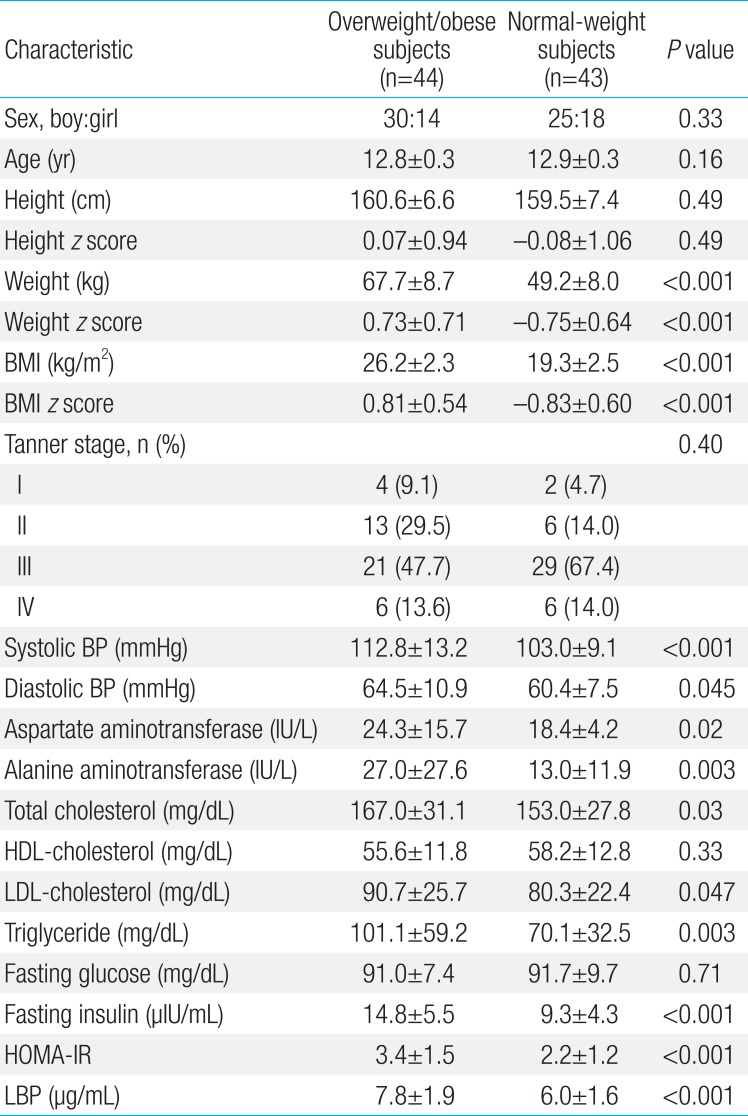
Table 1 compares clinical and laboratory parameters for overweight/obese and normal-weight subjects. In the anthropometric measures, weight, weight z score, BMI, BMI z score, and systolic and diastolic BP were significantly higher in the overweight/obese subjects compared with normal-weight subjects (all P<0.05)(Table 1). There were no differences in sex, age, height, height z score, and Tanner stages between groups. For laboratory parameters, AST, ALT, total cholesterol, LDL-cholesterol, triglyceride, insulin, HOMA-IR, and LBP were significantly higher in the overweight/obese subjects compared with normal-weight subjects (all P<0.05) (Table 1). There were no between-group differences in HDL-cholesterol and fasting glucose levels (Table 1).

General characteristics of the study subjects
3. Associations of LBP with anthropometric measures and obesity-related biomarkers
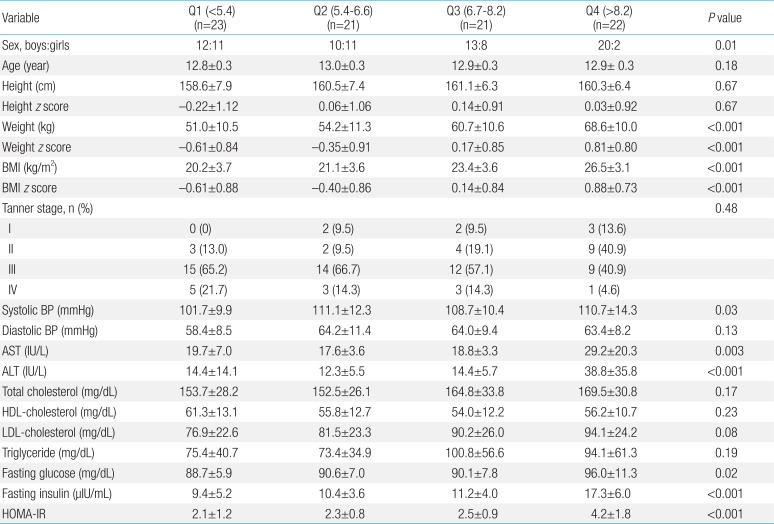
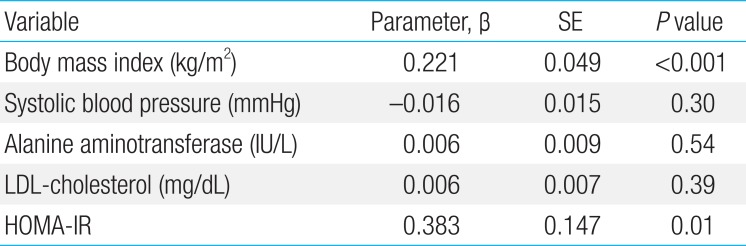
Pearson correlation coefficients between plasma LBP levels and various parameters are listed in Table 2. Plasma LBP level was significantly and positively correlated with weight and weight z score (r=0.60, P<0.001), BMI (r=0.63, P<0.001; Fig. 1A) and BMI z score, systolic BP (r=0.23, P=0.04), AST (r=0.34, P=0.002), ALT (r=0.41, P<0.001; Fig. 1B), total cholesterol (r=0.23, P=0.04), LDL-cholesterol (r=0.26, P=0.02; Fig. 1C), fasting glucose (r=0.24, P=0.02), fasting insulin (r=0.60, P<0.001), and HOMA-IR (r=0.57, P<0.001; Fig. 1D). No significant correlations were observed between plasma LBP levels and age, height, height z score, diastolic BP, HDL-cholesterol, or triglyceride. BMI, BMI z score, systolic BP, AST/ALT, fasting glucose, fasting insulin, and HOMA-IR increased significantly according to LBP quartiles (all P<0.05)(Table 3). No differences in plasma LBP levels were observed according to Tanner stage. In a multivariate linear regression analysis, BMI and HOMA-IR were independently and positively associated with plasma LBP levels (Table 4).

Correlations of plasma lipopolysaccharide-binding protein levels with various parameters
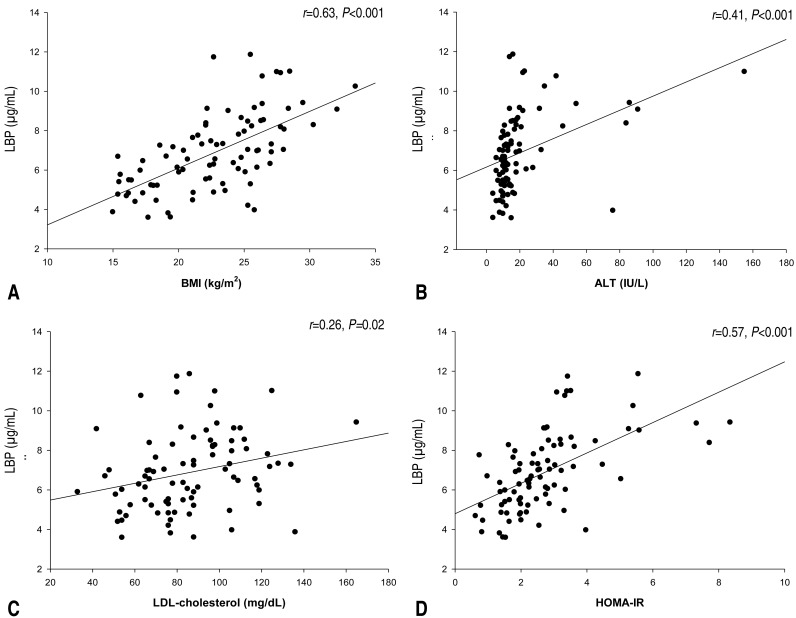
Relationships between plasma LBP and BMI, ALT, LDL-cholesterol, and HOMA-IR in adolescents with and without overweight/obesity. (A) LBP vs. body mass index; (B) LBP vs. alanine aminotransferase; (C) LBP vs. LDL-cholesterol; and (D) LBP vs. homeostatic model assessment of insulin resistance. LBP, lipopolysaccharide-binding protein; BMI, body mass index; ALT, alanine aminotransferase; LDL-cholesterol, low density lipoprotein-cholesterol; HOMA-IR, homeostatic model assessment of insulin resistance.

Anthropometric and biochemical parameters according to plasma lipopolysaccharide-binding protein levels in the study subjects

Assessment of the independent relationships between plasma lipopolysaccharide-binding protein levels and clinical variables
Discussion
The aims of the present study were to determine whether there were differences in plasma LBP levels between overweight/obese and normal-weight subjects and to assess the relationships of LBP with anthropometric measures and obesity-related biomarkers, including BMI, insulin resistance, liver enzymes, and lipid profiles, in young adolescents. We found significantly higher plasma LBP levels in overweight/obese adolescents compared with normal-weight adolescents and a significant positive association between plasma LBP levels and BMI and HOMA-IR in a multivariate linear regression analysis. To the best of our knowledge, this is the first report of a significant positive association between plasma LBP levels and BMI and HOMA-IR in an adolescent population.
The prevalence of obesity and metabolic syndrome is increasing across the globe1). Despite intensified research, the pathogenesis and pathophysiology of these complex diseases are not well understood. Recent studies have reported that obese adults have higher circulating plasma LBP concentrations than controls, suggesting that LBP may be a surrogate marker of underlying low-grade endotoxemia caused by LPS from the gut, which ultimately leads to the development of obesity and metabolic derangements79). In line with previous studies in adults, we found significantly higher plasma LBP levels in overweight/obese adolescents than in normal-weight adolescents. Furthermore, we showed a significant positive association of plasma LBP concentration with BMI and HOMA-IR, even after adjusting for potential confounders.
There may be congruent molecular mechanisms explaining why plasma LBP concentrations are closely associated with BMI and HOMA-IR. One possible explanation is that upstream changes in the gut microbiota in overweight/obese adolescents promote alterations in intestinal permeability or cause microbial translocation that would result in low levels of systemic LPS6). Once in the circulation, LPS forms a complex with LBP15) that would bind to CD1416), resulting in innate immunity events and development of a low-grade systemic inflammatory response with production of tumor necrosis factor (TNF)-α and interleukin (IL)-6. These proinflammatory cytokines block insulin action in adipocytes via autocrine/paracrine signaling and cause systemic insulin resistance via endocrine signaling232425). The association of the gut microbiome with insulin resistance is supported by a recent study that assessed the effect of dietary intervention targeting the gut microbiota on chronic inflammation underlying metabolic syndrome in adults; the authors reported that modulation of the gut microbiota via dietary intervention improved the intestinal barrier integrity, changed the gut microbiome by decreasing endotoxin-producing opportunistic pathogens of Enterobacteriaceae and Desulfovibrionaceae and increasing gut barrier-protecting bacteria of Bifidobacteriaceae, decreased plasma levels of LBP, TNF-α, and IL-6, and ameliorated insulin resistance, eventually alleviating the inflammation and metabolic phenotypes26). Taken together, these observations suggest that measurement of plasma LBP levels might provide a potential biochemical indicator for adolescents at risk for metabolic abnormalities.
The finding of increased plasma LBP levels in overweight/obese adolescents was novel. There are a few studies in the literature reporting the association between LBP levels and obesity in younger children. A study by Luoto et al.8) followed 15 overweight and 15 normal-weight children from the age of 3 months through 10 years and found that the children who were normal weight at age 10 had higher serum concentrations of soluble CD14 that binds to LBP at age 3 months than those who were overweight at age 10, but LBP levels did not differ between groups; they did not look at the association of LBP with HOMA-IR. Another study of 219 children (mean age, 6.8±1.3 years) reported that LBP was independently and positively associated with BMI and with measures of obstructive sleep apnea severity, as well as with metabolic dysfunction, particularly insulin resistance as illustrated by the HOMA-IR27). This previous finding corresponds well with our results in that the increased plasma LBP levels in overweight/obese adolescents were closely related to increased metabolic abnormalities, particularly insulin resistance. The present study is unique in that we focused on young adolescents aged 12–13 years. Adolescence is a crucial period for establishing healthy lifestyle patterns and many of the habits formed during this developmental stage last well into adulthood28). Therefore, it is of critical importance that clinicians detect adolescents at risk of obesity and/or metabolic abnormalities at an early stage and modify their lifestyle, such as diet patterns. In this regard, previous findings and our results are well aligned with the theory that changes in diet patterns in obese subjects will lead to fundamental modifications in gut microbiota, which will subsequently prevent the occurrence of obesity and metabolic derangements262930).
LBP is mainly produced by hepatocytes10). There is recent evidence that LBP levels significantly correlate with levels of proinflammatory cytokines (IL-6 and IL-8) and liver enzymes (ALT and γ–glutamyltransferase)7). Liver metabolism plays a critical role in the pathogenesis of metabolic syndrome31) and insulin resistance31). Furthermore, there is evidence that the levels of liver enzymes increase before nonalcoholic fatty liver disease (NAFLD) develops, suggesting that liver enzymes may be a marker of NAFLD313233). In the present study, ALT showed a statistically significant correlation with plasma LBP levels in univariate analysis, although this association was not maintained in the multivariate linear regression analysis. This discrepancy may reflect the fact that ALT is highly correlated with BMI and HOMA-IR31), a term known as collinearity of independent variables. Collectively, we found that plasma LBP levels were significantly and positively correlated with liver enzyme levels, a marker of liver damage and indicator of liver involvement in systemic inflammatory disease. These observations correspond well with previous studies showing that increased levels of bacterial compounds such as LPS play an important role in the development of NAFLD in obese individuals3435).
The present study has limitations. The epidemiological cross-sectional design of this study does not allow for causal inference and does not give mechanistic insight into the association between plasma LBP levels and BMI and HOMA-IR.
In conclusion, we demonstrated higher plasma LBP levels in the presence of overweight/obesity in adolescents. Moreover, high plasma LBP levels are strongly associated with BMI and measures of insulin resistance. Advanced understanding of the causal relationships underlying these associations may not only lead to novel ways to identify adolescents at risk for such morbidities at an early stage, but also enable researchers to lay out therapeutic interventions, such as microbiome modifications through diet pattern changes or probiotics intake, with the intention of decreasing the degree and risk of some of the morbid consequences of adolescent obesity.
Acknowledgment
This study was supported by a 2014 research grant from the Korean Pediatric Society (Seokchun Award).
Notes
Conflicts of interest: No potential conflict of interest relevant to this article was reported.