Prediction of nonresponsiveness to medium-dose intravenous immunoglobulin (1 g/kg) treatment: an effective and safe schedule of acute treatment for Kawasaki disease
Article information
Abstract
Purpose
Medium-dose (1 g/kg) intravenous immunoglobulin (IVIG) is effective in the majority of patients with Kawasaki disease (KD) but some patients who do not respond to medium-dose IVIG are at high risk for the development of coronary artery lesions (CALs). The purpose of this study was to identify the clinical predictors associated with unresponsiveness to medium-dose IVIG and the development of CALs.
Methods
A retrospective study was performed in 91 children with KD who were treated with medium-dose IVIG at our institution from January 2004 to December 2013. We classified the patients into responders (group 1; n=68) and nonresponders (group 2; n=23). We compared demographic, laboratory, and echocardiographic data between the 2 groups.
Results
Multivariate logistic regression analysis identified 6 variables as predictors for resistance to medium-dose IVIG. We generated a predictive scoring system assigning 1 point each for percentage of neutrophils ≥65%, C-reactive protein≥100 mg/L, aspartate aminotransferase≥100 IU/L, and alanine aminotransferase≥100 IU/L, as well as 2 points for less than 5 days of illness, and serum sodium level≤136 mmol/L. Using a cutoff point of ≥4 with this scoring system, we could predict nonresponsiveness to medium-dose IVIG with 74% sensitivity and 71% specificity.
Conclusion
If a patient has a low-risk score in this system, medium-dose IVIG can be recommended as the initial treatment. Through this process, we can minimize the adverse effects of high-dose IVIG and incidence of CALs.
Introduction
Kawasaki disease (KD) is the most common cause of acquired heart disease in children1). The standard treatment of acute KD is combination of high-dose (2 g/kg) intravenous immunoglobulin (IVIG) and oral aspirin2). IVIG is a blood product consisting primarily of intact IgG molecules derived from human plasma. During the preparation of IVIG, it is impossible to completely eliminate all toxic substances from the product, including viral agents and anaphylatoxins. Although IVIG therapy is relatively safe, systemic adverse reactions to IVIG occur in 20%-40% of patients3). These reactions seem to be associated with high dose (2 g/kg) of IVIG34). Some clinical studies have shown the effectiveness of medium-dose (1 g/kg) IVIG but patients who do not respond to medium-dose IVIG are at high risk for the development of coronary artery lesions (CALs)56). The purpose of this study was to identify clinical risk factors associated with nonresponsiveness to medium-dose IVIG and the development of CALs.
Materials and methods
A retrospective study was performed, whose subjects were 91 patients with KD who were treated with medium-dose IVIG at The Catholic University of Korea, Yeouido St. Mary's Hospital from January 2004 to December 2013. We diagnosed the disease according to the guidelines used in Japan and patients with four of the principal symptoms were diagnosed having atypical KD if coronary aneurysm or dilatation was seen on 2-dimensional echocardiography7). Patients with typical KD and atypical KD accounted for 95.6% (n=88) and 4.4% (n=4), respectively.
Medium-dose IVIG was infused over 10.12 hours as the initial treatment as soon as the diagnosis of KD was made. If fever persisted or recurred within 48 hours, one or more doses of medium-dose IVIG were given. We classified the patients into 2 groups. One group included responders (group 1), who showed clinical improvement with only one dose of medium-dose IVIG and the other included nonresponders (group 2), who required two or more doses of 1 g/kg IVIG. Patients' characteristics in both groups were compared, including demographic features, laboratory findings, and incidence of CALs.
All laboratory tests were performed before the initial IVIG treatment and included a white blood cell (WBC) count, the percentage of neutrophils, a platelet count, the erythrocyte sedimentation rate (ESR), and the concentrations of hemoglobin (Hb), hematocrit, C-reactive protein (CRP), aspartate aminotransferase (AST), alanine aminotransferase (ALT), serum albumin, sodium and potassium. If laboratory tests were performed twice or more before initial IVIG, the highest values were chosen for analysis in the case of WBC, percentage of neutrophils, ESR, AST, ALT, potassium and CRP, and the lowest values in the case of platelet count, hematocrit, concentration of Hb, serum sodium and albumin.
The coronary arteries were assessed by 2-dimensional echocardiography performed during admission, around 2 weeks, 2 months, and 1 year after the onset of fever, according to the institutional protocol. The echocardiography was performed by the same pediatric cardiologist. The coronary artery was defined as abnormal if its luminal diameter exceeded 3.0 mm in children under 5 years old and 4.0 mm in children ≥5 years old, or the internal diameter of a segment was at least 1.5 times that of the adjacent segment, or the luminal contours were clearly irregular8).
The adverse reactions related to IVIG infusion were classified as mild, moderate, or severe, based on the classification scheme proposed by previous studies910). Mild reactions included headache, fever, chills, nausea, vomiting, hypotension, tachycardia, and myalgia. Mild reactions subsided when the infusion rate was decreased. Moderate reactions included mild reactions that increased in severity such as aseptic meningitis, hemolytic anemia, dermatologic complications. Severe reactions included anaphylactic reaction, renal complications, thrombosis. A severe reaction required the further medical attention.
Statistical analysis was performed using SAS 9.3 (SAS institute Inc., Cary, NC, USA). Data were expressed as mean±standard deviation or a percentage, as appropriate. Variables with a skewed distribution were logarithmically transformed. For continuous variables, differences between 2 groups were analyzed using unpaired t test. The chi-square test or Fisher exact test was used to compare categorical variables.
We performed logistic regression analysis to identify significant factors that independently predicted nonresponsiveness to medium-dose IVIG, using continuously distributed variables. The model was simplified in a stepwise fashion by removing variables that had a P value of greater than 0.1. Next, we set an optimal cutoff point by receiver-operator characteristics (ROC) curve for the significant quantitative variables that were chosen by logistic regression analysis1112). The final logistic regression analysis was performed using these cutoff points.
Results
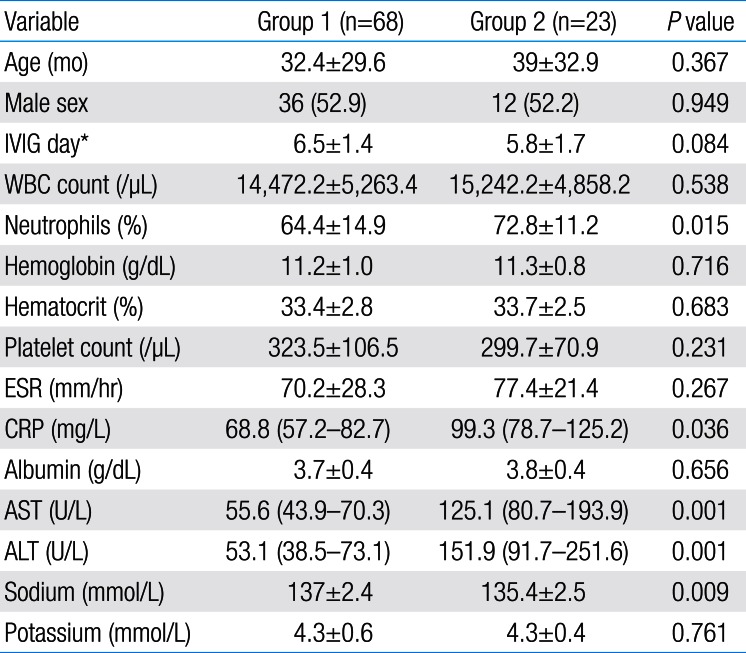
Of the 91 patients, 68 were treated with a single infusion of medium-dose IVIG (group 1; n=68 [74.7%]), and 23 showed improvement with two or more infusions (group 2; n=23 [25.3%]). Five patients (5.5%) of group 2 needed three or more doses of IVIG. When we compared the clinical and demographic features between the 2 groups, there were no significant differences in age, sex distribution, illness days at the initial IVIG administration (Table 1). Group 2 had a higher percentage of neutrophils (64.4% ±14.9% vs. 72.8%±11.2%; reference range, 54%-62%; P=0.015), higher serum levels of AST (55.6 IU/L vs. 125.1 IU/L; reference range, 15.55 IU/L: P=0.001), ALT (53.1 IU/L vs. 151.9 IU/L; reference range, 5.45 IU/L: P=0.001), and CRP (68.8 mg/L vs. 99.3 mg/L; reference range, 0.5-10.0 mg/L: P=0.036), and lower serum sodium level (137±2.4 mmol/L vs. 135.4±2.5 mmol/L; reference range, 135.145 mmol/L: P=0.009) than group 1 (Table 1).

Comparison of clinical and laboratory data between both groups
Multivariate logistic regression analysis identified illness days, percentage of neutrophils, CRP, AST, ALT, serum sodium as significant independent predictors for unresponsiveness to medium-dose IVIG. The positive and negative predictive values of this regression model were 53% and 93%, respectively.
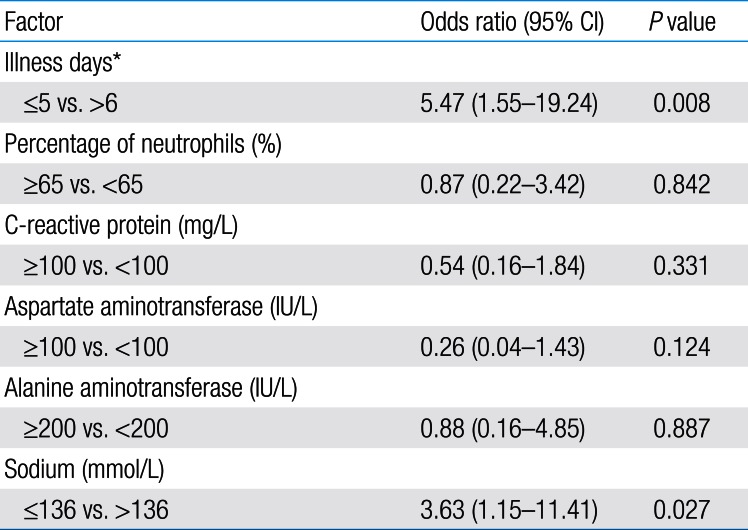
Table 2 shows cutoff points of the significant risk factors. The area under the ROC curve of this regression model was 0.84 (95% confidence interval, 0.76-0.92) (Fig. 1). Based on the odds ratios of significant factors, we assigned points as follows: 1 point each for percentage of neutrophils ≥65%, CRP level ≥100 mg/L, AST level ≥100 IU/L, and ALT level ≥200 IU/L, and 2 points for before day 5 of illness and serum sodium ≤136 mmol/L. The total score of this scoring system is eight. Using a cutoff point of ≥4 with this prediction scoring system, we could predict nonresponsiveness to medium-dose IVIG with 74% sensitivity and 71% specificity. The positive and negative predictive values were 46% and 89%, respectively.

Predictive factors and cutoff values for nonresponsiveness to medium-dose IVIG
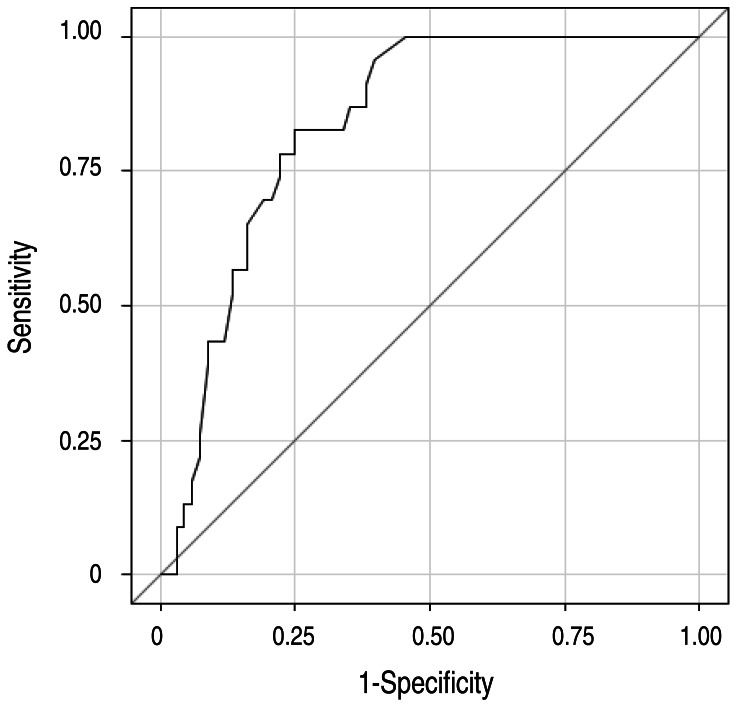
Receiver-operator characteristic (ROC) curves for the regression model with illness days, percentage of neutrophils, alanine aminotransferase, aspartate aminotransferase, C-reactive protein, and sodium. The area under the ROC curve of this regression model was 0.84 (95% confidence interval, 0.76-0.92).
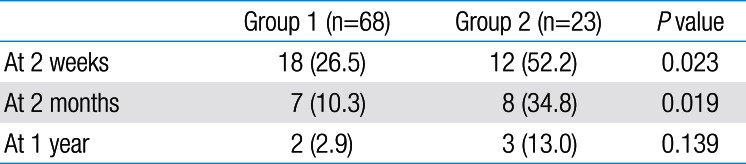
Table 3 shows the incidences of CALs in each group. Group 2 showed higher incidences of CALs at 2 weeks (18 of 68 [26.5%] vs. 12 of 23 [52.2%], P=0.023) and 2 months (7 of 68 [10.3%] vs. 8 of 23 [34.8%], P=0.019). The 1-year follow-up study showed higher incidence of CALs in group 2, but the difference was not statistically significant.

Incidence of coronary artery lesions in each group
Discussion
In the treatment of KD, it is well-known that a single infusion of 2-g/kg IVIG alleviates the acute inflammatory response and can effectively prevent CALs, which are the most important complication of KD131415). However, IVIG therapy is associated with several adverse reactions. Adverse reactions are more likely to occur with a large infusion dose, such as the current standard dose (2 g/kg) in the treatment for acute KD3). Common and mild side effects associated with IVIG include headaches, flushing, fever, nausea, diarrhea, urticaria, blood pressure change, and tachycardia. Although rare, the serious and potentially fatal side effects include anaphylactic reactions, aseptic meningitis, acute renal failure, and other thrombotic complications. Most studies reported that the rates of adverse events after IVIG administration are between 30% and 40%16). In this study, only 9% of patients experienced adverse systemic reactions including fever, diarrhea and rash. This result suggests that medium-dose IVIG therapy can reduce the rates of adverse events following IVIG administrations.
In this study, we investigated the incidence of CALs in KD patients treated with medium-dose IVIG, comparing the nonresponder group that required additional dosing to the responder group that showed clinical improvement with a single dose. The results showed a higher incidence of CALs in the nonresponder group at all follow-up studies, but the difference was statistically significant only at 2 weeks and 2 months. Hence, if it is possible to identify the predictive factors of nonresponsiveness to a medium-dose IVIG prior to treatment, it will be possible to administrate high-dose IVIG to the patients at a high risk of CALs, thereby reducing the incidence of CALs.
Various scoring systems have been proposed to identify patients at high risk of coronary artery complications. Representative scoring systems, including the Kobayashi score, the Sano score, and the Egami score, reported that younger age, short illness day, high neutrophils count, high CRP concentration, high AST and ALT, low platelet count, and low serum sodium were risk factors for CALs and IVIG resistance161718). The sensitivity and specificity of these scoring systems were 78%, 77%, 78%, respectively and 78%, 86%, 76%, respectively. In this study, we found that high AST, ALT, CRP and percentage of neutrophils; low serum sodium; and administration of IVIG in the early stage of illness are independent risk factors for nonresponsiveness to medium-dose IVIG treatment. These results were similar to those of the previously commented Japanese scoring systems. However, our study has its own significance because it was conducted on children who were treated with medium-dose IVIG.
There are some limitations in this study. First, this is a retrospective study. There might be bias introduced in the results. Second, we adopted the criteria of Japanese Ministry of Health in defining CALs, and it might underdiagnose CALs19). Finally, this study included a relatively small number of patients because it was conducted at a single center. Prospective or multicenter studies are needed to verify our predictive model.
In conclusion, we suggest that clinicians should assess the clinical and laboratory data of a patient with KD before the start of IVIG therapy and determine the initial dose of IVIG. If the patient has no risk factors, medium-dose IVIG administration is recommend as the initial treatment of KD. Through this process, we can prevent the adverse effects of high-dose IVIG and minimize CALs in KD patients.
Notes
Conflicts of interest: No potential conflict of interest relevant to this article was reported.