Evaluation of changes in random blood glucose and body mass index during and after completion of chemotherapy in children with acute lymphoblastic leukemia
Article information
Abstract
Purpose
Improved survival of patients with childhood acute lymphoblastic leukemia (ALL) has drawn attention to the potential for late consequences of previous treatments among survivors, including metabolic syndrome. In this study, we evaluated changes in 3 parameters, namely, random blood glucose, body mass index (BMI), and Z score for BMI (Z-BMI), in children with ALL during chemotherapy and after completion of treatment.
Methods
Patients newly diagnosed with ALL from January, 2005 to December, 2008 at Saint Mary's Hospital, The Catholic University of Korea, who completed treatment with chemotherapy only were included (n=107). Random glucose, BMI, and Z-BMI were recorded at 5 intervals: at diagnosis, before maintenance treatment, at completion of maintenance treatment, and 6 and 12 months after completion of maintenance treatment. Similar analyses were conducted on 2 subcohorts based on ALL risk groups.
Results
For random glucose, a paired comparison showed significantly lower levels at 12 months post-treatment compared to those at initial diagnosis (P<0.001) and before maintenance (P<0.001). The Z-BMI score was significantly higher before maintenance than at diagnosis (P<0.001), but decreased significantly at the end of treatment (P<0.001) and remained low at 6 months (P<0.001) and 12 months (P<0.001) post-treatment. Similar results were obtained upon analysis of risk group-based subcohorts.
Conclusion
For a cohort of ALL patients treated without allogeneic transplantation or cranial irradiation, decrease in random glucose and Z-BMI after completion of chemotherapy does not indicate future glucose intolerance or obesity.
Introduction
With the overall survival of childhood acute lymphoblastic leukemia (ALL) surpassing 80%, much attention is now focused on minimizing the long-term adverse effects of necessary treatment. An important disease entity in this regard, is the aggregate of obesity, impaired glucose tolerance and insulin resistance, dyslipidemia, and hypertension that comprise the metabolic syndrome. First described by Reaven1) in 1988, the metabolic syndrome is now a well-established disease of adulthood and is known to increase the risk of cardiovascular events and subsequent mortality2).
Several reports have previously shown that adult survivors of childhood ALL are at increased risk of developing the metabolic syndrome3,4), with more recent studies indicating an overall prevalence of 9 to 13% amongst adults survivors5,6). These rates are significantly higher than are found in the control adult population. Important risk factors that have become evident from these studies include the use of cranial irradiation for central nervous system (CNS) prophylaxis7,8), and treatment with total body irradiation as part of the conditioning regimen before allogeneic hematopoietic stem cell transplantation (HSCT)5). Growth hormone deficiency that can result from both of these treatment modalities is a significant causative factor for the development of metabolic syndrome, and growth hormone replacement may allow for amelioration of metabolic syndrome indices9).
However, the number of children who have been exposed to either of these 2 significant treatment modalities amongst those who have recently completed treatment for ALL is small. HSCT is not undertaken on the majority of patients with childhood ALL, and with greater emphasis on intensive intrathecal treatment as the means of CNS prophylaxis in recent treatment regimens, the number of patients administered cranial irradiation is decreasing. Hence, the question arises as to whether the increased risk of metabolic syndrome observed in adulthood is still applicable to the majority of children who have recently completed treatment for ALL.
To address this issue, in this study we observed for changes in 2 significant parameters of the metabolic syndrome, random blood glucose and body mass index (BMI), both crude BMI and age and gender-adjusted Z score for BMI (Z-BMI), in a cohort of children who have recently completed treatment for ALL with chemotherapy only, without either cranial irradiation or HSCT.
Materials and methods
1. Study cohort
Initial study cohort consisted of 164 children newly diagnosed with ALL during a 4 year period from January, 2005 to December, 2008 at the Department of Pediatrics, Saint Mary's Hospital, The Catholic University of Korea.
In order to study a uniform group of patients who had completed sequential ALL chemotherapy without event and were currently off treatment, the following exclusions were made: 1) patients who experienced an event: 9 relapsed patients, 4 patients who died without achieving first complete remission, 2) patients who received treatment other than risk group-based sequential chemotherapy: 26 patients who received allogeneic HSCT at any point in treatment, 2 patients who underwent major modifications to the chemotherapy regimen due to toxicity, 3) patients with incomplete data or follow-up till end of chemotherapy: 5 patients who were transferred to other institutions before completion of treatment, 2 patients with incomplete data, and 9 patients who were still receiving chemotherapy as of May 31st, 2011. Hence, the final study cohort included 107 ALL patients who had completed chemotherapy without event (Table 1).
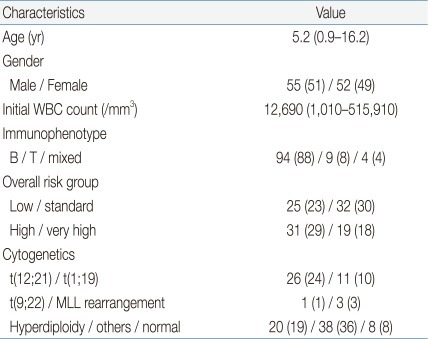
Major Characteristics of the Study Cohort
2. Treatment for ALL
Newly diagnosed patients were stratified into four risk groups according to a classification scheme that has been published previously10), incorporating major characteristics at diagnosis as well as response to initial treatment. Chemotherapy was done according to institutional protocol (CMCPL-2005), with remission induction undertaken as published elsewhere11). Chemotherapy following the consolidation phase differed according to risk group with low and standard risk patients treated with only one phase of interim maintenance and delayed intensification each before entering maintenance, while high and very high risk patients underwent two phases of interim maintenance and delayed intensification. CNS prophylaxis consisted of sequential intrathecal chemotherapy and did not include CNS irradiation. Low-standard risk patients received 19 to 21 doses of intrathecal chemotherapy throughout treatment, while high-very high risk patients received 25 to 28 doses. Maintenance treatment included 8 cycles of chemotherapy administered every 12 weeks. Throughout treatment, dexamethasone was administered for steroid treatment. After completion of treatment, patients underwent regular follow-up in the outpatient clinic to check status, including measurements of weight and height, complete blood counts and blood chemistry values.
3. Study design
1) Data collection
In order to study significant changes in random glucose, BMI, and Z-BMI, these values were retrospectively reviewed and recorded for five specific clinical points for the patients in the study cohort: at diagnosis, just before start of maintenance chemotherapy, at completion of maintenance chemotherapy, 6 months after completion of chemotherapy, and 12 months after completion of chemotherapy (Fig. 1). These time points were chosen to observe changes in the study parameters from diagnosis to completion of intensive sequential chemotherapy (time point before start of maintenance chemotherapy), to completion of treatment. Random glucose values were obtained from blood chemistry results. BMI was calculated from the formula: BMI=weight (kg)/(height [m])2.

Schematic of patient chemotherapy, follow-up after completion of chemotherapy, and time points of data collection. (1) The arrows with Arabic numerals indicate time points of data collection: 1, at diagnosis; 2, just before the start of maintenance chemotherapy; 3, at completion of maintenance chemotherapy; 4, 6 months after completion of chemotherapy; 5, 12 months after completion of chemotherapy. (2) The period of premaintenance chemotherapy includes remission induction, consolidation, sequential interim maintenance, and delayed intensification according to risk group.
Z-BMI was calculated utilizing age and gender appropriate L, M, S values and methods previously published on recent growth indices in Korean children12). For the purposes of evaluation, Z-BMI>2 was considered overweight, and BMI≥25 kg/m2 or Z-BMI>3 was considered obese. Depending on the date of treatment completion, not all the patients in the study cohort had data for up till 1 year after end of treatment; overall, 107, 92, and 88 patients had values for up till completion of maintenance chemotherapy, 6 months after completion of chemotherapy, and 12 months after completion of chemotherapy respectively.
2) Data analysis
Initially, the mean values for random glucose, BMI and Z-BMI were compared according to time point after treatment completion. Hence, the mean values at diagnosis and before initiation of maintenance chemotherapy were compared to those at completion of maintenance treatment (n=107), 6 months after treatment completion (n=92), and 12 months after treatment completion (n=88) respectively. Analysis was done to observe for significant trends in mean values obtained from the three sequential time points.
Second, in order to retrieve results from a uniform cohort with complete data, mean values for the three study parameters were calculated and compared for all five time points for the 88 patients who had complete follow-up data up till one year after treatment completion. After observing for overall significant trends, the following specific, paired comparisons of mean values were made; 1) at diagnosis - before maintenance 2) at diagnosis - 12 months after treatment completion 3) before maintenance - at treatment completion 4) before maintenance - 6 months after treatment completion 5) before maintenance - 12 months after treatment completion.
Finally, the full cohort of 88 patients was divided into 2 sub-cohorts based on ALL risk group: low/standard risk group (41 patients) and high/very high risk group (47 patients). Similar analyses of overall trends in the measurements at 5 time points, and paired comparisons as had been done for the full cohort of 88 patients were done on these 2 separate cohorts.
4. Statistical analysis
Mean values and standard errors of the mean were calculated for each study parameter. In order to observe for overall significant trends in the mean values at sequential time points, one-way repeated-measures analysis of variance (ANOVA) was used. Assumption of sphericity was tested using Mauchly's test. If the assumption of sphericity was violated, multivariate ANOVA (MANOVA) testing was done, with Pillai's trace statistic considered for test significance. Pairwise comparisons within the framework of multiple repeated measures were done with paired t-tests, with Bonferroni correction done for the five comparisons. P value of <0.05 was considered significant. Statistical analyses were done with SAS ver. 9.1 (SAS Institute Inc., Cary, NC, USA) and SPSS ver. 12 (SPSS Inc., Chicago, IL, USA).
Results
1. Analysis according to time point after treatment completion
Table 2 summarize the values for random glucose, BMI, and Z-BMI at diagnosis, before maintenance treatment, and the 3 time points after treatment completion, that is, at completion of maintenance, 6 months and 12 months after treatment completion. A significant difference in the study parameter values at the 3 time points was found for all instances except for random glucose at diagnosis - before maintenance - treatment completion.
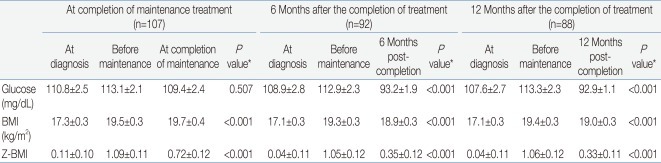
Mean Values for Random Glucose, BMI and Z-BMI
For random glucose, there was a significant trend towards lower values at 6 months and 12 months after treatment completion compared to values both at diagnosis and before maintenance treatment. For both BMI and Z-BMI, there was a significant trend towards higher values at all points after treatment completion compared to those at initial diagnosis. However, the values observed post-treatment tended to be lower than the peak values observed before maintenance treatment.
2. Analysis of uniform cohort of patients up till 12 months after treatment completion
Table 3 and Fig. 2A-C show the mean values for random glucose, BMI, and Z-BMI at all 5 time points for a full cohort of 88 patients up till 12 months after treatment completion. A significant difference was found in the measurement of all 3 study parameters for the 5 consecutive time points (P<0.001 for each parameter).
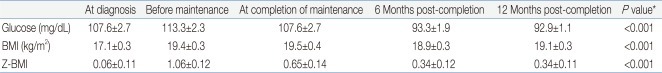
Mean Values for Random Glucose, BMI, and Z-BMI at all 5 Time Points for the Full Cohort of 88 Patients up to 12 Months after the Completion of Treatment
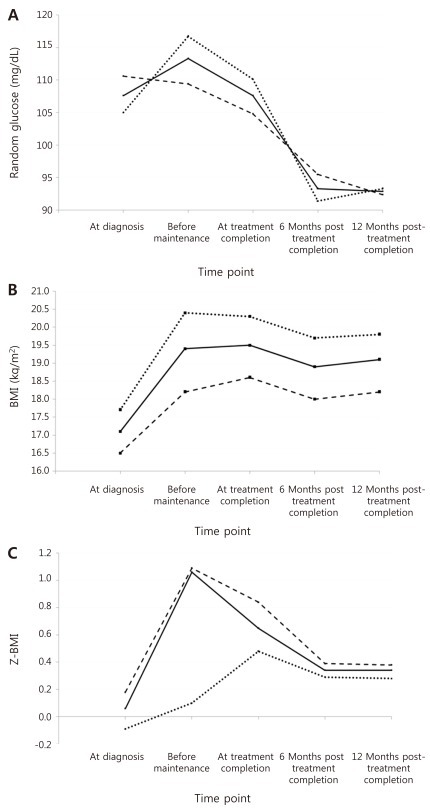
Mean values for random glucose (A), body mass index (BMI) (B), Z score for BMI (Z-BMI) (C) at all 5 time points for the full cohort of 88 patients up to 12 months after the completion of treatment (bold line), as well as for subcohorts of low-standard risk patients (dashed line) and high-very high risk patients (dotted line).
For random glucose, the mean value at 12 months post-treatment completion was significantly lower than that at diagnosis (Table 4). Furthermore, the mean values at 6 months and 12 months post-treatment completion were significantly lower than that before maintenance treatment, that is after having completed intensive sequential chemotherapy. The highest random glucose level was measured before maintenance treatment (Fig. 2A). At 12 months post-treatment completion, none of the patients had random glucose values suggestive of impaired glucose tolerance.
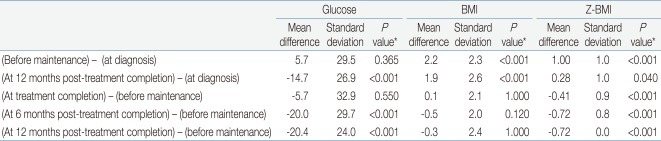
Paired Comparisons within the Uniform Cohort (n=88) for Random Glucose, Body Mass Index (BMI), and Z-BMI Measured at the 5 Consecutive Time Points
For BMI, the mean values before maintenance treatment and at 12 months post-treatment completion were significantly higher than the mean BMI at diagnosis.
For Z-BMI, again the mean values before maintenance treatment and at 12 months post-treatment completion were significantly higher than the mean Z-BMI at diagnosis. However, unlike the crude measurement of BMI, Z-BMI decreased significantly at treatment completion and at 6 and 12 months post-treatment completion compared to the mean value before maintenance treatment. The highest Z-BMI was measured before maintenance treatment (Fig. 2C). At 12 months post-treatment completion, 5 patients (5.7%) had Z-BMI values indicative of overweight status (Z-BMI>2), and none had values consistent with obesity.
3. Analysis of 2 subcohorts based on ALL risk group up till 12 months after treatment completion
A similar study of mean values for random glucose, BMI and Z-BMI at all 5 time points was done separately on 2 subcohorts based on ALL risk group. Again, significant differences were found in the consecutive measurements of the study parameters for the 5 time points, despite dividing the cohort based on risk group (P<0.001 for each parameter).
Paired analyses done for each subcohort showed similar results as for the full cohort for random glucose and BMI (Fig. 2A, B). However, for random glucose, the mean value before the beginning of maintenance treatment was significantly higher than at diagnosis for the high-very high risk subcohort (P=0.008). The highest random glucose measurement was checked at diagnosis for the low-standard risk group, with decreasing values throughout chemotherapy and completion. For the high-very high risk group, the highest measurement was checked before maintenance treatment, similar to results for the full cohort (Fig. 2A).
Paired analyses for Z-BMI showed the same results as for the full cohort except in 2 instances; for the low-standard risk subcohort, the value at 12 months post-completion, although higher, did not differ significantly from that at diagnosis (P=1.000). For Z-BMI, the highest level was checked before maintenance treatment for the low-standard risk group, as was the case for the full cohort. However, for the high-very high risk group the Z-BMI increased from diagnosis up till treatment completion, gradually decreasing afterwards (Fig. 2C).
Discussion
In this study, we evaluated for changes in random glucose and BMI during and immediately after treatment for childhood ALL. These 2 values are important components for the diagnosis of metabolic syndrome which, in the context of treatment for childhood ALL, may be caused by growth hormone deficiency or endothelial dysfunction after chemotherapy13). With most reports of a linkage between treatment for childhood ALL and the metabolic syndrome originating from North America and Europe, we believe our study is one of the few that derive from a non-Western pediatric population.
In our study of a full cohort of 88 patients, as well as the study of subcohorts based on risk group, we found significant differences in the consecutive values of random glucose, BMI and Z-BMI measured at 5 different time points. Several important observations could be made with regards to random glucose trends. First, the random glucose measurement was highest before beginning of maintenance treatment, that is after having completed sequential intensive chemotherapy including remission induction, consolidation and delayed intensification. However, the mean random glucose level even at this highest point was not indicative of glucose intolerance, bringing to question the actual impact of chemotherapy on hyperglycemia. Also, a significant difference between mean random glucose at this time point and mean random glucose at diagnosis was only observed in the high-very high risk group subcohort, possibly indicating a greater effect of more prolonged chemotherapy in this group on blood glucose level. Second, this peak of random glucose level decreased significantly at 6 months and 12 months after treatment completion to normal levels, in accordance with a previous study which found no relationship between transient hyperglycemia during treatment and glucose intolerance in the first several years after treatment completion14). Third, the random glucose levels after treatment completion were even lower than those found at diagnosis and for the low-standard risk subcohort, the mean random glucose at diagnosis was actually the highest point in overall follow-up. Several studies have noted an increased incidence of transient hyperglycemia during remission induction treatment for childhood ALL15,16), mostly with an emphasis on chemotherapy-related etiology. However, our results, especially those of the low-standard risk subcohort emphasize the possible role of baseline disease status prior to treatment, and the catabolic effect of a physically stressed situation at diagnosis as having a major impact on hyperglycemia prior to remission induction.
The mean BMI predictably increased from diagnosis to before maintenance treatment, and seemed to plateau afterwards. However, none of the mean BMI values at the 5 time points fulfilled the definition of either overweight status or obesity.
The 50th percentile BMI value tends to show a normal increase with age, and in order to correct for this physiologic incrementation we also analyzed for age and gender-adjusted BMI Z score. Important points that could be summarized from analysis of Z-BMI data were as follows: first, as was the case with random glucose, the mean Z-BMI value for the full cohort peaked at the beginning of maintenance treatment, again possibly emphasizing the effect of sequential intensive chemotherapy on metabolic syndrome indices. Second, the high mean Z-BMI tended to decrease during maintenance treatment and was significantly lower at treatment completion, as well as 6 and 12 months afterwards. Third, although the mean value at 12 months post-treatment completion was lower than the peak before maintenance treatment, it was still significantly higher than the mean Z-BMI found at diagnosis for the full cohort and the high-very high risk subcohort, indicating the need for continued monitoring for obesity beyond 12 months post-treatment completion.
In summary, then, although both the random glucose level and the Z-BMI peaked after completion of intensive, sequential chemotherapy, none of the mean values were high enough to indicate a disease process such as glucose intolerance or obesity. Furthermore, these values declined significantly from this peak after completion of treatment and during the short 12 month follow-up that ensued, although the mean Z-BMI was still higher at last follow-up than at diagnosis. The potential for late-onset metabolic syndrome still exists, demanding long-term follow-up into adulthood, but the risk for metabolic syndrome, at least in terms of glucose intolerance and obesity, is not fully evident in our short-term follow-up of patients naïve to both cranial irradiation and HSCT.
These results are in contrast to those of similar studies of obesity in childhood ALL patients who completed treatment with chemotherapy only, in which a significant portion of patients studied were found to be either overweight or obese at treatment completion17,18). One previous study also based on Korean children with ALL found a trend towards continued increase in BMI even after treatment completion19).
Our study also brings to question the risk for late-onset metabolic syndrome for the majority of current childhood ALL patients who receive chemotherapy only for treatment. Recent longitudinal studies on metabolic syndrome in survivors of childhood ALL were done on adults with a median age at evaluation of 21.2 and 28 years5,6). Hence, many of these adults were treated with previous ALL regimens with incorporation of cranial irradiation. The projected incidence of metabolic syndrome in children who have recently completed treatment, such as the cohort in this study, may differ significantly from current estimations. Possibly even, the increased risk for metabolic syndrome for the majority of ALL survivors may be limited to people belonging to certain historical cohorts treated on past regimens, and who are now adults, and may differ in survivors who are now still children and require long-term follow-up into adulthood. The role of underlying ethnic differences in childhood and adult incidence of obesity and metabolic syndrome also requires evaluation when considering disparities between our results and past analyses that derive mostly from non-Asian nations20).
In conclusion, our short-term follow-up of 2 major indices of the metabolic syndrome, blood random glucose and BMI, in children who have completed treatment for ALL with chemotherapy only indicates transient rises to non-pathologic levels for both factors after intensive chemotherapy, with subsequent decline, rather than persistent elevation, after treatment completion. As metabolic syndrome is defined by more than just glucose levels and BMI, potential for increased risk of metabolic syndrome with maturation of our cohort into adulthood requires further investigation. However, this short-term analysis does not hint at a greater risk for either future glucose intolerance or obesity for these children.