Changes of the growth plate in children: 3-dimensional magnetic resonance imaging analysis
Article information

Abstract
Purpose
This pilot study assessed changes in the growth plate and growth rates in children during a 6-month period.
Methods
The study included 31 healthy children (17 boys, 14 girls) under evaluation for growth retardation. Height, weight, bone age, insulin like growth factor-1 (IGF-1), and insulin like growth factor binding protein 3 (IGF-BP3) were measured at baseline and after 6 months. In addition, the diameter, thickness, and volume of the femoral and tibial growth plates were measured using magnetic resonance imaging.
Results
The mean bone age in boys and girls was 11.7 and 10.7 years, respectively. In boys, height (z score) (-0.2 vs. 0.0), weight (z score) (0.8 vs. 1.1), body mass index (BMI) (z score) (1.27 vs. 1.5), IGF-1 (ng/mL) (343.6 vs. 501.8), and IGF-BP3 (ng/mL) (5,088.5 vs. 5,620.0) were significantly higher after 6 months. In girls, height (z score) (-1.0 vs. -0.7), weight (z score) (-0.5 vs. 0.1), BMI (z score) (-0.02 vs. 0.3), IGF-1 (ng/mL) (329.3 vs. 524.6), and IGF-BP3 (ng/mL) (4,644.4 vs. 5,593.6) were also significantly higher after 6 months. In both sexes, the mean diameter and volume of the femoral and tibial growth plates were significantly increased 6 months later.
Conclusion
No significant correlation was found between changes in the growth plate and clinical parameters in children with growth retardation in this study, other than correlations of change in femoral diameter with weight and BMI. A larger, long-term study is needed to precisely evaluate the correlation between change in the growth plate and growth.
Introduction
The longitudinal growth of bones is mainly controlled by modification of the growth plate [1]. Most studies about growth plate were conducted with animals such as rats or rabbits. Known factors that influence bone growth rate are cell divisions and proliferations of growth plate cartilage, and synthesis and degradations of the matrix [2-4]. In addition, the height of the growth plate correlates with the corresponding growth rate in rats [5].
However, little information is available about the effects of the aforementioned factors on growth plate morphological change and their correlations to the human body growth. One study that examined how the size of the growth plate changes with age in pediatric patients reported that the growth plate area appeared to increase linearly with increasing age [6]. However, to the best of knowledge, no study has been conducted about time-varying changes in growth rate and growth plate in humans.
In the lower leg, the growth plates are located at the ends of the femur and tibia. The length of these 2 long bones is likely to constitute the largest portion of the longitudinal growth. We therefore assumed that changes in the growth plates of the femoral and tibial bones can be a barometer to estimate the growth of children, and we measured the diameter, thickness, and volume of the growth plate by using 3-dimensional magnetic resonance imaging (3D MRI).
Materials and methods
1. Subjects and ethical considerations
This study was conducted with 31 healthy children (17 boys and 14 girls) who visited with concern of growth retardation. Their mean age of the boys was 11.3 years (range, 9.1–10.2 years), and that of the girls was 10.5 years (range, 8.9–10.5 years). The mean bone age (BA) of the boys and girls were 11.7 and 10.7 years, respectively. Children with endocrine disease (growth hormone deficiency, hypothyroidism, etc.), chromosomal diseases, or history of trauma at the lower leg were excluded. Written informed consent was obtained from the parents or guardians of each subject and participant. The protocol was approved by the Eulji Medical Center Institutional Review Board (approval number: EUIACUC 12-27).
2. Study procedures
Height, weight, BA, insulin-like growth factor 1 (IGF-1) level, and insulin-like growth factor-binding protein 3 (IGF-BP3) level were measured at baseline and after 6 months. Height was measured 3 times to the first decimal place with a Harpenden stadiometer (Holtain Ltd., Crosswell, UK) and weight to the first decimal place with a digital scale (150A, Cas Co. Ltd., Seoul, Korea). BA was assessed by comparing the plain left-hand radiographs of patients. IGF-1 (Biosource, Nivelles, Belgium) and IGF-BP3 (Immunotech, Marseille, France) were measured. Tanner stage (TS) was measured by Marshall-Tanner method. All subjects showed TS 1 or TS2. MRI of the left knee was also conducted to measure the growth plate at baseline and after 6 months.
3. Magnetic resonance imaging
MRI studies were performed using the Skyra 3-T imaging system (Siemens Health Care, Erlangen, Germany). The children were examined in the supine position with a neutral knee position, using a phased-array knee coil. Sagittal and coronal T1-weighted volume-interpolated breath-hold examination (VIBE) images of the physes were obtained with a 14-cm field of view, matrix of 288×288, repetition time of 12.1 msec, echo time of 5.7 msec, flip angle of 10°, and slice thickness of 3 mm, with no interslice gap.
4. One-dimensional growth plate thickness and diameter measurement
Sagittal MRI with the most complete view of the posterior cruciate ligament was selected to measure the growth plate thickness and diameters of the distal femur and proximal tibia in 31 children. The perpendicular 1-dimensional (1D) femoral growth plate thickness was measured at the midway point. In the same image, the perpendicular 1D tibial growth plate thickness was also measured at the midway point, similar to that of the femur. The growth plate diameters of the femur and tibia were estimated on the same MRI (Fig. 1). All the values were measured by 2 independent radiologists who were blinded to the subject. Intraclass reliability was high (Data were not shown).
Thickness and diameter analysis of the growth plate. (A, B) On sagittal volume-interpolated breathhold examination magnetic resonance imaging of the knee, the horizontal lines represent the total length of the femoral and tibial growth plates. The thickness of the growth plate is represented by a vertical red line. The dotted lines are drawn to estimate the growth plate diameter.
5. Three-dimensional growth plate volumetric measurement
The growth plate volumes of the proximal femur and tibia were manually segmented on each sagittal magnetic resonance (MR) slice (Fig. 2), and the estimated volume of all the slices was added by using the Argus function software (version D13, Siemens Health Care, Erlangen, Germany). We included the cartilage of the tibial tuberosity in our models and measurements because of the difficulty of differentiating the site of the junction of the physeal and apophyseal cartilages in several MR slices. For accurate segmentation of the growth plate, particularly thin portions, sagittal MR images were compared side by side with the coronal MR images. The growth plate volume was measured 2 times. Identification of the growth plate on each sagittal or coronal MR image for each child was reviewed and revised by a senior radiologist.

Volumetric analysis of the growth plate. (A, B) The red-colored regions show high signal intensity in the growth plate of the femur and tibia using sagittal volume interpolated breath-hold examination magnetic resonance imaging of the knee.
6. Statistical analysis
For statistical analysis, IBM SPSS Statistics ver. 24.0 (IBM Co., Armonk, NY, USA) was used, and the results were expressed as mean±standard deviation. The mean values of age, BA, height, weight, BMI, IGF-1, and IGF-BP3 were compares between the boys and the girls by using a Student t test. The change in the values 6 months later were compared by using a paired t test. The correlation between the growth plate and clinical markers was assessed using the Pearson bivariate analysis. The interobserver variability of the 1D measurement of the growth plate was evaluated. All the tests were performed with results having P values of ≤0.05 considered statistically significant.
Results
1. Baseline clinical characteristics of the subjects
In boys, height (z score) (-0.2±1.1 vs. 0.0±1.1), weight (z score) (0.8±1.1 vs. 1.1±1.1), body mass index (z score) (1.27±1.03 vs. 1.5±0.9), IGF-1 (ng/mL) (343.6±122.1 vs. 501.8±182.6), and IGF-BP3 (ng/mL) (5,088.5±565.2 vs. 5,620.0±769.1) significantly increased after 6 months. In girls, height (z score) (-1.0±0.9 vs. -0.7±0.8), weight (z score) (-0.5±1.4 vs. 0.1±1.0), body mass index (z score) (-0.02±1.5 vs. 0.3±1.0), IGF-1 (ng/mL) (329.3±146.5 vs. 524.6±129.1), and IGF-BP3 (ng/mL) (4,644.4±614.0 vs. 5,593.6± 728.1) significantly increased after 6 months (Table 1).

Initial clinical characteristics compared with 6 months later
2. Changes of the growth plate
In the boys, the initial and 6-month mean diameters of the femoral growth plate were 30.0±3.0 mm and 31.0±3.0 mm, respectively. In the girls, the initial and 6-month mean diameters of the femoral growth plate were 29.8±2.8 mm and 30.3±2.5 mm, respectively. In both sexes, the mean diameter of the femoral growth plate was increased significantly 6 months later. The mean thickness of the femoral growth plate did not show significant changes in both sexes (Table 2).
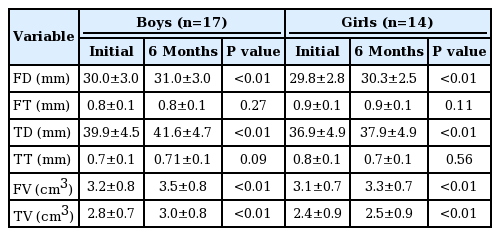
Changes in the growth plate
In the boys, the initial mean diameter of the tibial growth plate was increased from 39.9±4.5 to 41.6±4.7 mm 6 months later. In the girls, this increased from 36.9±4.9 to 37.9±4.9 mm. Similarly, to the thickness of the femoral growth plate, the thickness of the tibial growth plate was unchanged in both sexes after 6 months (Table 2).
3. Correlation between the changes of the growth plate and the clinical markers
Change in femoral growth plate diameter positively correlated with the changes in weight (r=0.45, P=0.023) and BMI (r=0.45, P=0.022). The change in femoral growth plate volume showed a weak correlation to the change in IGF-BP3 level. The other growth plate measurements did not significantly correlate with the clinical markers (Table 3).
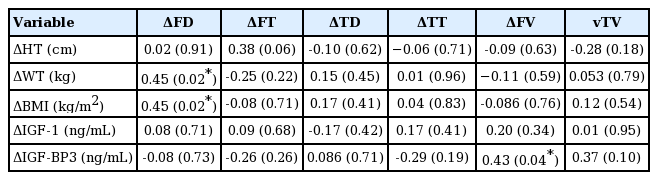
Pearson correlation analysis comparing changes in the growth plate and clinical markers
Discussion
In this study, the diameters and thicknesses of the growth plates of peripubertal children with growth retardation were measured at 6-month intervals under the assumptions that changes of the growth plate may reflect anthropometric or clinical parameters. As a result, the diameter of the growth plate increased, but the thickness of the growth plate was unchanged during 6 months in the boys and girls.
The aim of this study is to evaluate the correlation between the changes of the growth plate and height. However, we could not observed meaningful association. Only femoral growth plate diameter increased with increments in weight and BMI. The association between height and the changes of the growth plate was not statistically significant.
Longitudinal growth is the result of new bone formation during endochondral ossification, in which proliferation and differentiation of epiphyseal growth plate chondrocytes directly correlate with bone elongation [7,8]. The GH-IGF axis can stimulate proliferation of the resting zone chondrocytes and chondrocyte hypertrophy [9,10]. In the present study, no significant correlation was found between IGF-1 or IGF-BP3 level and the diameter and thickness of the growth plate.
One study [6] did not detect any difference attributable to sex in any parameters from the measurements of growth plate area and volume. The authors stated that both growth plate area and volume appeared to follow a linear increase with age. However, it was a cross-sectional study. We measured growth plate longitudinally, but we could not identify linear changes of the growth plate during just 6 months.
Another study reported a stronger positive correlation between body size, especially weight and BMI, and growth plate volume [11]. We obtained a similar result in this study. It is interesting that the thickness of both growth plates showed no changes while their diameters increased. However, this result is unreliable in that tibial growth plate thickness could not be measured clearly. Beacause tibial tuberosity was too thin and irregular to show any measurable change during 6 months.
Femur and tibia volumes were measured using MRI scans acquired with a 3D VIBE sequence without interslice gap, using a manual method. The advantages of this sequence include excellent contrast between cartilage and bone marrow, thin sections, and increased signal-to-noise ratio. In previous studies, the volumes of the growth plates of the femur and tibia were usually measured by using a semiautomated or manual method, in which a 3D model of the growth plate was manually reformatted from sagittal or coronal MR images and measurement was performed on an axial maximum intensity projection (MIP) view [11,12]. However, the MIP view essentially collapses the 3D data onto a 2-dimensional plane and the growth plate displays an irregular shape in a 3D model, making accurate measurement difficult. Therefore, this 3D modeling of the growth plate is not a perfect technique [12,13]. In this study, the measurement of the growth plate on each 3D MR image proved more accurate than that of the reformatted axial 3D modeling but was time consuming and required a well-trained operator. Thus, a direct supervision by an experienced radiologist during segmentation was required.
This study has several limitations. First, the number of study participants was small. Second, the interval between measurements was too short to evaluate changes of the growth plate. Third, the measurements of the changes of the tibial growth plate might not be reliable because of the difficulty to differentiate the site of the junction of the physeal and apophyseal cartilages. However, to our best knowledge, this study was the first study to evaluate changes in growth plate during growth. In addition, we measured the sizes of the Korean children’s growth plates.
In conclusion, this study aimed to measure changes of the growth plate and their correlations to the clinical parameters of growth by using MRI. We observed positive correlations of change in femoral diameter to weight and BMI only. A larger and long-term study is needed to precisely evaluate the correlation of changes of the growth plate to growth.
Notes
No potential conflict of interest relevant to this article was reported.
Acknowledgements
Authors thank Jong Moon Hahm, magnetic resonance application specialist and Won Hee Hong, magnetic resonance technologist for helpful measurement during analysis of the growth plate volume. This study was supported by EMBRI Grants 2012EMBRISN0002 from the Eulji University.