P wave dispersion on 12-lead electrocardiography in adolescents with neurocardiogenic syncope
Article information
Abstract
Purpose
Neurocardiogenic syncope (NCS) is the most frequent cause of fainting during adolescence. Inappropriate cardiovascular autonomic control may be responsible for this clinical event. The head-up tilt test has been considered a diagnostic standard, but it is cumbersome and has a high false-positive rate. We performed a study to evaluate whether P-wave dispersion (PWD) could be a useful electrocardiographic parameter of cardiac autonomic dysfunction in children with NCS.
Methods
Fifty-four patients with NCS (28 boys and 26 girls; mean age, 12.3±1.4 years) and 55 age- and sex-matched healthy controls were enrolled. PWD was obtained as the difference between maximum and minimum durations of the P wave on standard 12-lead electrocardiography in all patients and controls
Results
The value of PWD was significantly higher in the syncope group than in the control group (69.7±19.6 msec vs. 45.5±17.1 msec, respectively; P<0.001). The minimum duration of P wave was shorter in the syncope group than in the control group (43.8±16.8 msec vs. 53.5±10.7 msec, respectively; P<0.001). Left atrial volume was not different between the groups on transthoracic echocardiography
Conclusion
PWD on echocardiography could be used as a clinical parameter in patients with NCS.
Introduction
Syncope is a common clinical problem that accounts for 3% of emergency department patients and 1%–6% of inpatients1) thus, 15%–50% of children and adolescents experience syncope more than once in their lifetime2). Neurocardiogenic syncope (NCS), the most frequent fainting during adolescence, is characterized by a brief loss of consciousness with a prodrome in the presence of a trigger followed by spontaneous recovery3), normal physical examination and electrocardiogram (ECG).
The pathophysiology of NCS remains unclear45), inappropriate control of cardiac autonomic function has been considered to be responsible for this clinical event67). Head-up tilt test (HUTT) has been used as a clinical standard in the evaluation of NCS, but the procedure of this test is very cumbrous, and so pose a challenge in the acute setting. Moreover the reliability o-f this test has been questioned8).
P wave dispersion (PWD) is derived by subtracting the minimum P wave duration (Pmin) from the maximum P wave duration (Pmax) in any of the 12 ECG leads. PWD has proven to be a sensitive and specific ECG predictor in the assessment of the risk for atrial fibrillation in patients without apparent heart disease. Recently, PWD has been proposed as a clinical parameter in noncardiac diseases which is associated with autonomic dysregulation such as stroke9), diabetic autonomic neuropathy10), and sickle cell autonomic neuropathy. We hypothesized that the alteration of the neuro-hormonal milieu would affect P wave propagation in adolescents with NCS, thus we investigate the characteristics of the P wave in adolescents with NCS.
Materials and methods
1. Subjects
The patients with syncope were included if they met the following criteria:
(1) Typical NCS with careful history, comprehensive physical examination, and full neurological evaluation.
(2) Normal cardiac structure and function by transthoracic echocardiography.
(3) Positive HUTT result, which reproduced the NCS symptoms with evidence of hypotension and/or bradycardia.
The patients with a history of cardiologic or neurological diseases; psychiatric diseases; arrhythmia; and medications that could affect cardiac conduction velocity, heart rate, and blood pressure were excluded.
2. Head-up tilt test
We obtained written permission from parents of all participants in the study, the test was performed as a manner that recommend by European Society of Cardiology11). A positive response of HUTT was defined as syncope or severe presyncope (state of light-headedness associated with at least one of the following symptoms: partial loss of postural tone, decreased vision, slow response to verbal stimuli, or nausea) accompanied by marked hypotension (systolic blood pressure fall >20 mmHg) or bradycardia <40 bpm or both. The positive tests were classified as a cardio-inhibitory, vaso-depressive, or mixed reaction according to a proposal by Moya et al.11).
3. Left atrial volume
Transthoracic echocardiography was performed in all patients and controls by using a Vivid E9 (GE Healthcare, Munich, Germany) with 5- and 3.5-MHz phased-array transducer. Comprehensive echocardiographic examination was performed to make sure of normal cardiac anatomy and function in all patients and controls. Measurement of left atrial (LA) volume from the area-length method using the apical 4-chamber views and 2-chamber views at ventricular end systole.
4. Electrocardiographic measurements
Twelve-lead ECG was performed in both syncope and control groups. ECG was recorded after the patients were stabilized for a minimum duration of 10 minutes in the supine position in a quiet room; the patients were requested not to talk and breathe comfortably during the test. ECG was performed, the findings were recorded on paper at a velocity of 1 mV/cm (25 mm/sec) and were digitized simultaneously by using the GE MAC5K V008A (GE Healthcare) system. The ECG parameters were measured by magnifying the stored digitized ECG data by three times on a high-resolution computer screen. Pmax and Pmin were calculated from the standard ECG during sinus rhythm. The P wave duration is the time between the onset and endpoint of a P wave; P wave onset is defined as the point where an isoelectric line meets the onset of deflection and P wave endpoint is defined as the point where an isoelectric line meets the endpoint of deflection. PWD is the time difference between the Pmax and Pmin, and is expressed in milliseconds. If baseline noise was >10 µV or the P wave amplitude was <15 µV from the isoelectric line, the corresponding electrodes were excluded from analyses; moreover, if data from fewer than 9 electrodes from among the 12 ECG electrodes were eligible, data from that ECG scan were excluded
Intraobserver and interobserver coefficients of variation (standard deviation of differences between 2 observations divided by the mean value and expressed as percent) were found to be 4.6% and 4.9% for Pmax, and for Pmin were 4.1% and 4.7%, respectively from the analyses.
5. Statistical analysis
Statistical analyses were performed using the IBM SPSS ver. 18.0 (IBM Co., Armonk, NY, USA). Mean, standard deviation, median, and minimum/maximum values are given. We used the Shapiro-Wilk and Kolmogorov-Smirnov tests were to verify normal distributions. Data with normal distributions were tested by parametric tests, whereas non-normally distributed data were tested using nonparametric tests. For group comparisons, Student t test, the Mann-Whitney U test, and the Kruskal-Wallis test were used. Data are expressed as means±standard deviation for normal distributions and as medians (range) for nonnormal distributions. Statistical significance was accepted at P<0.05.
Results
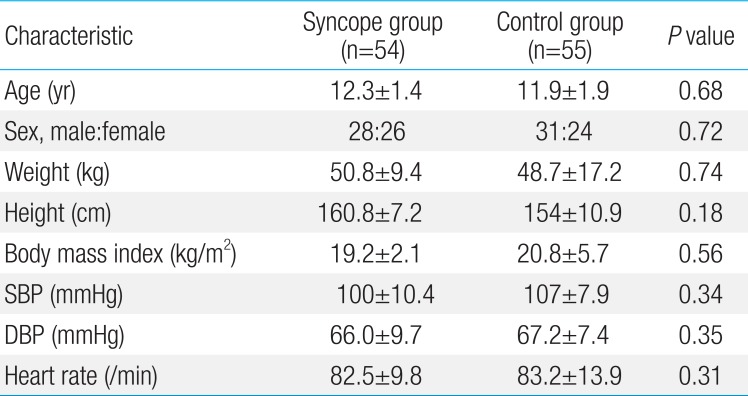
The subjects’ ages ranged from 10 to 14 years, and mean values were 12.0 years for the study group and 11.9 years for the control group. There were 28 boys and 26 girls in syncope group and 31 boys and 24 female girls in control group. There were no differences in age, sex, body weight, height, blood pressure, and pulse rate between syncope and control group (Table 1). Twenty-nine (53%) of the patients experienced syncope for the first time, the second episodes in 16 patients (29%), the third episodes in three patients, and the fourth episodes in only 1 patient, respectively.

Clinical characteristics of patients with syncope and controls
Pmin was 43.8±16.8 msec and 53.5±10.7 msec in syncope and control group, respectively (P<0.05). PWD was 69.7±19.6 msec in syncope group and 45.5±17.1 msec in control group (P<0.05). However, the other ECG parameters did not differ between the groups (Table 2).

Electrocardiographic parameters of patients with syncope and controls
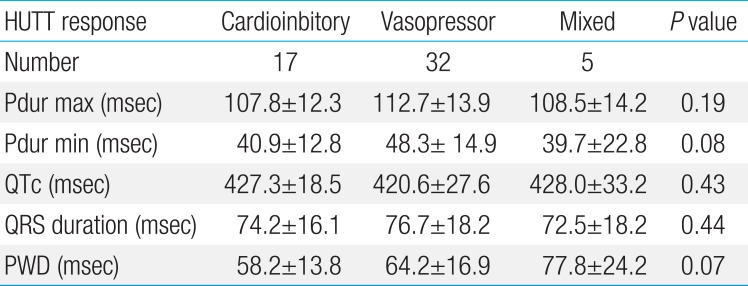
The most common response type upon HUTT was vaso-depressive at 59% (32 of 54), followed by cardio-inhibitory at 31% (17 of 54) and mixed at 9% (5 of 54). No significant difference in age, gender, body weight, height, blood pressure, and pulse rate was observed according to the type of HUTT response. Moreover, the ECG parameters including PWD did not significantly differ among the subgroups (Table 3).

ECG parameters of subgroups of patients with syncope, according to HUTT
LA volume index was 34±14 mL/m2, 35±12 mL/m2 in syncope and control group respectively. There was no difference in the measurement in both groups (Fig. 1).
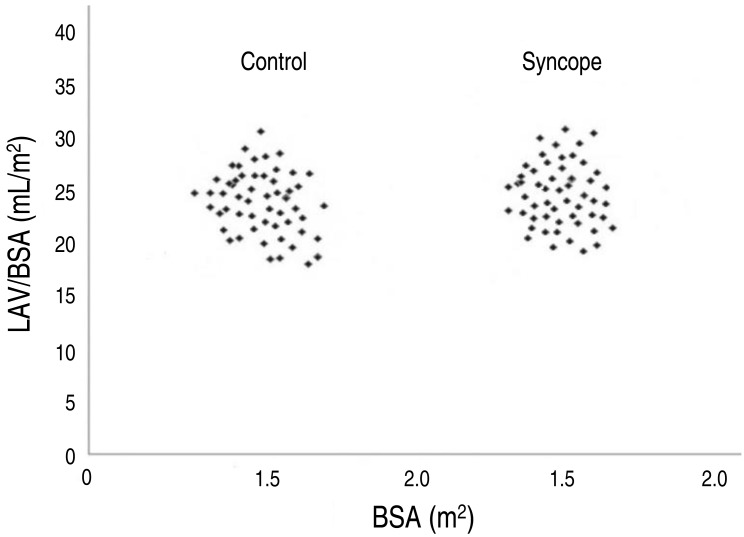
Left atrial volume index (LAV/BSA) from the area-length method using apical 4-chamber views and 2-chamber views at ventricular end-systole in the syncope and control groups. LAV, left atrial volume; BSA, body surface area.
Discussion
Blood pressure is controlled by rapid response of the cardiovascular system to gravity changes and via neuro-hormonal adaptive processes. Although the mechanism of the NCS remains unclear, it has been reported to be related to the inappropriate secretion of epinephrine, renin, vasopressin, serotonin, endothelin, or endogenous opioid peptide, which are involved in blood pressure control12). HUTT has been used to uncover the abnormalities of the adaptive responses to orthostasis in patients with NCS, but the sensitivity of this test was uncertain. Furthermore, negative HUTT response does not exclude the diagnosis of NCS.
Several researches have been studying the clinical indicators associated with the autonomic nervous system in patients with NCS. Longin et al.6) reported that heart rate variability could be a useful clinical tool in patients with NCS. Sehra et al.13) also revealed autonomic imbalance in pediatric patients with NCS through an analysis of heart rate variability.
PWD has been used to predict the development of atrial arrhythmia in adult without apparent heart disease1415). The term dispersion in the context of P wave indices describes atrial conduction and may be influenced by LA size. We measured the LA volume from the area-length method in syncope and control group. The Guidelines and Standards Committee of the American Society of Echocardiography took the position that biplane volume determination are preferable for measurement of LA size in clinical practice16). LA size was not different in both groups.
Mohamed et al.17) revealed that body mass index (BMI) and systolic blood pressure are independently associated with PWD in patients with obstructive sleep apnea. There was no difference in BMI of syncope and control group.
We measured the ECG parameters by magnifying the stored digitized ECG data by 3 times on a high-resolution computer screen. The measurement of P wave duration using a ruler on paper with standard 12-lead ECG is associated with several limitations of accuracy and productivity. Therefore, the use of software with digitized ECG data on a high-resolution computer screen may offer more advantages in terms of accuracy and productivity1011).
Autonomic tone may alter the duration of the P wave by affecting atrial conduction velocity. In our study, Pmin was significantly shorter and PWD was prolonged in syncope group as compared to that in the control group. There is one study published in the literature about this subject that was designed by Köse et al.18) In this study, Pmax and PWD of HUTT positive patients were significantly greater than those in the HUTT negative and control groups. There are a lot of evidences that increased sympathetic activation might important role in earlier phase of NCS1920). According to earlier studies, β-adrenergic stimulation reduce P wave duration and β-blocker increase P wave duration21). Tükek et al.22) revealed that increased vagal tone during last phase of Valsalva maneuver made the values of Pmax and PWD decrease but Pmin increase. We inferred that a reduction of Pmin and increase of PWD in our study may be associated with increased sympathetic tone. However, we thought further investigation and discussion is needed about the changes of P wave indices.
In the present study, we noted that PWD was longer at the baseline ECG in children with NCS; we suspect that this finding can offer some insight into the pathological mechanism of NCS and that PWD can also be used as a clinical indicator.
Nevertheless, this study had certain limitations. The number of study subjects was small. Moreover, a comprehensive study regarding the factors that can affect P wave, such as serum electrolyte, neurohormonal levels, and pulmonary capillary wedge pressure will be needed to clarify the pathophysiology of NCS
Notes
Conflicts of interest: No potential conflict of interest relevant to this article was reported.