


Introduction
Kawasaki disease (KD) is an acute systemic vasculitis occurring in infants and children. Approximately 3%–5% of the afflicted children develop coronary artery lesions (CALs) despite treatment with intravenous immunoglobulin (IVIG)1,2). Numerous studies have aimed at early identification of the disease by measuring clinical and serological factors of patients at risk of developing CALs3).
Additionally, following the initial treatment, approximately 10%–20% of the patients with KD show resistance to IVIG4,5). Because prolonged fever can lead to increased incidence of CALs in patients with KD6), identification of patients at risk of developing IVIG resistance, allowing potential early therapeutic interventions, would be beneficial for the prognosis of patients with KD. Scoring systems developed to predict IVIG resistance in patients with KD have been reported, but their usefulness is limited owing to their relatively low sensitivity7,8).
In the acute stage of KD, the number of peripheral blood CD14+ monocytes increases9). Immunopathogenesis of KD involves systemic inflammation, and activated monocytes have an important role in the production of proinflammatory cytokines, such as tumor necrosis factor alpha (TNF-α) and interleukins 1β and 6 (IL-1β and IL-6, respectively)9,10,11). Activation of CD14+ monocytes initiates the activation of Toll-like receptors (TLRs), which are coreceptors of CD14 expressed on monocytes12). Activation of TLRs can trigger activation of nuclear factor-kappa B (NF-κB), the ubiquitous transcription factor that controls production of TNF-α, IL-1β, and IL-6, leading to a massive systemic immune response and causing high fever12,13,14,15). Among the TLRs, the role of TLR2 in CAL development in KD has been previously studied using a mouse model of coronary arteritis16,17). By using the Lactobacillus casei cell wall extract (LCCWE)-induced mouse model of coronary arteritis, it has been shown that via TLR2 pathway, along with myeloid differentiating factor 88, the macrophages and dendritic cells are activated by LCCWE16), resulting in the production of inflammatory cytokines, such as IL-1β18).
Activation of TLR2 can trigger production of IL-10, an anti-inflammatory as well as a proinflammatory cytokine with regulatory properties, which is involved in the inhibition of monocyte and macrophage replication19). However, increased serum level of IL-10 (sIL-10) in patients with KD has been correlated with CAL development in the acute stage of the disease, and it is also considered an indicator of IVIG resistance20,21). To date, the role of sIL-10 in KD has not been as extensively studied as the role of TNF-α, IL-1β, or IL-6.
Based on these findings, in this study, we aimed to determine the clinical usefulness of measuring the frequency of circulating TLR2+/CD14+ monocytes (FTLR2%) in predicting CAL development and IVIG treatment resistance as well as to compare it to the usefulness of sIL-10.
Materials and methods
1. Study population
Thirty-one children diagnosed with KD at CHA University Bundang Medical Center, between November 2007 and November 2008, were enrolled in this study. All enrolled patients met the following criteria for complete KD: fever and at least 4 of the following 5 clinical symptoms—rash, conjunctival injection, cervical lymphadenopathy, changes in the oral mucosa, and changes in the extremities; or fever and 3 of the above clinical symptoms plus coronary artery abnormalities (dilatation or aneurysm) documented by echocardiography4). Children who presented with incomplete KD were excluded from our study. To exclude other febrile illnesses resembling KD, we determined the serum titers of antistreptolysin O, anti-Epstein-Barr viral, antimumps viral, and antimycoplasma antibodies in all samples from patients with KD. Furthermore, we performed multiplex polymerase chain reaction on nasopharyngeal aspirates taken from patients with KD, for common respiratory viruses (adenovirus, respiratory syncytial virus, parainfluenza virus, influenza virus, metapneumovirus, coronavirus, and rhinovirus). We also performed neck ultrasonography on these patients to rule out suppurative lymphadenitis. All patients received 2 g/kg IVIG in a single dose at the time of diagnosis and were treated with high doses of oral aspirin (80 mg/kg/day), until they became afebrile for 3 to 4 days, as specified in the 2004 American Heart Association guidelines4). Afterwards, they were given low doses of aspirin (5 mg/kg/day). Serial echocardiography was performed on all patients with KD at the time of diagnosis and 1 month later, to study CAL development in the acute stage of KD. Echocardiography was conducted on all patients by a single cardiologist to evaluate the presence of structural heart diseases as well as to obtain M-mode echocardiographic parameters, including left ventricular end-diastolic dimensions (LVEDD), left ventricular end-systolic dimensions (LVESD), and fractional shortening (FS). We measured the internal diameter of the proximal right coronary artery (RCA) and proximal left anterior descending coronary artery (LAD) to classify patients with CAL development (CAL (+)) and those who without CAL development (CAL (−)). We did not include the measurements of the left main coronary arteries (LMCAs), as normal anatomic variations in LMCAs have been reported to be frequent, and the probability of isolated dilatation of LMCA without accompanying dilatation of LAD has been reported to be low22). The z scores of coronary arteries were obtained using RCA and LAD measurements as well as the nonlinear regression equations based on the body surface area (BSA)22). To calculate the z scores of RCA and LAD measurements, we derived the predicted values of RCA and LAD measurements for a patient with a given BSA using the following regression equations, reported by McCrindle et al.22):
Predicted value of LAD = 0.26108 × (BSA0.37893) − 0.02852
Standard deviation of LAD = 0.01465 + (0.01996 × BSA)
Predicted value of RCA = 0.26117 × (BSA0.39992) − 0.02756
Standard deviation of RCA = 0.02407 + (0.01597 × BSA)
The z scores were calculated by dividing the differences between the actual measurements of RCA and LAD and the corresponding predicted values by the corresponding standard deviations, as described by McCrindle et al.22).
CAL (+) patients had dilated (2.5 ≤z score<4.0) or aneurysmal (focal or diffuse dilatation of a coronary artery segment with z score ≥4.0) coronary arteries, based on the maximal internal diameters of the RCA and LAD one month after the initial diagnosis. CAL (−) patients had normal (z score <2.5) coronary arteries one month after the initial diagnosis4).
Patients were defined as IVIG nonresponders if they had a persistent or recrudescent fever after ≥48 hours of completion of initial IVIG infusion5).
Twenty-one children with no history of KD, autoimmune, or allergic diseases, who were admitted for treatment of common febrile illness, such as pneumonia, gastroenteritis, or urinary tract infection, were included as febrile controls (FCs).
Demographic variables followed were age, sex, duration of fever before and after the initial treatment, prevalence of CAL (+), and resistance to IVIG.
2. Blood samples and laboratory tests
Venous blood samples were taken from FCs on admission and from patients with KD before initial IVIG treatment (i.e., on days 4 to 8 of the illness) and 7 days after the IVIG treatment. The day of onset of fever was determined as the day one of illness.
White blood cell counts and serum levels of hemoglobin, albumin, aspartate aminotransferase, alanine aminotransferase, and C-reactive protein were determined before IVIG treatment in patients with KD and FCs. Serum samples were stored at −80℃ until the analyses.
3. Flow cytometry analysis
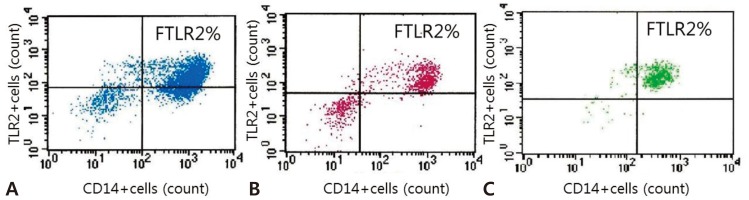
Whole blood samples were taken from FCs on admission and from patients with KD before initial IVIG treatment (i.e., on days 4 to 8 of the illness) and 7 days after IVIG treatment. Fresh 50-µL aliquots of whole blood samples in Falcon polystyrene tubes (Becton Dickinson, Lincoln Park, NJ, USA) were incubated with APC-conjugated anti-human CD14 and FITC-conjugated anti-human TLR2 monoclonal antibodies (eBioscience, San Diego, CA, USA). Isotype matched monoclonal antibodies (eBioscience) were used as controls. After the incubation, red blood cells were lysed, washed with cold phosphate-buffered saline, and fixed with 1% paraformaldehyde. Total 50,000 cells were counted from each sample, and after appropriate gating, monocyte population was identified as CD14+ cells in the scatter diagrams. FTLR2% was analyzed by BD FACScan (Immunocytometry Systems, San Jose, CA, USA), using CellQuest software.
4. IL-10 enzyme-linked immunosorbent assay
IL-10 serum concentrations were determined using enzyme-linked immunosorbent assay kits (R&D Systems Co., Minneapolis, MN, USA). Briefly, we used the quantitative sandwich enzyme immunoassay technique. To a microplate precoated with human IL-0-specific monoclonal antibodies, a buffered protein base, standard, control, and samples were added per well. After incubation and washing with wash buffer, human IL-10 conjugate was added and incubated. After another washing, substrate solution was added, and when the color in the wells turned from blue to yellow, the optical density of the wells was determined using a microplate reader (R&D Systems Co.), according to the manufacturer's instructions.
5. Ethics
All procedures involving human participants performed in this study were in accordance with the ethical standards of the Institutional Review Board of CHA University Bundang Medical Center as well as the 1964 Helsinki declaration and its later amendments or comparable ethical standards. The parents or guardians of all children participating in this study provided written informed consent, which was approved by the Ethics Committee of the CHA University Bundang Medical Center.
6. Statistical analysis
Values are expressed as mean±standard deviation, or where appropriate, as percentage. Comparisons between variables were made using the Mann-Whitney U test for continuous variables and the chi-square test for categorical variables. Correlation analysis was performed using the Spearman coefficient. To determine the cutoff value of FTLR2% in predicting CAL development and IVIG resistance, receiver operating characteristic (ROC) curve analysis was performed. All statistical analyses were done using IBM SPSS Statistics ver. 20.0 (IBM Co., Armonk, NY, USA). A P value of <0.05 was considered statistically significant.
Results
1. Clinical characteristics and laboratory data
We studied the clinical characteristics of 31 patients with KD and 21 age-matched FCs (Tables 1, 2). In patients with KD, the day of onset of fever was designated as the day one of illness.
Eleven patients with KD developed CALs 1 month after the initial diagnosis and 10 patients were IVIG nonresponders. Patients with CALs at the time of initial diagnosis, but whose coronary z scores normalized after 1 month, were considered to have transient lesions and were categorized under the CAL (−) group, according to the method previously proposed by Yoshimura et al.2) in their study correlating N-terminal pro-brain natriuretic peptide, CALs, and IVIG resistance in the acute stage of KD. The percentage of IVIG nonresponders did not significantly differ between the CAL (+) and CAL (−) groups (3 out of 11 patients, 27.3%, versus 7 out of 20 patients, 35%, respectively). The percentage of CAL (+) patients was not significantly different between IVIG nonresponders and IVIG responders (3 out of 10, 30%, versus 8 out of 21, 38.1%, respectively).
Echocardiography of all patients with KD revealed no significant structural heart defects, except for a small, hemodynamically insignificant patent foramen ovale in one patient. Small amount of mitral regurgitation was noticed in four patients with KD (3 in the CAL (+) group and 1 in the CAL (−) group), but they were considered hemodynamically insignificant.
No significant difference in LVEDD, LVESD, and FS was found between the CAL (+) and CAL (−) groups, and between the IVIG nonresponders and IVIG responders (Table 3).
Of the parameters previously determined to be correlated with the increased risk of developing CALs (i.e., age, duration of fever, white blood cell count, serum albumin, and C-reactive protein)6), none were statistically different between the CAL (+) and CAL (−) groups.
As predicted, duration of fever after IVIG treatment was significantly longer in the IVIG nonresponders compared to that in the IVIG responders. Among the parameters that have previously been found to correlate with the risk of IVIG resistance5,7,8), the levels of serum hemoglobin and alanine aminotransferase were significantly higher in the IVIG nonresponders compared with those in the IVIG responders.
3. FTLR2% and IVIG resistance
FTLR2% before the initial treatment was usually increased in IVIG nonresponders compared to that in the IVIG responders, but there was no statistically significant difference between the two groups (91.88%±5.81% vs. 80.30%±17.11%, respectively; P>0.05) (Table 4).
4. Correlation between FTLR2% and sIL-10
As shown in Table 4, there were no significant differences in sIL-10 before the initial treatment, between patients with KD and the FC group or between the CAL (+) and CAL (−) groups of patients with KD. sIL-10 before the initial treatment was usually higher in IVIG nonresponders compared with that in the IVIG responders, but the results were not statistically significant. Additionally, FTLR2% in patients with KD did not correlate significantly with sIL-10.
5. Correlation between FTLR2% or sIL-10 and other risk factors that influence CAL development and IVIG resistance
FTLR2% and sIL-10 in patients with KD did not correlate significantly with previously determined risk factors of CAL development6,23) or with the known predictors of IVIG resistance7,8). Additionally, FTLR2% and sIL-10 in these patients did not correlate significantly with echocardiographic variables such as LVEDD, LVESD, or FS.
6. Usefulness of the cutoff values of FTLR2% and sIL-10 in predicting CAL development and IVIG resistance
The cutoff values of FTLR2% and sIL-10 for predicting CAL (+) were obtained from the ROC curve, and the areas under the curve were 0.779 and 0.558, respectively. An FTLR2% cutoff value of 92.62% predicted CAL (+) with an 80% sensitivity and 68.4% specificity, whereas a sIL-10 cutoff value of 15.52 pg/mL predicted CAL (+) with a 40% sensitivity and 73.7% specificity.
The areas under the ROC curves, for identifying IVIG nonresponders using FTLR2% and sIL-10, were 0.746 and 0.841, respectively. An FTLR2% cutoff value of 94.61% predicted IVIG resistance with a 66.7% sensitivity and 71.4% specificity, whereas a sIL-10 cutoff value of 15.52 pg/mL predicted IVIG resistance with a 66.7% sensitivity and 76.2% specificity.
Discussion
This study showed that FTLR2% before the initial treatment of patients with KD was significantly high in the CAL (+) group than that in the CAL (−) group, and this was a more sensitive, predictive parameter for CALs than sIL-10. Furthermore, FTLR2% tended to be higher in IVIG nonresponders compared to that in the IVIG responders, and this frequency could predict IVIG resistance with a sensitivity comparable to that of sIL-10. To the best of our knowledge, our study is the first clinical study to utilize FTLR2% to predict CAL development and IVIG resistance in patients with KD and to compare its feasibility with that of sIL-10.
Previous studies on TLRs in KD have focused on the feasibility of coronary arteritis animal model in elucidating the pathophysiologic mechanisms involved in CAL development in KD in humans16) or elevated levels of TLRs in KD regardless of the CAL status24). The role of TLR2 expression in CAL development in KD has been studied using a coronary arteritis mouse model induced with LCCWE, and TLR2 was shown to be involved in inducing focal coronary arteritis16). The feasibility of the LCCWE mouse model, in representing the mechanisms of TLR activity in patients with KD, was investigated by Lin et al.24), who reported that both patients with KD and LCCWE mouse model developed similar cardiac lesions as well as coronary arteritis and that a similar pattern of cytokine increase was noted, such as elevation in sIL-10 and TNF-α in the acute phase of KD in both patients with KD and LCCWE mouse model. This report also showed that in both patients with KD before IVIG treatment and LCCWE mouse model, the surface expression of TLR2 on circulating CD14+ monocytes was increased. This agrees with our results that show increased FTLR2% in the CAL (+) group compared to that in the CAL (−) group. However, in their study, Lin et al.24) did not investigate the correlation between TLR expression levels and CAL development or IVIG resistance.
Moreover, activation of TLR2 may be an early upstream response preceding the production of proinflammatory cytokines, e.g., TNF-α and IL-1β, which have been shown to be important in CAL pathogenesis12,18,25). As there may be a time lag between TLR2 activation and the subsequent production of proinflammatory cytokines, monitoring FTLR2% could potentially be used as a relatively early predictor of CAL development, before the elevation of serum cytokine levels becomes clinically apparent.
Evidence of the usefulness of TLR expression in monitoring cardiovascular disease burden and severity can be found in the study by Methe et al.26), who showed that increased TLR expression levels are involved in the progression of atherosclerotic lesions, demonstrating the expansion of circulating TLR4+ monocytes in patients with acute coronary syndrome26). We suggest, based on our results and the results of Methe et al.26), that TLR expression levels could be used to monitor cardiovascular disease burden and severity of KD. Additionally, using whole blood to measure TLR expression requires relatively few steps, suggesting TLR as a potentially easy-to-use biomarker.
Our results showed that FTLR2% before the initial treatment is a more sensitive predictor of CAL development than sIL-10 in patients with KD. sIL-10 before treatment was shown to be elevated in patients with acute-stage KD, and its cutoff values for the prediction of CAL development and IVIG resistance have been previously proposed27). We found that sIL-10 before treatment in the CAL (+) group was not significantly higher than that in the CAL (−) group. The reason for this finding might be that, in our study, patients belonging to the CAL (+) group were those that had developed CALs at one month after diagnosis. High sIL-10 at the acute stage of KD might have had a cumulative beneficial effect on the inflammation of the coronaries past the acute stage of KD, as IL-10 is known to have both anti-inflammatory and proinflammatory properties19,20).
In our study, FTLR2% before initial treatment in IVIG nonresponders tended to be higher than that in the IVIG responders. Additionally, our results showed that sensitivity in predicting IVIG resistance in patients with KD was comparable between FTLR2% before initial treatment and sIL-10. One of the numerous mechanisms of action of IVIG in KD is the inhibition of NF-κB activation in CD14+ macrophages and monocytes after IVIG therapy28). Because NF-κB is involved in the downstream TLR signaling pathway, this may indicate that in IVIG nonresponders, the increased FTLR2% before the initial treatment would lead to increased activation of NF-κB, thus requiring additional treatment with IVIG, but further studies are needed to confirm this. In addition to the known predictive markers of IVIG resistance7,8), monitoring FTLR2% could be useful in predicting IVIG resistance in patients with KD. Early identification of patients at risk of CAL development and IVIG resistance, by monitoring FTLR2%, could supplement existing guidelines for additional intensive treatment strategies, such as the early combination of corticosteroid therapy in addition to the initial IVIG treatment as proposed by Kobayashi et al.7), early in the course of KD.
FTLR2% and sIL-10 before the initial treatment did not correlate significantly with LVEDD, LVESD, or FS. Our findings are in line with the previously reported results that showed no consistent association between left ventricular (LV) function in patients with KD and laboratory indices of systemic inflammation29). It is possible that more sensitive methods for the assessment of LV function, such as LV longitudinal strain that is known to be correlated with serum albumin levels in patients with KD30), could also potentially correlate with FTLR2%.
The inclusion of a relatively small number of patients in these investigations presents a limitation of our study, which might affect the results of our statistical analyses and lead to difficulties in showing the correlation between FTLR2% or sIL-10 and the previously determined risk factors of CAL development and IVIG resistance. Another limitation might be the relatively short-term follow-up of our patients, as CALs can form after 1 month of onset of the disease. Additionally, as this was a prospective study, the FTLR2% and sIL-10 before the initial treatment could have affected the subsequent results of the echocardiograms taken 1 month later. Moreover, the regulation and interaction of TLRs and inflammatory cytokines occur in a complex manner12); therefore, further studies are needed to elucidate how FTLR2% and sIL-10 correlate. We did not separate monocytes from the whole blood in our study, therefore a small number of cells other than monocytes may have been analyzed. However, in accordance with the aim of this study, that is to establish FTLR2% as a potential marker of KD severity and prognosis, we thought that the use of whole blood samples served as an easier and more appropriate approach. Furthermore, the CAL (−) group showed increased FTLR2% after the initial treatment compared to the CAL (+) group. We propose that, with time, other endogenous TLR2 ligands might be responsible for the delayed stimulation of TLR2, in addition to the initial stimulus responsible for the early activation12). This finding may limit the use of FTLR2% as a prognostic parameter after the initial treatment. Our study focused on the acute changes in CALs in KD at disease onset, so further long-term follow-up studies will be needed to elucidate the long-term effects of TLR2 on coronary arteries in KD. Additional investigations of ligands capable of TLR2 activation in KD would be helpful.
In conclusion, we showed that measurement of FTLR2% before the initial treatment could be useful as a predictive marker of CALs in patients with KD, with better sensitivity than sIL-10. Our results demonstrated that FTLR2% before the initial treatment could also predict IVIG resistance with sensitivity comparable to that of sIL-10. Further studies involving a larger number of patients with KD are needed to validate FTLR2% as a marker of prognosis and severity of KD.
 PDF Links
 PubReader
 ePub Link
 PubMed
 Download Citation


