Warning: fopen(/home/virtual/pediatrics/journal/upload/ip_log/ip_log_2024-04.txt) [function.fopen]: failed to open stream: Permission denied in /home/virtual/pediatrics/journal/ip_info/view_data.php on line 82

Warning: fwrite(): supplied argument is not a valid stream resource in /home/virtual/pediatrics/journal/ip_info/view_data.php on line 83
Dietary intake and nutritional status of Korean children and adolescents: a review of national survey data

Volume 64(9); September

< Previous     Next >

Article Contents

Clin Exp Pediatr > Volume 64(9); 2021
Kang, Choi, and Jung: Dietary intake and nutritional status of Korean children and adolescents: a review of national survey data

Abstract

In Korea, several national cross-sectional surveys monitor the diet, nutritional status, and health status of children. This continual dedicated national surveillance system contributes to the identification of nutritional and health issues, establishment of public health policies, and development of nutrition recommendations. This paper provides recent information about the Korea National Health and Nutrition Examination Survey and the Korean Youth Risk Behavior Web-based Survey and describes key nationwide survey findings published in the last 5 years on infant feeding practices and the dietary intake and nutritional status of Korean infants, children, and adolescents. There have been increasing trends in children, and teenagers who skip breakfast, eat fast food, consume sugary drinks, have vitamin D deficiency, and are obese. This review will inform pediatricians, nutritionists, and other health care practitioners who track children’s growth and development. It may also help researchers and policymakers identify diet-related policies and strategies for chronic disease prevention in Korean infants, children, and adolescents.

Graphical abstract

Introduction

The field of pediatrics is dedicated to all aspects of the care and well-being of infants, children, and adolescents. Because children cannot advocate for themselves, pediatricians and government policymakers must be concerned with specific diseases as well as the environmental, psychosocial, cultural, and political influences that affect the health of children and their families [1]. Among these factors, managing nutrition is important to helping infants, children, and adolescents maintain a healthy weight and supporting their normal growth and development [2]. Their dietary intake must meet their energy requirements and provide the essential macro- and micronutrients required to sustain their vital processes. Nutrient deficiencies can limit growth and impair immune function and neurodevelopment. Nutrition and dietary intake patterns can also determine adult body composition, affecting the risk of chronic disease development [3].
Food consumption and dietary practices have recently changed in Asian countries [4]. National nutrition and health surveys with various periods and items have been conducted by governmental agencies in 15 Asian countries [5]. In Korea, several national cross-sectional nutrition surveys monitor children’s health data and environmental factors to discern their diet, nutritional status, and chronic disease burden [6]. A continuous dedicated national nutritional surveillance system could identify nutritional and health issues, help establish public health policies, and inform the development of nutritional recommendations.
To achieve a comprehensive understanding of the current nutritional research findings, this review focuses on the nutrition and dietary items in the Korea National Health and Nutrition Examination Survey (KNHANES) and the Korean Youth Risk Behavior Web-based Survey (KYRBS). We reviewed articles published in the last 5 years that reference survey data regarding nutritional status, dietary intake, and the association between diet and chronic diseases in infants, children, and adolescents. Our results will help pediatricians and other health care providers in monitoring children’s growth and development and providing consultation to children and their caregivers.

National surveys in Korea

1. Korea National Health and Nutrition Examination Survey

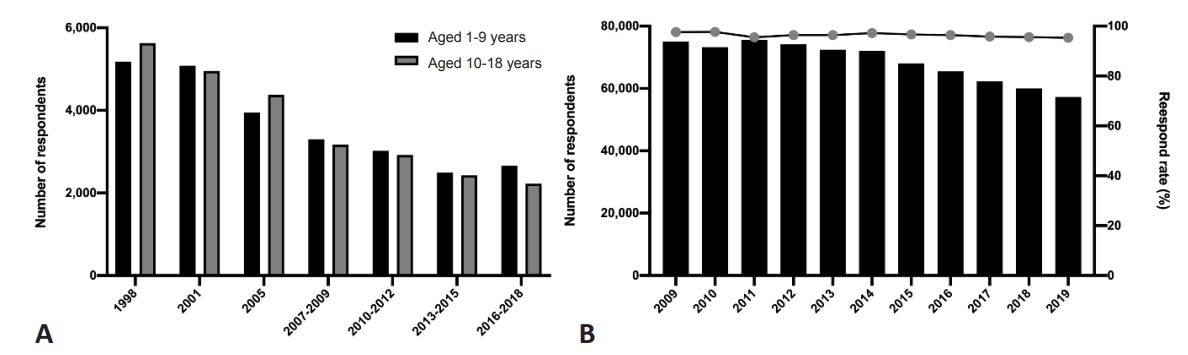
The KNHANES is a national survey that has monitored the health and nutritional status of adults and children in Korea since 1998 [7]. Its objective is to provide reliable nationally representative data on the health status, health behaviors, and food and nutrient intake of Koreans, thereby establishing a foundation for comprehensive national health promotion plans and programs [8]. The KNHANES was conducted every 3 years from the first period (1998) to the third period (2005) and has since become an annual survey system that has been conducted from the fourth period (2007–2009) to the present (Fig. 1A). This national survey was approved by the Research Ethics Review Committee of the Korea Centers for Disease Control and Prevention (KCDC). Stratified multistage cluster sampling and the rollingsampling method are used to ensure that each annual survey is representative of the overall Korean population [9]. The primary sample units (PSUs) are chosen from a sampling frame for all census or resident registration addresses. Each PSU consists of 50–60 households. After PSU selection, all housing units in the PSU were identified, and 20 households were selected for household screening by field surveys. In each household, all members older than 1 year were selected to participate in the final selection stage [9]. The KCDC publishes Korea health statistics annually, and the data are publicly accessible on the KNHANES website (http://knhanes.cdc.go.kr). Because the survey items differ among age groups, this review summarizes only the items for children and adolescents (Table 1). In addition, Table 2 shows the survey items (KNAHES VII [2016–2018]) [10] related to nutrition for children and adolescents.

2. Korean Youth Risk Behavior Web-based Survey

The KYRBS was established by the Korean Ministry of Education, Ministry of Health and Welfare, and the KCDC in 2005 (Fig. 1B) [11]. This annual school-based national cross-sectional survey monitors health-risk behaviors associated with noncommunicable diseases and unintentional injuries among Korean adolescents [12]. The KYRBS aims to provide data for the development of school health policies in Korea. A stratified multistage cluster sampling design was used to ensure a nationally representative sample of middle- and high-school students. The questionnaire contains 16 items about health-risk-related behaviors: dietary patterns, socioeconomic status, obesity and weight control efforts, mental health, oral health, personal hygiene, physical activity, injuries and safety awareness, violence, drinking, tobacco use, sexual behavior, drug use, allergic diseases (atopic dermatitis [AD] and asthma), internet addiction, and subjective health status (Table 1). The survey items related to nutrition consisted of dietary behaviors, nutritional education, and intake frequency of fruits, soda, highly caffeine beverages, sugary beverages, fast foods, vegetables, white or processed milk, dairy products (yogurt, cheese), and meals obtained at convenience stores (Table 2). Survey data are available to the public on the website (https://www.cdc.go.kr/yhs/).

Dietary behaviors

1. Feeding practices in infants

Proper feeding practices during infancy are necessary for infants and children to achieve adequate nutrition, well-being, and growth [13-15]. Infant feeding practices vary among locations, socioeconomic levels, and age groups [16-18], and few studies have cited scientific evidence [19]. Thus, it is necessary to review various guidelines and national survey studies to determine the optimal infant feeding practices in Korea.
Infant feeding practices consist of breastmilk, formula, and complementary feeding (CF). The Korean Academy of Pediatrics, American Academy of Pediatrics (AAP), World Health Organization (WHO), and United Nation’s International Children’s Emergency Fund strongly recommended exclusive breastfeeding (EBF) for the first 6 months of life and continued breastfeeding up to 24 months of age or beyond [20-23]. A positional paper published by the European Society for Pediatric Gastroenterology, Hepatology, and Nutrition (ESPGHAN) suggested that EBF be promoted until the baby is at least 4 months of age [24]. According to a study using KNHANES data from 2013–2015, mixed formula and breastmilk were the most common feeding practices in Korea for children aged 1–3 years [25]. Compared with previous KNHANES studies of children aged 1–3 years, the EBF rate decreased, and the rate of mixed feeding increased [26].
Offering CF during the weaning period is important because it must meet the appropriate nutritional requirements and allow children to experience foods with various flavors and textures. Recommendations for when to introduce CF differ among guidelines according to the expected health outcomes. The AAP and WHO recommend nutritionally adequate and safe CF (solids and liquids other than breastmilk or infant formula) starting from of 6 months age [27,28]. The introduction of CF before 6 months could increase the risk of obesity and diabetes in adulthood, reduce breastmilk consumption, increase the risk of choking and allergic reactions, and negatively influence the child’s behavioral and cognitive development [29-31]. On the other hand, an ESPGHAN committee suggested that CF not be introduced before 4 months or delayed beyond 6 months; in other words, ESPGHAN recommends starting CF at 17–26 weeks of age [32]. Because gastrointestinal and renal functions are adequately mature by approximately 4 months, full-term infants with normal neurodevelopment could begin CF sooner than 6 months. Recent studies suggest that introducing CF with breastfeeding at 4 months could have beneficial effects on iron storage [33-35]. In addition, prolonged EBF can lead to iron deficiency (ID), so CF should not be delayed beyond 6 months [36,37]. The introduction of allergenic foods is described below in the “Allergic diseases” section.
Using KNHANES data, Yon et al. [38] found that a delayed introduction of CF was associated with a risk of early childhood caries. A systematic review in the United States reported that age at the introduction of CF was not associated with weight, body circumference, or length among healthy infants [39]. A survey study reported that 25% of Koreans introduced CF at 4–5 months of age, while 64.3% of Koreans introduced CF at 6–7 months of age [40]. Only 0.4% started CF earlier than 4 months of age, a figure that was significantly lower than the 20.6% reported in 1993 [41]. Kim et al. [25] reported that the mean starting time for CF was 6.2 months of age. Further studies are needed to establish optimal feeding practice guidelines for infants and children in Korea and individually apply appropriate feeding practices as determined by various related factors.

2. Breakfast

Breakfast consumption is important to ensuring adequate total daily dietary intake and good health [42,43]. A recent US analysis of National Health and Nutrition Examination Survey 2005–2012 data reported that skipping breakfast is associated with low diet quality in young children (2–12 years) [44]. Those researchers found that overall diet quality scores as well as the subscale scores for fruit, whole fruit, whole grains, dairy, and empty calories were significantly better in children who ate breakfast; those who skipped breakfast consumed nearly 40% of their caloric intake from snacks [44]. In addition, several studies reported positive associations between measures of adiposity and cardiometabolic risk factors (e.g., glucose, insulin, triglycerides [TG], total cholesterol, low-density lipoprotein cholesterol) and skipping breakfast in children [45-47]. In Korea, the prevalence of skipping breakfast has increased over the past decade. According to KNHANES data, 11.1% of 6–11-year-olds and 27.0% of 12–18-year-olds skipped breakfast in 2008, while 15.0% of 6–11-year-olds and 37.4% of 12–18-year-olds skipped breakfast in 2018 [48]. Recent studies of KNHANES [49-52] and KYRBS [53] data reported that breakfast consumption is associated with dietary environment, adequacy of nutrient intake, and dietary habits (Table 3). Yu and Yang [50] reported that the frequency of eating breakfast among elementary school students (6–11 years) correlated with the dietary lifestyle factors of their parents (e.g., parents’ breakfast consumption frequency, dietary condition), and the group that skipped breakfast had a higher rate of a daily intake below the estimated average requirement (EAR) for iron than the group that ate breakfast. Associations between breakfast consumption and overall dietary habits and dietary intake adequacy were also reported in adolescents (12–18 years) [49,51-53]. Furthermore, consuming breakfast as a family is positively correlated with the nutritional quality of breakfast among Korean school-aged children and adolescents [49,53]. Further studies are needed to investigate the impact of breakfast consumption on overall daily dietary quality and nutritional status among Korean children and adolescents, and continued nutritional education efforts should reinforce the importance of eating a balanced breakfast.

3. Fast/processed foods

In recent decades, people’s dietary patterns have transformed to include an increased consumption of fast and processed foods [54,55]. In previous studies based on a US national survey, children and adolescents who ate fast food, compared with those who did not, consumed more total energy, fat, saturated fat, added sugars, and sugar-sweetened beverages; less milk; and fewer fruits and nonstarchy vegetables [56,57]. The rate of fast food consumption (25.5%) more than 3 times a week among adolescents has doubled over the past 10 years, and boys (27.5 %) had a higher consumption rate than girls (23.4%) [58]. In addition, 39.1% of boys and 40.7% of girls replaced meals with convenience store foods, particularly noodles (69.3%), kimbap (55.5%), and beverages (42.1%) [59]. In previous studies of KYRBS data, frequent fast and convenience store food consumption was associated with body mass index (BMI) [60,61] and mental status, including depression and subjective happiness (Table 3) [62,63]. However, no study using national survey data published during the past 5 years has quantitatively evaluated how frequency of fast or convenience store food consumption by Korean children and adolescents affects their nutrient intake. Thus, further studies are needed of the ways in which fast and convenience store food consumption affect the diet quality and health of Korean children and adolescents. Moreover, further research is needed to develop a comprehensive food and nutrient database of fast/processed foods to help studies examine the relationship between their consumption and children and adolescents’ diet quality and health.

4. Sugar-sweetened beverages

Sugar-sweetened beverages, such as soft drinks and sports drinks, and juices that are less than 100% fruit juice, can contribute excess calories and provide little or no key nutrients [64]. A recent systematic review and meta-analysis of prospective cohort studies and randomized controlled trials provided evidence that sugar-sweetened beverage consumption promotes weight gain in children and adults [65]. In addition, a meta-analysis reported that the habitual consumption of sugar-sweetened beverages was associated with the development of metabolic syndrome (MetS) and type 2 diabetes in adults [66].
In Korea, the overall mean daily beverage consumption among children and adolescents increased to 107.8 g and 203.9 g in 2018 from 53.0 g and 91.1 g in 2008, respectively [48]. Recent KYRBS data also showed increasing trends in the consumption of carbonated drinks, sugar-sweetened beverages, and energy drinks by adolescents [59]. A study of KNHANES data reported that carbonated beverages had the highest intake rate and sugar content among beverages consumed by children aged 6–11 years [67]. This study found positive associations between the intake of sugary and carbonated beverages and childhood obesity. In the past 5 years, studies were published on beverage consumption and its influence on adolescents [68,69]. as well as on the associations between beverage consumption and self-rated health status and mental health using KYRBS data (Table 3) [63,70]. Sugar-sweetened beverage consumption among Korean children and adolescents should be monitored, and further studies are warranted to provide scientific evidence of association between the effects of beverage consumption and the quantity and quality of dietary intake among Korean children and adolescents. Examinations of the long-term effects of sugar beverage consumption on health among Korean children and adolescents are also necessary to provide dietary guidelines for the prevention of pediatric obesity.

5. Excess sodium

A high sodium intake is a leading contributor to elevated blood pressure and responsible for a high incidence of cardiovascular events [71]. The WHO recommends a sodium intake of less than 2 g/day (equivalent to less than 5 g/day of salt) in adults to reduce blood pressure and the risk of cardiovascular disease (CVD) [72]. The average sodium intake in Korea is high, with about half the population consuming more than 4 g/day, twice the recommended upper limit [73,74]. To improve the safety of children’s diets including reducing the sodium served in food to children, the Special Act on Safety Management of Children’s Dietary Lifestyle went into effect in 2009 [73,75]. This act limited the selling and advertising of energy-dense, nutrition-poor foods that children commonly eat and required that packaged foods contain nutrition labels that included the sodium content [73,75]. The 2018 KNHANES report indicated that mean sodium intakes were 1,749.0 mg in subjects aged 1–9 years and 3,165.9 mg in subjects aged 10–18 years [48]. Although there was decreasing trend in sodium consumption over 10 years, it was still double the recommended intake. Boys, older adolescents, and those who frequently eat out had higher sodium intakes than their counterparts [76]. Lee et al. [77] reported that adolescents with high sodium excretion levels showed an increased risk of being overweight and having central obesity compared with those with low urinary sodium excretion levels. Similarly, a significant positive association was found between urinary/dietary sodium intake and adiposity in children and adolescents [78]. In addition, sodium intake as estimated by urinary sodium excretion (e.g., urinary sodium concentration, urinary sodium concentration to urinary creatinine ratio, urinary sodium concentration to specific gravity ratio) was positively associated with insulin resistance or metabolic abnormalities in children and adolescents [79-82]. Further studies are needed to explore the association between excessive sodium intake and long-term health among Korean children and adolescents. Developments in dietary/nutritional education programs targeting children and adolescents are also important for reducing excessive sodium intake.

Nutritional status

1. Vitamin D

Vitamin D plays a significant role in the regulation of calcium metabolism and mineral and calcium homeostasis [83]. The key role of vitamin D is improving calcium absorption ability in the small intestine [84]. Vitamin D is formed by the action of ultraviolet light from the sun on chemicals naturally found in the skin. However, it is difficult to obtain adequate amounts of vitamin D from food alone; sunlight is its most important source [85].
Serum 25-hydroxyvitamin (25(OH))D concentration is the most widely used measurement of vitamin D status [86]. However, the normal range of vitamin D concentrations in children and adolescents in Korea has not been established. Vitamin D status differs by region and race, so it is difficult to adopt recommendations from countries that do not consider Korean characteristics and geographical factors. The dietary vitamin D requirement depends on the amount of exposure an infant receives to sunlight [87]. A nursing baby’s vitamin D levels do not change with the mother’s dietary intake of vitamin D. The AAP recommends that all children, including EBF infants, be supplemented with 400 IU of vitamin D per day because human milk typically contains a vitamin D concentration of 25 IU/L or less [22,88,89].
Dietary reference intakes for Koreans consider the minimum required intake to prevent vitamin D deficiency, the intake needed to prevent the risk of adverse effects from excessive vitamin D intake, and the consumption behavior and lifestyles of Koreans. Because the scientific evidence needed to estimate vitamin D requirements in Koreans is still lacking, a reference was set as an adequate intake (AI) that reflects the intake when serum 25(OH)D levels reach the optimal range. The AI of vitamin D is 5 µg (200 IU)/day for infants and children under 11 years of age and 10 µg (400 IU)/day for anyone 12 years of age and older. Supplementation with vitamin D or an adequate dietary intake of vitamin D is required for children who are infrequently outdoors, which makes it difficult to synthesize vitamin D from ultraviolet rays [90].
Several studies have used KNHANES data to examine the prevalence and trends of vitamin D status in children and adolescents (Table 4). Studies using KNHANES 2008–2014 data reported a significant trend toward lower serum 25(OH)D levels and a significant increase in the prevalence of vitamin D deficiency in all age groups [91,92]. In addition, studies have noted that winter season, higher education levels, lack of vitamin D supplementation, old age, female sex, urban residence, and a high BMI were independent factors contributing to a low vitamin D level [93,94]. Vitamin D supplementation could be suggested depending on the mentioned risk factors associated with a low vitamin D status.
In addition to demonstrating one’s bone health, vitamin D levels are considered related to chronic diseases, including CVD, hypertension, diabetes, MetS, autoimmune conditions, infectious/inflammatory diseases, and cancer [83,87]. Recent studies of Korean children and adolescents reported that vitamin D deficiency is associated with obesity, nonalcoholic fatty liver disease, MetS, insulin resistance, and cardiometabolic risks (Table 4) [95-99]. In addition, based on KNHANES data studies have associated the prevalence of vitamin D deficiency with dental caries, ID, myopia, and immunoglobulin E levels [100-103]. The mechanisms of the association between vitamin D and chronic diseases remain unclear, and further investigations are needed to elucidate the pathogenesis.

2. Iron

Iron is an important factor for virtually all living organisms that participates in a wide range of metabolic processes, including oxygen transport, deoxyribonucleic acid synthesis, and electron transport [104,105]. In the human body, iron exists predominantly in complex forms bound to protein (hemoprotein) as heme compounds (hemoglobin or myoglobin), heme enzymes, or nonheme compounds (flavin-iron enzymes, transferrin, and ferritin) [106,107].
ID in children is a common problem associated with defects in cognitive and psychomotor development, behavioral problems, diminished growth, and diminished immune response, even in the absence of anemia [108,109]. To prevent ID anemia (IDA), the AAP, ESPGHAN, and WHO emphasize the need to provide dietary sources of iron (e.g., beef, iron-fortified grain meals) from the introduction of CF rather than medicinal iron supplementation [24,33,110]. The majority of full-term babies are born with sufficient iron stores that are not depleted until they are 4–6 months of age [107], and breastfeeding is more beneficial for preventing ID than formula because of the high bioavailability of iron in breastmilk. However, if a full-term breastfed infant is unable to consume enough iron from CF after 6 months of age, an oral iron supplement should be used [88,110]. Raw milk should not be fed to children younger than 12 months, and consuming iron-rich foods along with vitamin C is a great way to prevent ID.
In Korea, the EAR was calculated using the amount of basic iron loss, increased blood volume during the growth period, and the amount needed to increase tissue and stored iron. The EAR was then used to establish the recommended dietary allowance (RDA). The AI of iron for 0- and 6-month-old infants has been estimated as 0.3 mg/day, largely based on the iron intake of EBF infants. The RDA for infants aged 6–11 months is 6 mg/day, while the tolerable upper intake level for those aged 0–14 years is 40 mg/day. The RDA of iron is 9 mg/day for children 6–8 years of age, 10 mg/day for those 9–11 years of age, 14 mg/day for those 12–18 years of age, and 16 mg/day for females aged 12–14 years to reflect menstrual blood loss [90].
Since 1998, the prevalence of anemia using KNHANES data has been reported as 7.4%–9.5% overall, with a prevalence of 2.2%–4.8% in men and 11.9%–16.5% in women [111]. Using KNHANES data from 2010, Lee et al. [112] showed that the prevalence of IDA in the Korean population aged 10 years and older was 0.7% in males and 8.0% in females and that low income, underweight status, or an iron- or vitamin C-poor diet was associated with IDA (Table 5). In a previous study based on KNHANES 2008 data, Kim et al. [113] showed that the prevalence of ID in males and females was 8.6% and 17.2% at ages 10–14 years and 3.9% and 24.1% at 15–17 years. Interestingly, a study based on KNHANES 2010–2012 data reported that the development of IDA in adolescents was correlated with a family history of IDA [114]. This finding indicates that maternal awareness and feeding practices can influence the risk of IDA in children. Further studies are needed to better understand the relationship between family characteristics and IDA in infants and adolescents. Two studies based on KNHANES 2010–2011 data investigated the association between ID and the levels of other divalent metals, such as cadmium and lead, in adolescents. ID was associated with increased blood cadmium concentrations and lead levels [115,116]. Iron shares similar absorption mechanisms with cadmium and lead; therefore, ID would result in excess cadmium and lead absorption [117]. In addition, animal studies have shown that ID predisposes animals to lead toxicity by increasing its absorption in the gastrointestinal tract [118]. Cadmium is a carcinogenic metal, while lead is a potential neurotoxin. Therefore, it is necessary to assess iron and hematologic status when addressing environmental exposure to cadmium or lead.

Chronic diseases and nutrition

1. Obesity

Obesity and overweight are characterized by excessive fat accumulation that can impair health. The WHO estimated that 38.2 million children under the age of 5 years were overweight or obese in 2019, while over 340 million children and adolescents aged 5–19 years were overweight or obese in 2016. The prevalence of overweight and obesity in that population was just over 18% in 2016 [119]. BMI, the most widely used measure for obesity and overweight, is defined as weight in kilograms divided by square of height in meters (kg/m2). Because KNHANES data regarding diagnoses of specific diseases were obtained through self-questionnaire and interviews, there are limitations in diagnostic accuracy compared to that by a physician. However, since the diagnosis of obesity can be defined by objective anthropometric measurements, many studies on obesity have been conducted using KNHANES data. A study on KNHANES and National School Health Examination (NSHE) data showed that the prevalence of obesity in children aged 6–18 years increased from 8.7% in 2007 to 15.0% in 2017 in the NSHE, while that in children aged 2–18 years increased from 8.6% in 2001 to 9.8% in 2017 in the KNHANES. In addition, there was a higher increase in the prevalence in boys and high-school students than in girls and younger students (Table 6) [120]. Obesity is a preventable disease, and it is important to identify its associated risk factors. There have been several studies of environmental risk factors associated with obesity. A study of KNHANES 2010–2012 data reported that current maternal smoking habits, low paternal education level, and low family income were potential risk factors for obesity in Korean children, although not statistically significant [121]. Another study of KNHANES 2008–2010 data identified that obesity was significantly associated with a mother’s working hours, especially among girls [122]. A recent systematic review and meta-analysis showed that childhood obesity is significantly associated with adult CVD risk factors including high blood pressure, high TG level, and low high-density lipoprotein cholesterol (HDL-C) [123]. A study of KNHANES 2005–2014 data found that a high waist circumference in adolescents was associated with an increased incidence of CVD risk factors [124]. The prevalence of MetS is high in childhood obesity and associated with CVD-related mortality [125]. When the modified National Cholesterol Education Program diagnostic criteria were applied to KNHANES data, the prevalence of MetS in Korea was 8.9% in 1998, 12.4% in 2001, 10.6% in 2005, 5.3% in 2008, and 4.8% in 2010 [126]. Cho et al. [127] reported that adolescents with severe obesity (≥120% of 95th BMI or a BMI >35 kg/m2) were associated with metabolic risk factors of HDL-C <40 mg/dL, TG ≥150 mg/dL, and a systolic blood pressure ≥130 mg/dL. In addition, there are several studies that obesity in adolescence was associated with thyroid dysfunction [128,129], reduced bone mass and density [130], and pulmonary dysfunction [127].

2. Allergic diseases

Diet might affect allergic disease susceptibility because it contributes to the regulation of the immune system [131]. Many recent studies reported the effects of the Western diet [132], vitamins [133,134], fiber [135], and fatty acids [136,137] on the development of allergic diseases and allergic sensitization. Furthermore, ideas have changed about the ways in which the introduction of CF could influence the development of food allergies. Current evidence does not support the idea that delaying the introduction of allergenic foods, including peanuts, eggs, and fish, beyond 4–6 months of age, prevents allergic diseases [138,139]. In infants at high risk for peanut allergy, recent guidelines now recommend the early introduction of peanut-containing products to prevent its development [140]. There is also a lack of data to indicate that partially or extensively hydrolyzed formula prevents allergic diseases [138,141]. EBF for 3–4 months has a weak protective effect on wheezing in the first 2 years of life, during which wheezing is associated with vital respiratory infection rather than atopic asthma [142]. However, it is important to evaluate which diet patterns might have preventive effects on allergic disease in Koreans because genetic-environmental interactions play a crucial role in the development of allergic diseases and food consumption patterns vary widely among geographical regions and cultures [143].
The KNHANES and KYRBS surveys provide data about the diagnoses of allergic diseases, including AD, asthma, and allergic rhinitis, through self-administered questionnaires. A few studies in the past 5 years have used these Korean survey data to examine the association between childhood allergic diseases and nutrition (Table 7). Lee et al. [144] reported that parents with allergic diseases preferred breastfeeding (37.5%) for a longer duration (mean, 11.06 months) than those without allergic diseases (28.5%; mean duration of breastfeeding, 9.93 months). Breastfeeding has been believed to have protective effects in preventing the development of AD [145,146]. However, a recent Cochrane review of 23 independent studies concluded that EBF beyond 3–4 months does not reduce the risk of AD [147]. In the Korean study by Lee et al. [144], EBF and breastfeeding duration were not significantly associated with AD.
Kim et al. [148] reported that a high consumption of fast food, snacks, sweetened beverages, vegetables, and fruits was significantly associated with allergic diseases. Kang et al. [149] found that a high consumption of fast food was significantly correlated with recent asthma and that there was no association between the consumption of fruits, vegetables, and milk and recent asthma. These results were consistent with those of previous studies in Western countries. An English birth cohort study showed that children aged 8 years who predominantly consumed a Western-style diet were significantly more likely to have doctor-diagnosed asthma [150]. Fast food, processed meat, cheese, and other dairy products are rich sources of saturated fat in the Western diet [151,152]. A high consumption of saturated fatty acids was significantly correlated with current asthma in Spanish school-aged children [153]. Thus, a strategy for managing a high fast food intake may be required in adolescents with allergic diseases.

Conclusions

Comprehensive data related to nutrition monitoring of infants, children, and adolescents gathered in the continuous KNHANES and KYRBS are publicly available to researchers on related websites. Because of standardized methods and protocols in these surveys, many studies have been published in the last 5 years about dietary intake (breakfast, fast/processed food, sugary beverages, sodium), and nutritional status, including vitamin D, iron, and obesity, based on laboratory tests and anthropometric measurements. There has been an increasing trend in children and teenagers who skip breakfast, eat fast food, consume sugary drinks, have vitamin D deficiency, and are obese. The identification of risk factors and the use of personal approaches to avoid these dietary patterns and nutritional status are required in clinics and schools. However, few studies have examined infant feeding patterns, food intake frequency in toddlers, objective laboratory nutritional status in children younger than 10 years, and dietary factors associated with allergic diseases. Further studies using Korean survey data are needed to identify dietary patterns in the first 2 years of life since they are important factors in neurodevelopment health and the development of atopic diseases.
This review could help pediatricians, nutritionists, and other health care practitioners who monitor the growth and development of Korean children and adolescents understand recent trends in dietary intake and nutritional status. It also may inform researchers and policymakers about diet-related policies and strategies for the prevention of chronic diseases in Korean children and adolescents.

Footnotes

Conflicts of interest

No potential conflict of interest relevant to this article was reported.

Acknowledgments

This research was supported by the Bio & Medical Technology Development Program of the National Research Foundation funded by the Ministry of Science & ICT (grant number 2019M3E5D1A02070867). We thank Professor Jihyun Kim (Department of Pediatrics, Samsung Medical Center, Seoul, Korea) and Professor Young Mi Lee (Department of Food and Nutrition, Myongji University, Yongin-si, Kyeonggi, Korea) for their advice about the manuscript.

Fig. 1.
Trends in the number of responders to the national nutritional surveys: (A) Korea National Health and Nutrition Examination Survey. (B) Korean Youth Risk Behavior Web-based Survey.
cep-2020-01655f1.jpg
cep-2020-01655f2.jpg
Table 1.
Components of and key information in national surveys of children and adolescents
Component Survey method Information
KNHANES VII (2016–2018)
KYRBS (2019, 15th)
Ages 1–18 years Middle and high school students
Health interview Face-to-face interview Household characteristics, education, medical conditions, health care utilization, vaccinations, activity limitations, quality of life, injuries
Self-administered Smoking, alcohol use, physical activity, mental health, oral health, obesity and weight control, safety awareness, reproductive health for girls Socioeconomic status, obesity and weight control efforts, mental health, oral health, personal hygiene, physical activity, injuries and safety awareness, violence, drinking, tobacco use, sexual behavior, drug use, allergic disease (atopic dermatitis and asthma), internet addiction, and subjective health status
Nutrition survey Face-to-face interview Dietary behavior, food and nutrient intake, dietary supplements, nutrition labeling, food security, breast feeding and complimentary feeding, food frequency
Self-administered Dietary behavior
Health examination Face-to-face interview Body measurements (height, weight, waist circumference), blood pressure, laboratory tests (blood and urine), dental measurements, ophthalmic examination, grip power

KNHANES, Korea National Health and Nutrition Examination Survey; KYRBS, Korean Youth Risk Behavior Web-based Survey.

Table 2.
Survey items associated with nutrition in children and adolescents in the KNHANES and KYRBS
Domain Age (yr) Items
KNHANES VII (2016-2018)
Dietary behavior ≥1 Frequency of eating breakfast, lunch, and dinner
Frequency of non-home-cooked meals including delivery food, packaged food, and food served by religious groups
Whether responder eats with someone
Dietary supplements (types, durations, dosing unit and frequency of dietary supplements)
≥6 Knowledge and practices of nutrition labels, whether responder received nutrition education and counseling in public health centers, offices, community centers, welfare facilities, schools, or hospitals.
1–3 Duration of breastfeeding
Duration of formula feeding
When to start weaning and raw milk
Whether responder provides nutritional supplements to their baby
Types of nutritional supplements
Food and nutrient intakes ≥1 Describe detailed foods and beverages consumption in the past 24 hours
KYRBS
Diet behavior 12–19 Frequency of eating breakfast
Types of convenience stores foods
Education Whether responder has been trained in nutrition and eating habits at school (including class time, broadcast training, lecture hall training, etc.)
Food frequency Fruits, soda, highly caffeine beverages, sugary beverage, fast foods, vegetables, white or processed milk, daily products (yogurt, cheese, etc.), food from convenience stores

KNHANES, Korea National Health and Nutrition Examination Survey; KYRBS, Korean Youth Risk Behavior Web-based Survey.

Table 3.
Summary of recent studies of dietary behavior in children and adolescents using Korean national survey data
Study Survey No. of subjects Age (yr) Key variables Main findings
Breakfast
Kim et al. (2019) [52] KNHANES (2013–2015) 1,281 12–18 Frequency of breakfast, dietary intakea), nutrient intakeb) EB group consumed significantly higher levels of most nutrients than SB group, except for vitamin A.
Hong et al. (2019) [49] KNHANES (2013–2014) 1,831 6–17 Frequency of breakfast, dietary intakea), nutrient intakeb), DD score Percentages of subjects consuming less than 1/4 of the EAR of vitamins A, B1, B2, C, niacin, and iron were significantly lower in the FBG than the EB group.
Yu and Yang (2019) [50] KNHANES (2013–2015) 1,325 6–11 Frequency of breakfast, dietary habitsc), nutrient intakeb) Significant association between frequency of EB and dietary factors of the parents
Kye (2019) [53] KYRBS (2018) 53,642 12–18 Frequency of breakfast, lifestyle factors, dietary habitsc) Overweight or obese subjects were more numerous in the SB group than in the EB group.
Risks of SB: intake of fruit less than one per day, intake of carbonated beverages more than one per day, intake of sugar-sweetened beverages more than three times per week in those who had not received nutritional and dietary education in school
Bae (2017) [51] KNHANES (2013–2015) 1,300 12–18 Frequency of breakfast, dietary intakea), nutrient intakeb) Significant association between EB and high nutrient intake
Kim et al. (2016) [154] KYRBS (2009–2013) 359,264 12–18 Frequency of breakfast, school performance, dietary intakea) Significant positive association between school performance and EB and frequent consumption of fruits and milk
Fast/processed food intake
Cha (2020) [61] KYRBS (2018) 28,911 16–18 Frequency of fast-food intake, BMI Positive association between intake of fast foods and BMI
Park and Lee (2020) [155] KYRBS (2019) 57,303 12–18 Frequency of fast-food intake, perceived stress, depression, suicidal ideation Significant association between frequent consumption of convenience foods and poor mental health
Hong (2019) [60] KYRBS (2018) 26,338 12–18 Frequency of fast-food intake, smoking, alcohol, physical activity, BMI Significant association between obesity and lifestyle factors: frequent consumption of fast foods, smoking, alcohol consumption, eating breakfast fewer than four times a week, eating fruit fewer than four times a week
Lee and Kwon (2018) [62] KYRBS (2017) 62,276 12–17 Frequency of fast-food intake, subjective happiness Significant association between unhappiness and frequently eating at a convenience store
An (2018) [63] KYRBS (2016) 65,528 12–18 Frequency of fast-food intake, depression Significant association between depression and frequent fast food consumption
Kim et al. (2016) [154] KYRBS (2009–2013) 359,264 12–18 Frequency of fast-food intake, dietary intakea) Significant negative association between school performance and frequent intake of soft drinks, instant noodles, and fast- and convenience store foods
Sugar beverage intake
Oh and Chung (2019) [68] KYRBS (2014–2017) 267,907 12–18 Energy drink consumption, dietary intakea), dietary habitsc) Significant association between higher energy drink consumption and higher intake of soda, sweet drinks, and fast food; skipping breakfast; and lower vegetable intake
Wang et al. (2018) [67] KNHANES (2013–2015) 1,520 6–11 Nutrient intakeb) Average daily beverage intake: 131.75 g/day
Average daily total sugar intake from beverages: 13.76 g/day
Significant association between high beverage intake and obesity
Hwang and Kye (2018) [70] KYRBS (2015–2016) 104,750 12–18 Subjective health status Significant association between high intake of soft drinks and subjective health status
An et al. (2018) [63] KYRBS (2016) 65,528 12–18 Depression Significant association between depression and frequent consumption of carbonated drinks
Kim et al. (2018) [76] KYRBS (2017) 62,276 12–18 Parental education levels, subjective household economic status, subjective academic achievement, alcohol consumption, smoking, dietary habits Significant association between high rate of sugar-sweetened beverage consumption and boys, higher household income, smoking, alcohol consumption, and SB
Excess sodium
Lee et al. (2018) [77] KNHANES (2008–2011) 1,476 10–18 Urinary sodium levels, BMI Significant association between high urinary sodium excretion during 24 hr and overweight or central obesity
Kim et al. (2018) [80] KNHANES (2009–2010) 718 10–18 UNa/Ucr, fasting insulin level, glucose Significant association between sodium excretion and insulin resistance
Han et al. (2018) [81] KNHANES (2010) 578 12–18 UNa/Ucr, fasting insulin level, glucose Significant positive association between increased Na excretion and high risk of insulin resistance
Kim (2018) [76] KNHANES (2015) 405 7–18 Parents’ and children’s sodium dietary intake Significant positive association between dietary sodium intake in study subjects and maternal dietary sodium intake
So et al. (2017) [79] KNHANES (2010–2013) 1,738 10–18 UNa/USG, BMI, WC, BP, total cholesterol, HDL-C, TG, LDL-C Significant association between UNa/USG and MetS
Nakitto et al. (2017) [156] KNHANES (2013–2015) 1,453 12–18 Food insecurity, DD score, nutrient intakeb) Both food secure and insecure subjects showed insufficient intake of vitamin A, vitamin C, and calcium and excessive sodium intake
Lee and Kim (2016) [78] KNHANES (2010–2011) 1,467 10–18 UNa/Ucr, sodium dietary intake, TBPF Significant positive association between urinary and dietary sodium and adiposity
Chun et al. (2016) [82] KNHANES (2009–2010) 1,353 12–19 UNa/Ucr, UNa/USG, fasting insulin level and glucose Significant positive association between urinary sodium excretion and insulin resistance

KNHANES, Korea National Health and Nutrition Examination Survey; KYRBS, Korean Youth Risk Behavior Web-based Survey; EB, eating breakfast; SB, skipping breakfast; EAR, estimated average requirements; FBG, family breakfast group; BMI, body mass index; WU, waist circumference; BP, blood pressure; HDL-C, high-density lipoprotein cholesterol; TG, triglycerides; LDL-C, low-density lipoprotein cholesterol; DD, dietary diversity; MetS, metabolic syndrome; TBPF, total body percent fat; UNa/Ucr, urinary sodium to urinary creatinine ratio; UNa/USG, urinary sodium to urinary specific gravity ratio.

a) Dietary intake of cereals, sugars and sweeteners, vegetables, fruit, milk, beverages, prepared and processed foods.

b) Nutrient intake of energy, protein, fat, carbohydrates, fiber, vitamins A, B1, B2, C, calcium, iron.

c) Dietary habits including fruit intake, consumption of carbonated beverages, sugar-sweetened beverages, and fast food.

Table 4.
Summary of recent studies of vitamin D status in children and adolescents using Korean national survey data
Study Survey No. of subjects Age (yr) Key variables Main findings
Prevalence and trends in vitamin D status
Jung et al. (2018) [91] KNHANES (2008–2014) 39,759 >10 Serum 25(OH)D Significant decreasing trend in mean serum 25(OH)D level of all age groups older than 7 yr
Park et al. (2018) [92] KNHANES (2008–2014) 39,759 >10 Serum 25(OH)D Significant decreasing trend in mean serum 25(OH)D level and increasing trend in prevalence of vitamin D deficiency in those older than 7 yr
Hong et al. (2018) [157] KNHANES (2008–2012) 28,551 All ages Serum 25(OH)D Parental influence on vitamin D status of offspring was greater in adolescents than in adults
Byun et al. (2017) [93] KNHANES (2008–2010) 2,515 10–18 Serum 25(OH)D 73.3% of subjects had serum 25(OH)D lower than 20 ng/mL
Significant association between low serum 25(OH)D levels and older age, female sex, urban residence, higher BMI, and sampling in winter
Association between vitamin D status and diseases
Cho et al. (2019) [97] KNHANES (2008–2014) 3,878 12–18 Serum 25(OH)D, BMI, ALT, WC, fasting glucose, cholesterol, TG Significant association between vitamin D deficiency and suspected NAFLD
Choi et al. (2018) [100] KNHANES (2010–2014) 2,655 10–18 Serum 25(OH)D, dental clinic visits, tooth brushing Significant positive association between vitamin D status and risk of dental caries in boys
Byun et al. (2017) [93] KNHANES (2008–2010) 2,515 10–18 Serum 25(OH)D, AD, asthma No significant association between vitamin D status and AD or asthma
Yoo et al. (2016) [96] KNHANES (2010) 870 10–18 Serum 25(OH)D, BP, BMI, WC, TG, cholesterol, fasting glucose Significant association between high vitamin D level and decreased WC and BP
Lee et al. (2015) [103] KNHANES (2010–2012) 2,526 10–20 Serum 25(OH)D, Hb, BMI Significant association between vitamin D deficiency and an increased risk of iron deficiency anemia in healthy females

KNHANES, Korea National Health and Nutrition Examination Survey; 25(OH)D, 25-hydroxyvitamin D; BMI, body mass index; ALT, alanine transaminase; WC, waist circumference; TG, triglycerides; NAFLD, nonalcoholic fatty liver disease; AD, atopic dermatitis; BP, blood pressure; Hb, hemoglobin.

Table 5.
Summary of recent studies on iron status in Korean children and adolescents using Korean national survey data
Study Survey No. of subjects Age (yr) Key variables Main findings
Prevalence and trends in iron status
Oh et al. (2018) [158] KNHANES (2010–2012) 2,487 10–20 Dietary iron intake, menarche status, serum iron, TSAT, TIBC, ferritin, Hb Sharply increasing trend in serum ferritin levels with progression to puberty
Significant sex differences in ferritin from the age of 14 yr
Lim et al. (2015) [159] KNHANES (2010–2012) 2,196 10–20 Serum iron, Hb, TIBC Prevalence of anemia according to WHO criteria and own criteria (Hb level <2 standard deviations of age- and sex-specific values) was 3.5% and 3.8%, respectively
Lee et al. (2014) [112] KNHANES (2010) 6,758 >10 Hb, transferrin saturation, serum ferritin, MCV, BMI, dietary intake The overall prevalence of ID and IDA was 12.1% and 4.3%, respectively
Significant association between IDA and low income, underweight or iron- or vitamin C-poor diet
Association between iron status and diseases
Chueh et al. (2018) [114] KNHANES (2010–2012) 2,918 10–18 Serum ferritin, Hb, transferrin saturation, family history of IDA Significant association between IDA and family history of IDA
Jung et al. (2017) [160] KNHANES (2009–2010) 1,321 10–18 Serum 25(OH)D, serum ferritin, Hb, BMC, daily intakes of total energy, protein, fat, and calcium Significant positive association between the levels of Hb and BMC of the total femur and lumbar spine in boys
Hong et al. (2017) [161] KNHANES (2010–2012) 619 8–15 (mo) Serum iron, MCV, Hb, TIBC, feeding type, red meat intake, iron-rich food intake Significant association between ID/IDA and prolonged breastfeeding and perceived inadequacy of red meat intake
Lee et al. (2014) [115] KNHANES (2010–2011) 396 10–19 BMI, serum ferritin, Hb, urinary cotinine, blood cadmium levels Significant negative association between serum ferritin levels and blood cadmium concentration
No significant association between anemia status and blood cadmium concentration
Sim et al. (2014) [116] KNHANES (2010–2011) 396 10–19 Serum ferritin, urine cotinine, blood lead levels, BMI Significant negative association between serum ferritin levels and blood lead levels in boys and premenarche girls

KNHANES, Korea National Health and Nutrition Examination Survey; TSAT, transferrin saturation; TIBC, iron-binding capacity; Hb, hemoglobin; WHO, World Health Organization; ID, iron deficiency; IDA, iron deficiency anemia; BMI, body mass index; MCV, mean corpuscular volume; 25(OH)D, 25-hydroxyvitamin D; BMC, bone mineral content.

Table 6.
Summary of recent studies of obesity in children and adolescents using Korean national survey data
Study Survey No. of subjects Age (yr) Key variables Main findings
Association between obesity and environmental factors
Kim and Moon (2020) [120] KNHANES (2001, 2005, 2007–2017)/NSHE (2007–2017) 23,343/1,301,681 2–18/6–18 BMI Prevalence of overweight and obese subjects increased from 15.3% to 23.7% over the past 10 years
Lee et al. (2020) [121] KNHANES (2007–2015) 14,482 2–18 BMI, WHR, parental BMI, SES Significant association between obesity and current maternal smoking habits, paternal education, and low family income
Shin et al. (2018) [162] KNHANES (2010–2013) 1,567 10–19 BMI, blood mercury levels Significant association between total blood mercury quartile and abdominal obesity in boys
Kang et al. (2018) [163] KNHANES (2010–2011) 1,304 12–18 Birth weight, BMI, fat mass, lean mass High birth weight can lead to obesity and increased fat mass but not lean mass
Kim et al. (2017) [130] KNHANES (2009–2010) 982 12–19 Lean mass, fat mass, bone mass, BMD, BMAD, total cholesterol, HDL-C, fasting glucose, insulin, serum 25(OH)D Significant association between overweight/obese and bone mass and density
Association between obesity and chronic diseases
Lee and Song (2020) [124] KNHANES (2010–2014) 8,153 10–18 BMI, WC, BP, total cholesterol, HDL-C, TG, LDL-C, fasting glucose Significant association between high WC in adolescents and increased CVR
Park et al. (2020) [164] KNHANES (2001–2005, 2015–2017) 4,448 10–19 ALT, BMI, WC Prevalence of suspected NAFLD continues to increase in Korean adolescents
Lee (2019) [165] KNHANES (2016–2017) 1,256 10–18 BMI, WC, BP, total cholesterol, HDL-C, TG, LDL-C, fasting glucose, serum uric acid Significant association between hyperuricemia and MetS, abdominal obesity, and BMI z scores
Kim et al. (2019) [166] KNHANES (2009–2011) 763 10–18 BMI, WC, BP, total cholesterol, HDL-C, TG, LDL-C, FEV1, FVC Significant association between low lung function and MetS components
An et al. (2018) [129] KNHANES (2013–2015) 975 10–18 BMI, WC, BP, total cholesterol, HDL-C, TSH, fT4 Korean children with abdominal obesity had increased TSH and decreased fT4 levels compared with normal-weight children
Cho et al. (2018) [127] KNHANES (2007–2014) 1,326 10–18 BMI, WC, BP, total cholesterol, HDL-C, TG, LDL-C, fasting glucose Adolescents with severe obesity have more metabolic risk factors than adolescents with less severe obesity
Jin et al. (2018) [128] KNHANES (2013–2015) 1,104 10–19 TSH, fT4, BMI, total cholesterol, HDL-C, LDL-C, serum insulin level Subclinical hypothyroidism was common in the obese group
Kim et al. (2018) [167] KNHANES (2008–2014) 5,742 10–18 BMI, WC, BP, total cholesterol, HDL-C, TG, LDL-C, fasting glucose, serum fasting insulin Non-HDL-C level of 120 mg/dL for males and 150 mg/dL for females is the threshold between borderline high and high risk for MetS
Choi et al. (2017) [168] KNHANES (2013–2014) 3,057 10–19 WHR, BMI, WC No significant difference found between the diagnostic power of WHR and that of BMI/WC when screening for MetS
Yoon et al. (2017) [169] KNHANES (2007–200) 530 10–19 BMI, WC, BP, total cholesterol, HDL-C, TG, LDL-C, fasting glucose, WHR, fasting glucose, ALT, insulin High CMRFs were significantly observed in metabolically unhealthy obese children
Chung et al. (2016) [170] KNHANES (1998–2008) 4,068 10–19 WHR, BMI, WC, fasting glucose, TG, HDL-C, BP Significant association between WHR and CMRFs (systolic BP, HDL-C, TG) in both non-overweight and overweight subjects
Yu and Song (2015) [171] KNHANES (2007–2010) 2,958 10–18 Dietary sodium intake, WC, BMI, WC, BP, total cholesterol, HDL-C, TG, LDL-C, fasting glucose Three clustering patterns: high BP, dyslipidemia, and glucose abnormality

No significant association between glucose patterns and nutrient intake except for thiamin

KNHANES, Korea National Health and Nutrition Examination Survey; NSHE, National School Health Examination; BMI, body mass index; WHR, waist–height ratio; SES, socioeconomic status; BFP, body fat percentage; BMD, bone mineral density; BMAD, bone mineral apparent density; HDL-C, highdensity lipoprotein cholesterol; 25(OH)D, 25-hydroxyvitamin D; WC, waist circumference; TG, triglycerides; LDL-C, low-density lipoprotein cholesterol; BP, blood pressure; CVR, cardiovascular risk; ALT, alanine transaminase; NAFLD, nonalcoholic fatty liver disease; MetS, metabolic syndrome; FEV1, forced expiratory volume in 1 second; FVC, forced vital capacity; TSH, thyroid stimulating hormone; fT4, free thyroxine; CMRFs, cardiometabolic risk factors; TG, triglycerides; TBPF, total body percent fat.

Table 7.
Summary of recent studies of association between dietary factors and allergic diseases in children and adolescents using Korean national survey data
Study Survey No. of subjects Age (yr) Key variables Main findings
Kim (2019) [172] KNHANES (2013–2015) 752 9–11 AD, nutrient intakea) Significant association between AD and intake of high carbohydrate, low fat, low PUFA, and low n-3 FA
Kang et al. (2018) [149] KYRBS (2012) 76,980 12–18 Asthma, dietary intakeb) Significant association between high intake of fast food and asthma
No association between consumption of fruits, vegetables, or milk and asthma
Lee et al. (2017) [144] KNHANES (2007–2012) 2,015 1–3 AD, feeding practices No significant association between exclusive breastfeeding or duration of breastfeeding and incidence of AD
Kim et al. (2017) [148] KYRBS (2014) 72,060 12–18 Allergic diseases (AD, asthma, AR), dietary intake Significant associations between frequent consumption of fast food, snacks, sweetened beverages, vegetables, or fruits and allergic diseases
Kim et al. (2016) [173] KNHANES (2010–2012) 3,040 4–13 Allergic diseases (AD, asthma, AR), nutrient intake No significant findings between AD and nutrient intake
Significant association between asthma and high intake of vitamin A
Significant association between AR and high fat, protein, thiamine, and niacin intake and, low-carbohydrate intake

KNHANES, Korea National Health and Nutrition Examination Survey; AD, atopic dermatitis; PUFA, polyunsaturated fatty acid; FA, fatty acid; AR, allergic rhinitis.

a) Nutrient intake including total calories, protein, fat, carbohydrates, vitamin A, vitamin C, thiamine, riboflavin, and niacin.

b) Dietary intake including consumption of fast food, snacks, instant noodles, caffeinated beverages, sweetened beverages, soda, milk, vegetables, and fruit.

References

1. Lee MP. Overview of pediatrics. In: Kliegman RM, Stanton BF, St. Geme JW III, Schor NF, editors. Nelson textbook of pediatrics. 21st ed. Philadelphia (PA): Elsevier Saunders, 2020:1–9.

2. Popkin BM, Adair LS, Ng SW. Global nutrition transition and the pandemic of obesity in developing countries. Nutr Rev 2012;70:3–21.
crossref pmid
3. Schwarzenberg SJ, Georgieff MK. Advocacy for improving nutrition in the first 1000 days to support childhood development and adult health. Pediatrics 2018;141:e20173716.
crossref pmid
4. Kelly M. The nutrition transition in developing Asia: dietary change, drivers and health impacts. In: Jackson P, Spiess WEL, Sultana F, editors. Eating, drinking: surviving: the international year of global understanding. Cham: Springer International Publishing, 2016:83–90.

5. Song S, Song WO. National nutrition surveys in Asian countries: surveillance and monitoring efforts to improve global health. Asia Pac J Clin Nutr 2014;23:514–23.
pmid
6. Lee E, Baik D, Park Y, Ki M. The current status of health data on Korean children and adolescents. Epidemiol Health 2017;39:e2017059.
crossref pmid pmc
7. Korea Centers for Disease Control and Prevention. Korea Health Statistics [Internet]. Cheongju (Korea): Korea Centers for Disease Control and Prevention; 2018 [cited 2020 Aug 20]. Available from: http://www.kdca.go.kr/.

8. Kweon S, Kim Y, Jang MJ, Kim Y, Kim K, Choi S, et al. Data resource profile: the Korea National Health and Nutrition Examination Survey (KNHANES). Int J Epidemiol 2014;43:69–77.
crossref pmid pmc
9. Kim Y. The Korea National Health and Nutrition Examination Survey (KNHANES): current status and challenges. Epidemiol Health 2014;36:e2014002.
crossref pmid pmc
10. Korea Centers for Disease Control and Prevention. The Korea National Health and Nutrition Examination Survey [Internet]. Cheongju (Korea): Korea Centers for Disease Control and Prevention; 2020 [cited 2020 Aug 21]. Available from: http://www.kdca.go.kr/.

11. Korea Centers for Disease Control and Prevention. Korea Centers for Disease Control and Prevention. Cheongju (Korea): Korea Centers for Disease Control and Prevention; 2020 [cited 2020 Jun 21]. Available from: http://www.kdca.go.kr/.

12. Kim Y, Choi S, Chun C, Park S, Khang YH, Oh K. Data resource profile: the Korea Youth Risk Behavior Web-based Survey (KYRBS). Int J Epidemiol 2016;45:1076–1076e.
crossref pmid
13. Butte NF, Wong WW, Hopkinson JM, Smith EO, Ellis KJ. Infant feeding mode affects early growth and body composition. Pediatrics 2000;106:1355–66.
crossref pmid
14. Saadeh MR. A new global strategy for infant and young child feeding. Forum Nutr 2003;56:236–8.
pmid
15. Koletzko B, Baker S, Cleghorn G, Neto UF, Gopalan S, Hernell O, et al. Global standard for the composition of infant formula: recommendations of an ESPGHAN coordinated international expert group. J Pediatr Gastroenterol Nutr 2005;41:584–99.
crossref pmid
16. Lee AR, Yu YL, Kim HJ, Kim KA, Kim KW. Status of dietary life related knowledge, self-efficacy, food preference and dietary behavior of preschoolers in Kyunggi area. Korean J Community Nutr 2016;21:274–83.
crossref
17. Choi ES, Shin NR, Jung EI, Park HR, Lee HM, Song KH. A study on nutrition knowledge and dietary behavior of elementary school children in Seoul. Nutr Res Pract 2008;2:308–16.
crossref pmid pmc
18. Chang HS, Kim MJ. The study on dietary behaviors of elementary school student in Chungnam area according to the school food service type, gender and grade. Korean J Community Nutr 2006;11:608–17.

19. Agostoni C, Decsi T, Fewtrell M, Goulet O, Kolacek S, Koletzko B, et al. Complementary feeding: a commentary by the ESPGHAN Committee on Nutrition. J Pediatr Gastroenterol Nutr 2008;46:99–110.
crossref pmid
20. Gartner LM, Morton J, Lawrence RA, Naylor AJ, O'Hare D, Schanler RJ, et al. Breastfeeding and the use of human milk. Pediatrics 2012;129:e827–41.
crossref pmid
21. Park HW, Ryu KH, Piao Y, Li P, Hong JS, Kim HB, et al. Positive effect of baby-friendly hospital initiatives on improving mothers' intention for successful breastfeeding in Korea. J Korean Med Sci 2018;33:e272.
crossref pmid pmc
22. Section on Breastfeeding. Breastfeeding and the use of human milk. Pediatrics 2012;129:e827–41.
crossref pmid pdf
23. World Health Organization. UNICEF. Global strategy for infant and young child feeding. [Internet]. Geneva (Switzerland): World Health Organization; 2003 [cited 2020 Aug 2]. Avaliable from: https://www.who.int/nutrition/publications/infantfeeding/9241562218/en/.

24. Fewtrell M, Bronsky J, Campoy C, Domellöf M, Embleton N, Fidler Mis N, et al. Complementary feeding: a position paper by the European Society for Paediatric Gastroenterology, Hepatology, and Nutrition (ESPGHAN) Committee on Nutrition. J Pediatr Gastroenterol Nutr 2017;64:119–32.
crossref pmid
25. Kim EK, Song BC, Ju SY. Dietary status of young children in Korea based on the data of 2013–2015 Korea National Health and Nutrition Examination Survey. J Nutr Health 2018;51:330–9.
crossref
26. Kim YH, Lee SG, Kim SH, Song YJ, Chung JY, Park MJ. Nutritional Status of Korean Toddlers: from the Korean National Health and Nutrition Examination Survey 2007–2009. Korean J Pediatr Gastroenterol Nutr 2011;14:161–70.
crossref
27. Castenmiller J, de Henauw S, Hirsch-Ernst KI, Kearney J, Knutsen HK, Maciuk A, et al. Appropriate age range for introduction of complementary feeding into an infant's diet. EFSA J 2019;17:e05780.
pmid pmc
28. World Health Organization. Complementary feeding: family foods for breastfed children. [Internet]. Geneva (Switzerland): World Health Organization; 2000 [cited 2020 Aug 2]. Avaliable from: https://www.who.int/nutrition/publications/infantfeeding/WHO_NHD_00.1/en/.

29. Wilson AC, Forsyth JS, Greene SA, Irvine L, Hau C, Howie PW. Relation of infant diet to childhood health: seven year follow up of cohort of children in Dundee infant feeding study. BMJ 1998;316:21–5.
crossref pmid pmc
30. Morgan JB, Lucas A, Fewtrell MS. Does weaning influence growth and health up to 18 months? Arch Dis Child 2004;89:728–33.
crossref pmid pmc
31. Grummer-Strawn LM, Scanlon KS, Fein SB. Infant feeding and feeding transitions during the first year of life. Pediatrics 2008;122 Suppl 2:S36–42.
crossref pmid
32. World Health Organization. Strategy to accelerate progress towards the attainment of international development goals and targets related to reproductive health. Reprod Health Matters 2005;13:11–8.
crossref
33. Domellöf M, Braegger C, Campoy C, Colomb V, Decsi T, Fewtrell M, et al. Iron requirements of infants and toddlers. J Pediatr Gastroenterol Nutr 2014;58:119–29.
crossref pmid
34. Jonsdottir OH, Thorsdottir I, Hibberd PL, Fewtrell MS, Wells JC, Palsson GI, et al. Timing of the introduction of complementary foods in infancy: a randomized controlled trial. Pediatrics 2012;130:1038–45.
crossref pmid
35. Dube K, Schwartz J, Mueller MJ, Kalhoff H, Kersting M. Complementary food with low (8%) or high (12%) meat content as source of dietary iron: a double-blinded randomized controlled trial. Eur J Nutr 2010;49:11–8.
crossref pmid
36. Dewey KG, Cohen RJ, Rivera LL, Brown KH. Effects of age of introduction of complementary foods on iron status of breast-fed infants in Honduras. Am J Clin Nutr 1998;67:878–84.
crossref pmid
37. Chantry CJ, Howard CR, Auinger P. Full breastfeeding duration and risk for iron deficiency in U.S. infants. Breastfeed Med 2007;2:63–73.
crossref pmid
38. Yon M, Shin HS, Lee HS. Relationship between complementary feeding introduction and early childhood caries: results from the Korea National Health and Nutrition Examination Survey 2008–2015. Korean J Community Nutr 2019;24:97–105.
crossref
39. English LK, Obbagy JE, Wong YP, Butte NF, Dewey KG, Fox MK, et al. Timing of introduction of complementary foods and beverages and growth, size, and body composition: a systematic review. Am J Clin Nutr 2019;109:935S–55S.
crossref pmid
40. Yom HW, Seo JW, Park H, Choi KH, Chang JY, Ryoo E, et al. Current feeding practices and maternal nutritional knowledge on complementary feeding in Korea. Clin Exp Pediatr 2009;52:1090–102.
crossref
41. Lee SJ, Park JO, Sohn CS, Lee HR, Shin JH, Chung HI, et al. A survey on the present status of weaning. J Korean Pediatr Soc 1994;37:1643–56.

42. Nicklas TA, Bao W, Webber LS, Berenson GS. Breakfast consumption affects adequacy of total daily intake in children. J Am Diet Assoc 1993;93:886–91.
crossref pmid
43. Spence C. Breakfast: the most important meal of the day? Int J Gastron Food Sci 2017;8:1–6.
crossref
44. Ramsay SA, Bloch TD, Marriage B, Shriver LH, Spees CK, Taylor CA. Skipping breakfast is associated with lower diet quality in young US children. Eur J Clin Nutr 2018;72:548–56.
crossref pmid
45. Smith KJ, Gall SL, McNaughton SA, Blizzard L, Dwyer T, Venn AJ. Skipping breakfast: longitudinal associations with cardiometabolic risk factors in the Childhood Determinants of Adult Health Study. Am J Clin Nutr 2010;92:1316–25.
crossref pmid
46. Júnior IFF, Christofaro DG, Codogno JS, Monteiro PA, Silveira LS, Fernandes RA. The association between skipping breakfast and biochemical variables in sedentary obese children and adolescents. J Pediatr 2012;161:871–4.
crossref pmid
47. Berkey CS, Rockett HRH, Gillman MW, Field AE, Colditz GA. Longitudinal study of skipping breakfast and weight change in adolescents. Int J Obes 2003;27:1258–66.
crossref
48. Korea Health Statistics 2018: Korea National Health and Nutrition Examination Survey (KNHANES VII-3) [Internet]. Cheongju (Korea): Korea Centers for Disease Control and Prevention; 2020 [cited 25 Aug 2020]. Available from: https://knhanes.kdca.go.kr/knhanes/main.do.

49. Hong J, Kim M, Yoon J, Kim S. Family breakfast and diet quality among school-aged children and adolescents. J Korean Soc Food Cul 2019;34:378–88.

50. Yu S, Yang Y. Nutritional status and related parental factors according to the breakfast frequency of elementary school students: based on the 2013–2015 Korea National Health and Nutrition Examination Survey. J Nutr Health 2019;52:73–89.
crossref
51. Bae YJ. Evaluation of nutritional dtatus in Korean Adolescents according to rating breakfast together as a family-based on the 2013–2015 Korea National Health and Nutrition Examination Survey. Korean J Food Nutr 2017;30:1210–21.

52. Kim HS, Lee US, Kim SH, Cha YS. Evaluation of dietary habits according to breakfast consumption in Korean adolescents: based on the 6th Korea National Health and Nutrition Examination Survey, 2013–2015. J Nutr Health 2019;52:217–26.
crossref
53. Kye S. Breakfast skipping, body mass Index, health related factors in Korean adolescents: analysis of the data from the 2018 Youth Health Behavior Online Survey. J Learn Cent Curric Instr 2019;19:1263–81.
crossref
54. De Vogli R, Kouvonen A, Gimeno D. The influence of market deregulation on fast food consumption and body mass index: a cross-national time series analysis. Bull World Health Organ 2014;92:99–107.
crossref pmid pmc
55. Stuckler D, McKee M, Ebrahim S, Basu S. Manufacturing epidemics: the role of global producers in increased consumption of unhealthy commodities including processed foods, alcohol, and tobacco. PLoS Med 2012;9:e1001235.
crossref pmid pmc
56. Paeratakul S, Ferdinand DP, Champagne CM, Ryan DH, Bray GA. Fastfood consumption among US adults and children: dietary and nutrient intake profile. J Am Diet Assoc 2003;103:1332–8.
crossref pmid
57. Bowman SA, Gortmaker SL, Ebbeling CB, Pereira MA, Ludwig DS. Effects of fast-food consumption on energy intake and diet quality among children in a national household survey. Pediatrics 2004;113:112.
crossref pmid
58. Korea Centers for Disease Control and Prevention. 2019 Korea Youth Risk Behavior Web-based Survey Statistics [Internet]. Cheongju (Korea): Korea Centers for Disease Control and Prevention; 2018 [cited 2020 Sep 1]. Available from: http://www.kdca.go.kr/yhs/.

59. Korea Centers for Disease Control and Prevention. Korea Youth Risk Behavior Web-based Survey. [Internet]. Cheongju (Korea): Korea Centers for Disease Control and Prevention; 2019 [cited 2020 Aug 10]. Available from: http://www.kdca.go.kr/yhs.

60. Hong MH. The effect of adolescents’ health behavior on obesity. JKAIS 2019;20:295–302.

61. Cha S. Dietary habits and physical activity on height, weight and BMI of high school students in Korea. Korean J Phys Educ 2020;59:357–72.

62. Lee J, Kwon M. The effect of eating behaviors on subjective happiness in adolescents. J Korean Soc Sch Health 2018;31:39–47.

63. An YS. Effects of eating habits of Korean youth on depression. J Humanit Soc Sci 21 2018;9:911–24.
crossref
64. 2015–2020 Dietary Guidelines for Americans. 8th ed. U.S. Washington, DC: Department of Health and Human Services and U.S. Department of Agriculture, 2015;[cited 2020 Jul 20]. Available from: https://health.gov/our-work/food-and-nutrition/2015-2020-dietary-guidelines/.

65. Malik VS, Pan A, Willett WC, Hu FB. Sugar-sweetened beverages and weight gain in children and adults: a systematic review and meta-analysis. Am J Clin Nutr 2013;98:1084–102.
crossref pmid pmc
66. Imamura F, O'Connor L, Ye Z, Mursu J, Hayashino Y, Bhupathiraju SN, et al. Consumption of sugar sweetened beverages, artificially sweetened beverages, and fruit juice and incidence of type 2 diabetes: systematic review, meta-analysis, and estimation of population attributable fraction. BMJ 2015;351:h3576.
crossref pmid pmc
67. Wang H, Jeong H, Kim NH, Kang Y, Hwang K, Lee H, et al. Association between beverage intake and obesity in children: the Korea National Health and Nutrition Examination Survey (KNHANES) 2013-2015. Nutr Res Pract 2018;12:307–14.
crossref pmid pmc
68. Oh J, Chung J. Energy drink consumption and dietary-, lifestyle-, and mental health-related behaviors in Korean Adolescents: based on the 10th–13th Korea Youth Risk Behavior Web-Based Survey. Korean J Health Promot 2019;19:145–54.
crossref
69. Kim A, Kim J, Kye S. Sugar-sweetened beverage consumption and influencing factors in Korean adolescents: based on the 2017 Korea Youth Risk Behavior Web-based Survey. J Nutr Health 2018;51:456–79.
crossref
70. Hwang S, Kye S. Self-rated health Status among Korean adolescents: differences in home environmental factors, health behaviors, psychological factors, and dietary habits. J Korean Soc Scool Community Health Educ 2018;19:27–45.
crossref
71. Sacks FM, Svetkey LP, Vollmer WM, Appel LJ, Bray GA, Harsha D, et al. Effects on blood pressure of reduced dietary sodium and the Dietary Approaches to Stop Hypertension (DASH) diet. N Engl J Med 2001;344:3–10.
crossref pmid
72. World Health Organization. Sodium intake for adults and children. [Internet]. Geneva (Switzerland): World Health Organization; 2012 [cited 2020 Aug 5]. Avaliable from: https://www.who.int/publications/i/item/9789241504836.

73. Park HK, Lee Y, Kang BW, Kwon KI, Kim JW, Kwon OS, et al. Progress on sodium reduction in South Korea. BMJ Glob Health 2020;5:e002028.
crossref pmid pmc
74. Lee HS, Duffey KJ, Popkin BM. Sodium and potassium intake patterns and trends in South Korea. J Hum Hypertens 2013;27:298–303.
crossref pmid
75. World Health Organization. Policy – Special Act on Safety Management of Children’s Dietary Lifestyle. [Internet]. Geneva (Switzerland): World Health Organization; 2009 [cited 2020 Aug 5]. Avaliable from: https://extranet.who.int/nutrition/gina/en/node/22937.

76. Kim M. The relationship between parental sodium intake and adolescent sodium intake. JKAIS 2018;19:453–62.

77. Lee J, Hwang Y, Kim KN, Ahn C, Sung HK, Ko KP, et al. Associations of urinary sodium levels with overweight and central obesity in a population with a sodium intake. BMC Nutr 2018;4:47.
crossref pmid pmc
78. Lee SK, Kim MK. Relationship of sodium intake with obesity among Korean children and adolescents: Korea National Health and Nutrition Examination Survey. Br J Nutr 2016;115:834–41.
crossref pmid
79. So CH, Jeong HR, Shim YS. Association of the urinary sodium to urinary specific gravity ratio with metabolic syndrome in Korean children and adolescents: the Korea National Health and Nutrition Examination Survey 2010-2013. PLoS One 2017;12:e0189934.
crossref pmid pmc
80. Kim YM, Kim SH, Shim YS. Association of sodium intake with insulin resistance in Korean children and adolescents: the Korea National Health and Nutrition Examination Survey 2010. J Pediatr Endocrinol Metab 2018;31:117–25.
crossref pmid
81. Han SY, Kim NH, Kim DH, Han K, Kim SM. Relationship between urinary sodium-creatinine ratios and insulin resistance in Korean children and adolescents with obesity. J Pediatr Endocrinol Metab 2018;31:375–83.
crossref pmid
82. Chun YH, Han K, Kim do H, Park YG, Cho KH, Choi YS, et al. Association of urinary sodium excretion with insulin resistance in Korean adolescents: Results from the Korea National Health and Nutrition Examination Survey 2009-2010. Medicine (Baltimore) 2016;95:e3447.
crossref pmid pmc
83. Adams JS, Hewison M. Update in Vitamin D. J Clin Endocrinol Metab 2010;95:471–8.
crossref pmid pmc
84. Christakos S, Dhawan P, Porta A, Mady LJ, Seth T. Vitamin D and intestinal calcium absorption. Mol Cell Endocrinol 2011;347:25–9.
crossref pmid pmc
85. Nair R, Maseeh A. Vitamin D: The "sunshine" vitamin. J Pharmacol Pharmacother 2012;3:118–26.
pmid pmc
86. Müller DN, Kleinewietfeld M, Kvakan H. Vitamin D review. J Renin Angiotensin Aldosterone Syst 2011;12:125–8.
crossref pmid
87. Cashman KD. Vitamin D in childhood and adolescence. Postgrad Med J 2007;83:230–5.
crossref pmid pmc
88. American Academy of Pediatrics Commmittee on Nutrition. Pediatric nutrition handbook. 6th ed. Itasca (IL): American Academy of Pediatrics, 2009.

89. Gartner LM, Greer FR. Prevention of rickets and vitamin D deficiency: new guidelines for vitamin D intake. Pediatrics 2003;111:908–10.
crossref pmid
90. The Korean Nurtrition Society. Dietary refenece intakes for Koreans. Sejong (Korea): Ministry of Health and Welfare, 2015.

91. Jung SJ, Hwangbo Y, Jung JH, Kim J, Kim H, Jeong KH, et al. Recent trends in serum vitamin D Levels among Korean population: Korea National Health and Nutrition Examination Survey 2008~2014. Korean J Clin Geri 2018;19:55–62.
crossref
92. Park JH, Hong IY, Chung JW, Choi HS. Vitamin D status in South Korean population: seven-year trend from the KNHANES. Medicine (Baltimore) 2018;97:e11032.
pmid pmc
93. Byun EJ, Heo J, Cho SH, Lee JD, Kim HS. Suboptimal vitamin D status in Korean adolescents: a nationwide study on its prevalence, risk factors including cotinine-verified smoking status and association with atopic dermatitis and asthma. BMJ open 2017;7:e016409.
crossref pmid pmc
94. Lee YA, Kim HY, Hong H, Kim JY, Kwon HJ, Shin CH, et al. Risk factors for low vitamin D status in Korean adolescents: the Korea National Health and Nutrition Examination Survey (KNHANES) 2008-2009. Public Health Nutr 2014;17:764–71.
crossref pmid
95. Jang H, Lee Y, Park K. Obesity and vitamin D insufficiency among adolescent girls and young adult women from Korea. Nutrients 2019;11:3049.
crossref pmid pmc
96. Yoo HN, Kim HS. Vitamin D deficiency and Metabolic Syndrome among Korean adolescents: based on Korea National Health and Nutrition Examination Survey V (KNHANES). J Korean Soc School Health 2016;29:22–32.
crossref
97. Cho YH, Kim JW, Shim JO, Yang HR, Chang JY, Moon JS, et al. Association between vitamin D deficiency and suspected nonalcoholic fatty liver disease in an adolescent population. J Pediatr Gastroenterol Nutr 2019;22:233–41.
crossref
98. Nam GE, Kim DH, Cho KH, Park YG, Han KD, Kim SM, et al. 25- Hydroxyvitamin D insufficiency is associated with cardiometabolic risk in Korean adolescents: the 2008-2009 Korea National Health and Nutrition Examination Survey (KNHANES). Public Health Nutr 2014;17:186–94.
crossref pmid
99. Chung SJ, Lee YA, Hong H, Kang MJ, Kwon HJ, Shin CH, et al. Inverse relationship between vitamin D status and insulin resistance and the risk of impaired fasting glucose in Korean children and adolescents: the Korean National Health and Nutrition Examination Survey (KNHANES) 2009- 2010. Public Health Nutr 2014;17:795–802.
crossref pmid
100. Choi S, Seo DG, Hwang JY. Serum 25-hydroxyvitamin D levels are associated with dental caries experience in Korean adolescents: the 2010–2014 Korean National Health and Nutrition Examination Surveys. J Nutr Health 2018;51:287–94.
crossref
101. Kang JW, Kim JH, Yoon JH, Kim CH. The association between serum vitamin D level and immunoglobulin E in Korean adolescents. Int J Pediatr Otorhinolaryngol 2014;78:817–20.
crossref pmid
102. Choi J, Han K, Park Y, La T. Low serum 25-hydroxyvitamin D is associated with myopia in Korean adolescents. Invest Ophthalmol Vis Sci 2014;55:2041–7.
crossref pmid
103. Lee JA, Hwang JS, Hwang IT, Kim DH, Seo JH, Lim JS. Low vitamin D levels are associated with both iron deficiency and anemia in children and adolescents. Pediatr Hematol Oncol 2015;32:99–108.
crossref pmid
104. Wagner CL, Greer FR. Prevention of rickets and vitamin D deficiency in infants, children, and adolescents. Pediatrics 2008;122:1142–52.
crossref pmid
105. Lieu PT, Heiskala M, Peterson PA, Yang Y. The roles of iron in health and disease. Mol Aspects Med 2001;22:1–87.
crossref pmid
106. McDowell LR. Minerals in animal and human nutrition. Philadelphia (PA): Elsevier Science BV, 2003.

107. Trumbo P, Yates AA, Schlicker S, Poos M. Dietary reference intakes: vitamin A, vitamin K, arsenic, boron, chromium, copper, iodine, iron, manganese, molybdenum, nickel, silicon, vanadium, and zinc. J Am Diet Assoc 2001;101:294–301.
pmid
108. Sachdev H, Gera T, Nestel P. Effect of iron supplementation on mental and motor development in children: systematic review of randomised controlled trials. Public Health Nutr 2005;8:117–32.
crossref pmid
109. Grantham-McGregor S, Ani C. A review of studies on the effect of iron deficiency on cognitive development in children. J Nutrition 2001;131:649S–668S.
crossref
110. Iron fortification of infant formulas. American Academy of Pediatrics. Committee on Nutrition. Pediatrics 1999;104:119–23.
pmid
111. Korea Centers for Disease Control and Prevention. 2010 Korea Health Statistics [Internet]. Cheongju (Korea): Korea Centers for Disease Control and Prevention; 2018 [cited 2020 May 1]. Available from: http://www.kdca.go.kr/.

112. Lee JO, Lee JH, Ahn S, Kim JW, Chang H, Kim YJ, et al. Prevalence and risk factors for iron deficiency anemia in the Korean population: results of the fifth Korea National Health and Nutrition Examination Survey. J Korean Med Sci 2014;29:224–9.
crossref pmid pmc
113. Kim SK, Kang HS, Kim CS, Kim YT. The prevalence of anemia and iron depletion in the population aged 10 years or older. Korean J Hematol 2011;46:196–9.
crossref pmid pmc
114. Cheuh HW, Choi YC, Shin JH, Yoo JH. Family history as a risk factor for iron deficiency anemia among Korean Adolescents: Data from the Fifth Korea National Health and Nutrition Examination Survey (KNHANES). Clin Pediatr Hematol Oncol 2018;25:31–7.
crossref
115. Lee BK, Kim SH, Kim NS, Ham JO, Kim Y. Iron deficiency increases blood cadmium levels in adolescents surveyed in KNHANES 2010- 2011. Biol Trace Elem Res 2014;159:52–8.
crossref pmid
116. Sim CS, Kim Y, Lee H, Park CY, Ham JO, Lee BK. Iron deficiency increases blood lead levels in boys and pre-menarche girls surveyed in KNHANES 2010-2011. Environ Res 2014;130:1–6.
crossref pmid
117. Lee BK, Kim Y. Iron deficiency is associated with increased levels of blood cadmium in the Korean general population: analysis of 2008– 2009 Korean National Health and Nutrition Examination Survey data. Environ Res 2012;112:155–63.
crossref pmid
118. Conrad ME, Barton JC. Factors affecting the absorption and excretion of lead in the rat. Gastroenterology 1978;74:731–40.
crossref pmid
119. World Health Organization. Obesity and overweight. [Internet]. Geneva (Switzerland): World Health Organization; [cited 2020 Sep 28]. Available from: https://www.who.int/newsroom/fact-sheets/detail/obesity-and-overweight.

120. Kim JH, Moon JS. Secular trends in pediatric overweight and obesity in Korea. J Obes Metab Syndr 2020;29:12–7.
crossref pmid pmc
121. Lee HJ, Kim SH, Choi SH, Lee JS. The association between socioeconomic status and obesity in Korean children: an analysis of the Fifth Korea National Health and Nutrition Examination Survey (2010-2012). J Pediatr Gastroenterol Nutr 2017;20:186–93.
crossref
122. Lee G, Kim HR. Mothers' working hours and children's obesity: data from the Korean National Health and Nutrition Examination Survey, 2008-2010. Ann Occup Environ Med 2013;25:28.
crossref pmid pmc
123. Umer A, Kelley GA, Cottrell LE, Giacobbi P Jr, Innes KE, Lilly CL. Childhood obesity and adult cardiovascular disease risk factors: a systematic review with meta-analysis. BMC Public Health 2017;17:683.
crossref pmid pmc
124. Lee JS, Song YH. Relationship between waist circumference and cardiovascular risk factors in adolescents: analysis of the Korea National Health and Nutrition Examination Survey data. Korean Circ J 2020;50:723–32.
crossref pmid pmc
125. Morrison JA, Friedman LA, Gray-McGuire C. Metabolic syndrome in childhood predicts adult cardiovascular disease 25 years later: the Princeton Lipid Research Clinics Follow-up Study. Pediatrics 2007;120:340–5.
crossref pmid
126. Kim S, So WY. Prevalence of metabolic syndrome among Korean adolescents according to the National Cholesterol Education Program, Adult Treatment Panel III and International Diabetes Federation. Nutrients 2016;8:588.
crossref pmid pmc
127. Cho WK, Han K, Ahn MB, Park YM, Jung MH, Suh BK, et al. Metabolic risk factors in Korean adolescents with severe obesity: results from the Korea National Health and Nutrition Examination Surveys (K-NHANES) 2007-2014. Diabetes Res Clin Pract 2018;138:169–76.
crossref pmid pmc
128. Jin HY. Prevalence of subclinical hypothyroidism in obese children or adolescents and association between thyroid hormone and the components of metabolic syndrome. J Paediatr Child Health 2018;54:975–80.
crossref pmid
129. An YM, Moon SJ, Kim SK, Suh YJ, Lee JE. Thyroid function in obese Korean children and adolescents: Korea National Health and Nutrition Examination Survey 2013-2015. Ann Pediatr Endocrinol Metab 2018;23:141–7.
crossref pmid pmc
130. Kim HY, Jung HW, Hong H, Kim JH, Shin CH, Yang SW, et al. The role of overweight and obesity on bone health in Korean adolescents with a focus on lean and fat Mass. J Korean Med Sci 2017;32:1633–41.
crossref pmid pmc
131. Julia V, Macia L, Dombrowicz D. The impact of diet on asthma and allergic diseases. Nat Rev Immunol 2015;15:308–22.
crossref pmid
132. Hancu A, Mihaltan F, Radulian G. Asthma and ultra-processed food. Maedica (Buchar) 2019;14:402–7.

133. Mustapa Kamal Basha MA, Majid HA, Razali N, Yahya A. Risk of eczema, wheezing and respiratory tract infections in the first year of life: a systematic review of vitamin D concentrations during pregnancy and at birth. PLoS One 2020;15:e0233890.
crossref pmid pmc
134. Tian Y, Tian Q, Wu Y, Peng X, Chen Y, Li Q, et al. Vitamin A supplement after neonatal Streptococcus pneumoniae pneumonia inhibits the progression of experimental asthma by altering CD4(+)T cell subsets. Sci Rep 2020;10:4214.
crossref pmid pmc
135. Zhang Z, Shi L, Pang W, Liu W, Li J, Wang H, et al. Dietary fiber intake regulates intestinal microflora and inhibits ovalbumin-induced allergic airway inflammation in a mouse model. PLoS One 2016;11:e0147778.
crossref pmid pmc
136. Wendell SG, Baffi C, Holguin F. Fatty acids, inflammation, and asthma. J Allergy Clin Immunol 2014;133:1255–64.
crossref pmid pmc
137. Tashiro H, Takahashi K, Sadamatsu H, Kato G, Kurata K, Kimura S, et al. Saturated fatty acid increases lung macrophages and augments house dust mite-induced airway inflammation in mice fed with high-fat diet. Inflammation 2017;40:1072–86.
crossref pmid
138. Greer FR, Sicherer SH, Burks AW. The effects of early nutritional interventions on the development of atopic disease in infants and children: the role of maternal dietary restriction, breastfeeding, hydrolyzed formulas, and timing of introduction of allergenic complementary foods. Pediatrics 2019;143:e20190281.
crossref pmid
139. Netting MJ, Campbell DE, Koplin JJ, Beck KM, McWilliam V, Dharmage SC, et al. An Australian consensus on infant feeding guidelines to prevent food allergy: outcomes from the Australian Infant Feeding Summit. J Allergy Clin Immunol Pract 2017;5:1617–24.
crossref pmid
140. Togias A, Cooper SF, Acebal ML, Assa'ad A, Baker JR Jr, Beck LA, et al. Addendum guidelines for the prevention of peanut allergy in the United States: report of the National Institute of Allergy and Infectious Diseasessponsored expert panel. J Allergy Clin Immunol 2017;139:29–44.
crossref pmid pmc
141. Boyle RJ, Ierodiakonou D, Khan T, Chivinge J, Robinson Z, Geoghegan N, et al. Hydrolysed formula and risk of allergic or autoimmune disease: systematic review and meta-analysis. BMJ 2016;352:i974.
crossref pmid pmc
142. Lodge CJ, Tan DJ, Lau MX, Dai X, Tham R, Lowe AJ, et al. Breastfeeding and asthma and allergies: a systematic review and metaanalysis. Acta Paediatr 2015;104:38–53.
crossref
143. Jung M, Kim J, Ahn SM. Factors associated with frequency of peanut consumption in Korea: a national population-based study. Nutrients 2020;12:1207.
crossref pmid pmc
144. Lee KS, Rha YH, Oh IH, Choi YS, Kim YE, Choi SH. Does breastfeeding relate to development of atopic dermatitis in young Korean children? Based on the fourth and fifth Korea National Health and Nutrition Examination Survey 2007-2012. Allergy Asthma Immunol Res 2017;9:307–13.
crossref pmid pmc
145. Kull I, Böhme M, Wahlgren CF, Nordvall L, Pershagen G, Wickman M. Breast-feeding reduces the risk for childhood eczema. J Allergy Clin Immunol 2005;116:657–61.
crossref pmid
146. Gdalevich M, Mimouni D, David M, Mimouni M. Breast-feeding and the onset of atopic dermatitis in childhood: a systematic review and meta-analysis of prospective studies. J Am Acad Dermatol 2001;45:520–7.
crossref pmid
147. Kramer MS, Kakuma R. Optimal duration of exclusive breastfeeding. Cochrane Database Syst Rev 2012;2012:Cd003517.
crossref pmid pmc
148. Kim M, Youn C, Kim A, Ko H, Kim H, Kim H, et al. Food habits and allergic disease in Korean adolescent. Korean J Fam Pract 2017;7:179–87.
crossref
149. Kang SY, Song WJ, Kim MH, Kim SH, Cho SH, Chang YS, et al. Dietary assessment and the development of asthma in Korean adolescents and adults. Allergy 2018;73:2254–6.
crossref pmid
150. Patel S, Custovic A, Smith JA, Simpson A, Kerry G, Murray CS. Cross-sectional association of dietary patterns with asthma and atopic sensitization in childhood - in a cohort study. Pediatr Allergy Immunol 2014;25:565–71.
crossref pmid
151. Jaworowska A, Blackham T, Davies IG, Stevenson L. Nutritional challenges and health implications of takeaway and fast food. Nutr Rev 2013;71:310–8.
crossref pmid
152. Venter C, Meyer RW, Nwaru BI, Roduit C, Untersmayr E, Adel-Patient K, et al. EAACI position paper: influence of dietary fatty acids on asthma, food allergy, and atopic dermatitis. Allergy 2019;74:1429–44.
crossref pmid
153. Rodríguez-Rodríguez E, Perea JM, Jiménez AI, Rodríguez-Rodríguez P, López-Sobaler AM, Ortega RM. Fat intake and asthma in Spanish schoolchildren. Eur J Clin Nutr 2010;64:1065–71.
crossref pmid
154. Kim SY, Sim S, Park B, Kong IG, Kim JH, Choi HG. Dietary habits are associated with school performance in adolescents. Medicine (Baltimore) 2016;95:e3096.
crossref pmid pmc
155. Park S, Lee J. Factors influencing the consumption of convenience foods among Korean adolescents: analysis of data from the 15th (2019) Korea Youth Risk Behavior Web-based Survey. J Nutr Health 2020;53:255.
crossref
156. Nakitto M, Asano K, Choi I, Yoon J. Dietary intakes of adolescents from food insecure households: analysis of data from the 6(th) (2013-2015) Korea National Health and Nutrition Examination Survey. Nutr Res Pract 2017;11:507–16.
crossref pmid pmc
157. Hong N, Lee YK, Rhee Y. Familial clustering of vitamin D deficiency via shared environment: The Korean National Health and Nutrition Examination Survey 2008–2012. Eur J Clin Nutr 2018;72:1700–8.
crossref pmid
158. Oh HL, Lee JA, Kim DH, Lim JS. Reference values for serum ferritin and percentage of transferrin saturation in Korean children and adolescents. Blood Res 2018;53:18–24.
crossref pmid pmc
159. Lim JS, Seo JH, Kim DH, Lee JA. The hemoglobin values of Korean adolescents show distinctive characteristics in comparison to those of Caucasians and African Americans. Pediatr Blood Cancer 2015;62:409–13.
crossref pmid
160. Jung DW, Park JH, Kim DH, Choi M, Kim S, Kim H, et al. Association between serum ferritin and hemoglobin levels and bone health in Korean adolescents: a nationwide population-based study. Medicine 2017;96:e9403.
crossref pmid pmc
161. Hong J, Chang JY, Shin S, Oh S. Breastfeeding and red meat intake are associated with iron status in healthy Korean weaning-age infants. J Korean Med Sci 2017;32:974–84.
crossref pmid pmc
162. Shin YY, Ryu IK, Park MJ, Kim SH. The association of total blood mercury levels and overweight among Korean adolescents: analysis of the Korean National Health and Nutrition Examination Survey (KNHANES) 2010–2013. Clin Exp Pediatr 2018;61:121–8.
crossref
163. Kang M, Yoo JE, Kim K, Choi S, Park SM. Associations between birth weight, obesity, fat mass and lean mass in Korean adolescents: the Fifth Korea National Health and Nutrition Examination Survey. BMJ Open 2018;8:e018039.
crossref pmid pmc
164. Park SH, Park YE, Lee J, Choi JH, Heo NY, Park J, et al. The change in prevalence of suspected non-alcoholic fatty liver disease in Korean adolescents from 2001 to 2017. Paediatr Int Child Health 2020;40:166–70.
crossref pmid
165. Lee JH. Prevalence of hyperuricemia and its association with metabolic syndrome and cardiometabolic risk factors in Korean children and adolescents: analysis based on the 2016-2017 Korea National Health and Nutrition Examination Survey. Korean J Pediatr 2019;62:317–23.
crossref pmid pmc
166. Kim M, Choi S, Choi SH, Shin SH, Kim SK, Shim YS, et al. Metabolic syndrome and lung function in Korean children and adolescents: a crosssectional study. Sci Rep 2019;9:15646.
crossref pmid pmc
167. Kim YM, Kim SH, Shim YS. Associations of non-high-density lipoprotein cholesterol with metabolic syndrome and its components in Korean children and adolescents: the Korea National Health and Nutrition Examination Surveys 2008-2014. World J Pediatr 2018;14:461–9.
crossref pmid
168. Choi DH, Hur YI, Kang JH, Kim K, Cho YG, Hong SM, et al. Usefulness of the waist circumference-to-height ratio in screening for obesity and metabolic syndrome among Korean children and adolescents: Korea National Health and Nutrition Examination Survey, 2010-2014. Nutrients 2017;9:256.
crossref pmid pmc
169. Yoon DY, Lee YA, Lee J, Kim JH, Shin CH, Yang SW. Prevalence and clinical characteristics of metabolically healthy obesity in Korean children and adolescents: data from the Korea National Health and Nutrition Examination Survey. J Korean Med Sci 2017;32:1840–7.
crossref pmid pmc
170. Chung IH, Park S, Park MJ, Yoo EG. Waist-to-height ratio as an index for cardiometabolic risk in adolescents: results from the 1998-2008 KNHANES. Yonsei Med J 2016;57:658–63.
crossref pmid pmc
171. Yu Y, Song Y. Three clustering patterns among metabolic syndrome risk factors and their associations with dietary factors in Korean adolescents: based on the Korea National Health and Nutrition Examination Survey of 2007-2010. Nutr Res Pract 2015;9:199–206.
crossref pmid
172. Kim J. Relation of polyunsaturated fatty acid, n-3 fatty acid and n-6 fatty acid intakes and atopic dermatitis in the 9–11 year old children: KNHANES 2013 ~ 2015. J Nutr Health 2019;52:47–57.
crossref
173. Kim SY, Sim S, Park B, Kim JH, Choi HG. High-fat and lowcarbohydrate diets are associated with allergic rhinitis but not asthma or atopic dermatitis in children. PLoS One 2016;11:e0150202.
crossref pmid pmc
METRICS Graph View
  • 4 Web of Science
  • 4 Crossref
  • 4 Scopus
  • 13,007 View
  • 359 Download