


Introduction
Necrotizing enterocolitis (NEC) is one of the most serious complications of prematurity, with a prevalence of 7% in very low birth weight infants and mortality between 20% and 30% [1]. The high rate of morbidity and mortality is due to the multifactorial pathogenesis of NEC. There is no a clear mechanism involved as a cause of NEC, only several factors that contributes to it [2]. These factors include undeveloped gastrointestinal mucosal barrier, immature innate and humoral immunity, uncoordinated GIT movement, and the overgrowth of pathogenic bacteria [3]. There are many risk factors can contribute to the development of NEC as prematurity, formula feeding, hypoxic-ischemic insult, and abnormal bacterial colonization of the gut. Yet, no single risk factor is crucial, and the mechanisms by which they precipitate NEC are mostly unclear [4]. Initial management of NEC is generally supportive and includes stopping enteric feedings and providing total parenteral nutrition, continuous nasogastric suctioning with intestinal decompression, and administration of broad-spectrum antibiotics [5]. NEC occurs with variety of severity ranging from a mild form that improves with antibiotics and discontinuation of oral feedings (medical NEC) to a severe form that leads to intestinal perforation, peritonitis, and eventually death [6]. Approximately 20%ŌĆō40% of all infants diagnosed with NEC require surgical intervention [7]. Many studies had have attempted to find out biomarkers for the early detection of NEC [8]. Epidermal growth factor (EGF) is a 50-kDa multifunctional protein that has antiangiogenic, antitumorigenic and neurotrophic functions [9]. It belongs to a vast family of peptides (transforming growth factor-alpha, amphiregulin, heparin-binding EGF, epiregulin, betacellulinn and neuroregulin, among others) which provoke a variety of biological responses in the gastrointestinal tract, the majority of which involve regulation of cell replication and cell movement and survival. Also, it enhances the proliferation and differentiation of epithelial cells [10].
The aim of this study was to assess the relation between EGF serum level and the development of NEC in preterm neonates.
Materials and methods
This study was conducted between March 2015 and April 2017. One hundred thirty preterm neonates were included in the study and were divided into 3 groups; group 1 (40 preterms with NEC), group 2 (50 preterms with sepsis), and group 3 (40 healthy preterms as normal controls). Patient inclusion was established by the presence of signs specific for NEC by modified BellŌĆÖs criteria [11] or, for the sepsis group, by either clinical evidence of sepsis and/or positive blood cultures. Preterms with history of previous abdominal surgery, or a known congenital anomaly of the gastrointestinal tract or abdominal wall were excluded from the study. All included subjects were subjected to (1) full history taking stressing on gestational age (GA), sex, obstetrical history (mode of delivery), obstetrical problems placenta abnormalities, premature rupture of membranes, etc., (2) clinical examination including: general examination, local, physical examination and measurements (weight, length), and vital signs. Laboratory investigations included C-reactive protein (CRP), complete blood picture with differential counts, blood culture, sensitivity, and serum EGF levels. Erect abdominal X-ray and abdominal ultrasonography were done to cases with NEC then NEC group was divided accordingly to 2 subgroups (surgical NEC and medical NEC). To perform the multiple regression tests the included neonates are divided into 2 groups; group 1 patients without NEC, group 2 patients with NEC
The local ethical committee of Beni-Suef University Hospital approved the study protocol (approval number: 187-36) and a written consent was obtained from caregivers of the included neonates.
1. Group definitions
(1) NEC group: preterm neonates fulfilling at least stage IIA modified BellŌĆÖs criteria; (2) Surgical NEC group: patients with radiographic evidence of pneumoperitoneum or physiologic deterioration despite maximal medical therapy that necessitates laparotomy; (3) Sepsis group: preterms with the clinical evidence of sepsis (poor activity, temperature instability etc.) with high CRP levels and positive blood picture without evidence of NEC according to modified BellŌĆÖs criteria; (4) Control group: Healthy preterms who did not require incubator admission or admitted without clinical or laboratory evidence of sepsis.
2. Samples collection
A volume of 3 mL of venous blood was drawn from each neonate under complete aseptic conditions and divided into 2 tubes. The first tube contained EDTA for evaluating complete blood cell and the second tube was left in the incubator for 30 minutes, centrifuged at 3,000 rpm for 10 minutes and then the separated serum was stored at -80┬░C till the end of the study to evaluate the other laboratory parameters. EGF was assayed by using EGF ELISA Kit (E-EL-H1875, Elabscience Biotechnology Inc., Houston, TX, USA).
3. Statistical methods
Statistical analysis was done using IBM SPSS Statistics ver. 22.0 (IBM Co., Armonk, NY, USA). Data were described in the form of median and interquartile range (IQR) for quantitative data, and frequency and proportions for qualitative data. A P value <0.05 was considered statistically significant. Differences were analyzed between the groups by nonparametric test (median test for k samples). Binary logistic regression test was used to determine the relation between variables. Correlations were analyzed by Spearman correlation coefficient test. The receiver operating characteristics (ROC) curve analysis was performed to identify the optimal cutoff value for EGF level distinguishing between the cases with NEC and sepsis.
Results
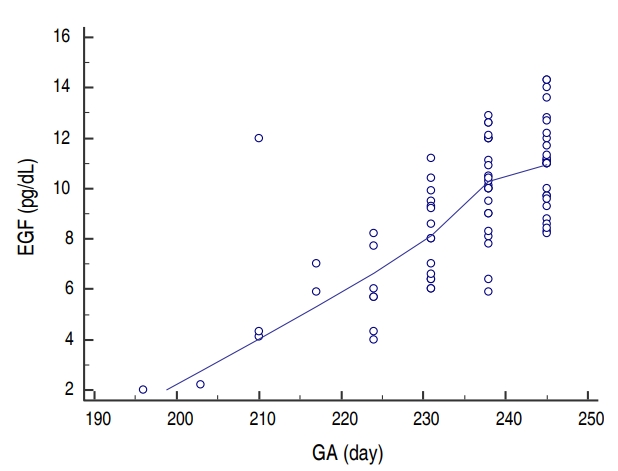
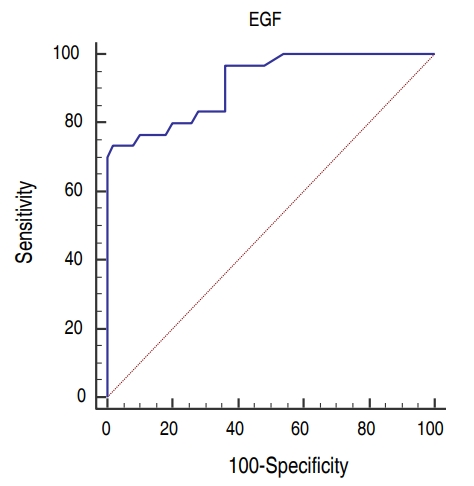
There was no difference between the groups as regarding gender and GA. Age and body weight were significantly higher in control group than sepsis and NEC groups but no difference between sepsis and NEC groups. Hemoglobin levels and TLC were statistically insignificant between the 3 groups while NEC group had lower platelets levels than other groups. CRP was significantly higher in sepsis and NEC groups as compared to controls. EGF was significantly lower in the sera of NEC group (median [IQR], 9.6 [2ŌĆō14]) as compared to both sepsis (median [IQR], 10.1 [8ŌĆō14]) and control (median [IQR], 11.2 [8ŌĆō14]) groups and there was no difference between control and sepsis groups (Table 1). Blood culture was positive in 100% of cases with sepsis while it was positive in 87% in NEC group. Sixty-two percent (25 cases) of NEC group had medical NEC while surgical NEC was reported in 38% (15 cases). On comparing medical and surgical NEC groups; GA, age, and body weight were significantly lower in surgical NEC group. EGF levels were lower in surgical NEC but it was statistically insignificant (Table 2). Binary logistic regression test was run to predict NEC based on EGF, GA, and sex. These variables statistically significantly predicted NEC, Žć2 (3, 130)=63.5, P<0.001, R2=0.75. There was a significant negative association between both EGF and GA as predictors of the development of NEC (╬▓=-1.3, P< 0.001) and (╬▓=-0.14, P=0.009) respectively. Sex has no influence on the prediction of development of NEC (Table 3). There was strong significant positive correlation between EGF and GA (r=0.7, P<0.001) (Fig. 1). ROC curves were used to define the possible value of serum EGF level below which NEC is highly suspected to occur. The area under the ROC curve of serum EGF levels was 0.92 (95% confidence interval, 0.83ŌĆō0.97). The analysis rendered an optimal cutoff value of 8 pg/mL corresponding to 73.3% sensitivity and 98% specificity with positive predictive value (PV) of 95% and negative PV of 86.7 % (Fig. 2).
Discussion
The aim of this study was to assess the relation between EGF serum level and the development of NEC in preterm neonates and we found that patients with NEC had significantly lower serum levels of EGF indicating that EGF could be a reliable predictor of NEC in preterm neonates. The ultimate course of NEC cannot be predicted based on the clinical features alone so, efforts has been done for the identification of early biomarkers for NEC [11]. EGF is a protein secreted by the salivary glands, kidneys, liver, Brunner's glands of the duodenum, and Paneth cells of the small intestine [12]. EGF stimulates a variety of biologic responses, such as cell replication, cell movement, and cell survival [13]. EGF plays a major role in the intestinal barrier function, increases intestinal enzyme activity, and improves nutrient transport [14]. Many experimental studies had demonstrated the role of EGF as a regulator of epithelial paracellular permeability [15] and goblet cell and mucin production in the intestinal epithelium [16]. EGF also acts as a bacterial colonization inhibitor [17]. In our study, we found that patients with NEC had significantly lower serum levels of EGF than the other 2 groups indicating the critical role of EGF in maintaining the integrity and function of the intestinal wall and its deficiency contributes to the development of NEC in preterm newborns. Meanwhile, the absence of a significant difference between the sepsis group and healthy controls proves that EGF is not just a marker of a proinflammatory state and it is a specific marker for NEC. In addition, we found that EGF and GA had a significant negative association with NEC indicating that low EGF levels and smaller GA are significant risk factors for the development of NEC. Shin et al. [18] reported in their study that premature neonates with NEC have diminished levels of EGF in serum and saliva compared with healthy controls. The emerging need for early detection of NEC for early management and prevention of complications makes EGF a good marker for early detection of NEC. Despite statistically insignificant, the lower levels of EGF in surgical NEC group make it also a possible indicator for the course of the disease and disease severity. Our finding of strong positive correlation between EGF level and GA is in agreement with Hofmann and Abramowicz [19] who found that amniotic fluid contains significant concentrations of EGF that gradually increase during pregnancy, with the highest level achieved at the end of the normal gestation period explaining the association between NEC and prematurity. In this study, results showed that, using a cutoff value of <8 pg/mL, serum EGF level can be used to predict the development of NEC with an AUC of 0.92 and an optimized sensitivity of 73.3% and specificity of 98% with positive PV of 95% making EGF a reliable biomarker for the diagnosis of NEC.
The main strength of this study is that we have included patients with a relatively larger number of preterm neonates suffering of NEC as compared to some previous studies
Our study has some limitations. First, no comparison was made between EGF and other inflammatory markers (as erythrocyte sedimentation rate and procalcitonin). Second, single measurement of EGF levels was done, so serial measurement of EGF might be more useful.
In conclusion, our study highlights the role of EGF in NEC. EGF may be considered a reliable marker for NEC that could help in identifying diseased neonates. A value lower than 8 pg/L should raise the suspicion of NEC.
 PDF Links
 PubReader
 ePub Link
 PubMed
 Download Citation


