


Introduction
Kawasaki disease (KD) is the most common cause of acquired cardiac disease in children. It can cause systemic vasculitis and lead to serious coronary complications.
Although high-dose intravenous immunoglobulin (IVIG) treatment in the acute stage of KD has shown to be effective, 10% to 20% of patients are resistant to initial IVIG treatment. These patients are at the greatest risk of developing coronary artery aneurysm, coronary artery stenosis, myocardial infarction and other serious complications1).
IVIG resistance is defined as needing second dose of IVIG because of persistent or recrudescent fever, despite initial IVIG treatment. Recent studies have investigated factors for predicting resistance to IVIG for KD, but their results have been conflicting.
The aim of this study was to find laboratory factors predicting resistance to high-dose IVIG for KD by searching PubMed and performing meta-analysis on the data using statistical techniques.
Materials and methods
All relevant scientific publications were identified through PubMed searches. Search terms included "Kawasaki disease, IVIG resistance" or "IVIG resistant Kawasaki disease" combined with a second identifying phrase, "predictive factors or risk factors" Studies spanned the period from 2006 to 2014. Before including a study in our meta-analysis, we applied several inclusion and exclusion criteria.
1. Inclusion criteria
To be included in the meta-analysis of this study, all articles had to meet the following criteria:
(1) Retrospective or prospective cohort study design investigating KD.
(2) A population focus on children (aged 0–18 years) receiving IVIG therapy within a hospital setting.
(3) Study reporting on one of the identified predictive factors of IVIG resistance or a combination thereof: white blood cell count, polymorphonuclear leukocyte (PMN), platelet count, erythrocyte sedimentation rate (ESR), C-reactive protein (CRP), pro-brain natriuretic peptide (pro-BNP), total bilirubin aspartate aminotransferase (AST), alanine aminotransferase (ALT), albumin, sodium.
(4) Laboratory values before IVIG therapy compared in each group; variables before IVIG compared between groups.
(5) Kawasaki disease diagnosed according to the criteria published by the American Heart Association in 2004.
2. Exclusion criteria
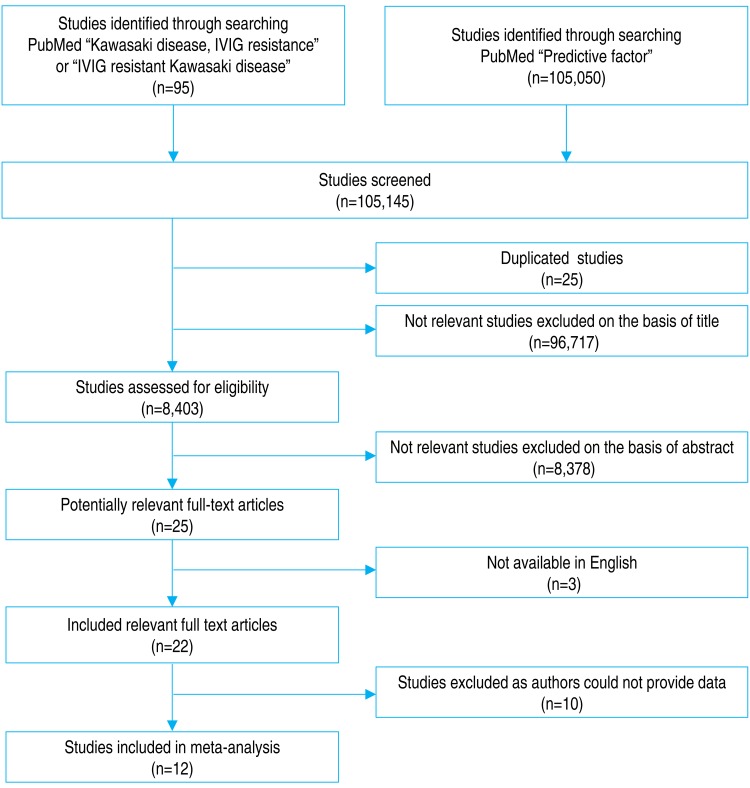
We excluded studies by title, then abstract, then full text. Exclusion criteria included papers that were not available in English. Initially, 25 abstracts were excluded owing to duplications, leaving 8,403 abstracts to be reviewed. Three abstracts were excluded because they were not available in English.
A total of 96,717 abstracts were excluded because the topic did not include KD. Another 10 studies were excluded because their authors could not provide data. Details of the abstract review process are presented in, a flow diagram (Fig. 1).
3. Statistics
Meta-analysis was performed using the comprehensive meta-analysis software (Biostat, Englewood, NJ, USA). Heterogeneity was quantified using the I2 test, which describes the percentage of total variation across the studies that is the result of heterogeneity rather than chance. In the absence of heterogeneity, studies were combined using the Mantel-Haenszel fixed or random effects method of meta-analysis. If visual inspection of the forest plot or a high I2 value suggested heterogeneity, potential causes were explored using subgroup analyses, mixed-effects (fixed or random) models, and by looking for methodological differences between the studies. If no explanation could be found, random effects meta-analysis was performed.
In addition, the Q test was performed to determine whether studies were homogenous:
where Wi = investment. In the formula for weight (1/Vi), Yi = the effect size of the study, M = the overall effect size, k = the number of investment.
In this study, we calculated the "standardized mean difference" effect size (d). Calculation of normalized average difference effect of (d) the size and distribution (Vd) is as follows: the investment.
R was the correlation coefficient between the pre and post mean average presented in the paper analyzed. All summary effects were presented with a 95% confidence interval (CI).
Results
Our review included data from 2,735 patients comprising; 12 randomized controlled studies reporting patient cohort sizes from 77 to 1,177. Studies were published over the period from 2006 to 2014, and took place across 4 countries, with the largest number of studies originating from South Korea, Japan, United States, China, and Taiwan (1–5 studies each). These studies' characteristics are summarized in Tables 1 and 2.
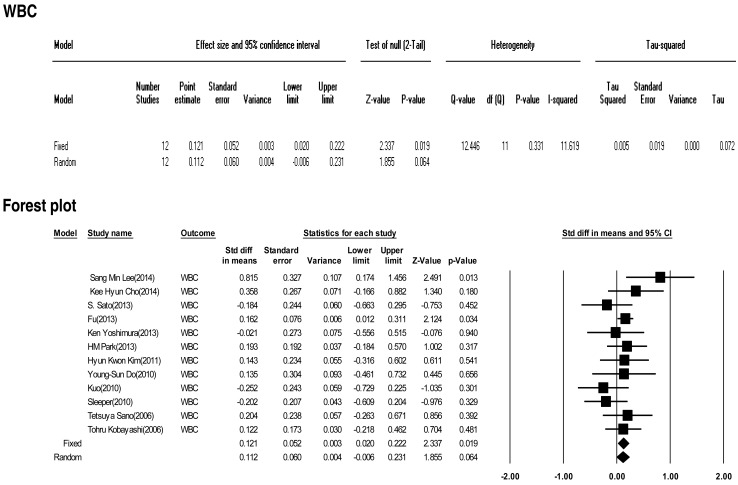
1. Effect size of white blood cells
Twelve included studies calculated the effect size of the white blood cell as predictive factors of IVIG-resistant KD. No significant heterogeneity of these studies was observed (Q=12.446, P>0.001, I2=11.619). Meta-analysis demonstrated a small effect size for white blood cells (fixed effects, 0.121; 95% CI, 0.02–0.222; z=2.337; P=0.019). Therefore, this factor had no effect in our analysis (Fig. 2).
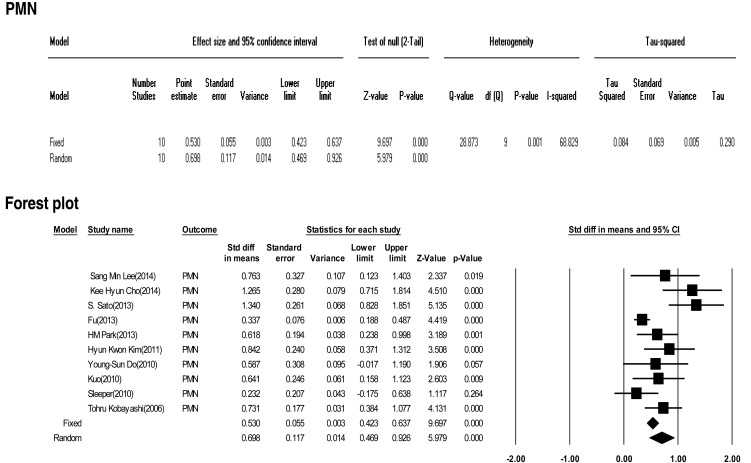
2. Effect size of PMNs
Ten included studies calculated the effect size of PMNs as a predictive factor of IVIG-resistant KD. However, heterogeneity of these studies was significant (Q (9)=28.873, P<0.001, I2=68.829). Meta-analysis demonstrated a significant effect size for PMN (random effects, 0.698; 95% CI, 0.469–0.926; z=5.979; P<0.001). Therefore, we conclude that PMN had an effect (Fig. 3).
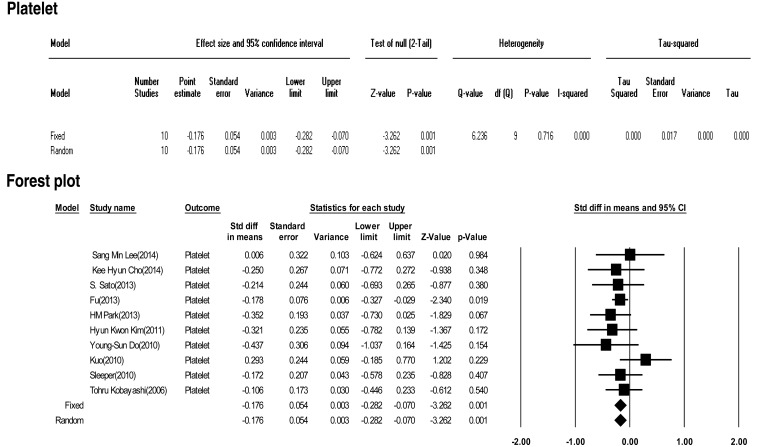
3. Effect size of platelets
Ten included studies calculated the effect size of platelets as predictive factors of IVIG-resistant KD. No significant heterogeneity was observed among the studies (Q (9) =6.236, P>0.001, I2<0.0001). Meta-analysis demonstrated a small effect size in the platelet (fixed effects, –0.176; 95% CI, –0.282 to –0.070; z=–3.262; P=0.001). Therefore, we conclude that platelets had no effect (Fig. 4).
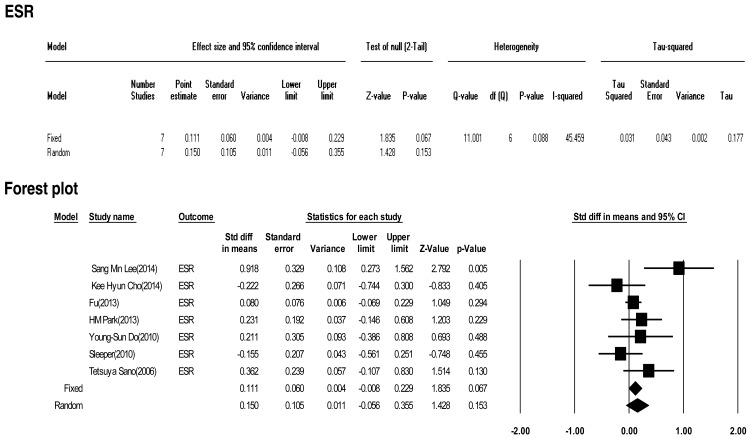
4. Effect size of ESR
Seven included studies calculated the effect size of ESR as a predictive factor of IVIG-resistant KD. Heterogeneity among these studies was low (Q (6)=11.001, P>0.001, I2=45.459). Meta-analysis demonstrated a small effect size for ESR (random effects, 0.150; 95% CI, –0.056 to 0.355; z=1.428; P=0.153). Therefore, ESR showed no effect (Fig. 5).
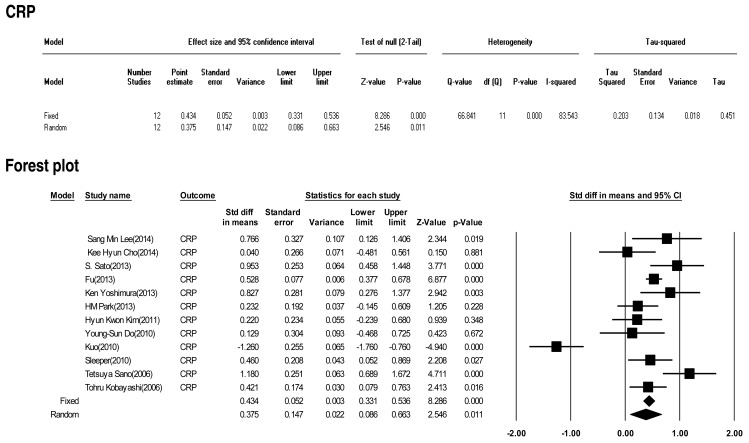
5. Effect size of CRP
Twelve included studies calculated the effect size of CRP as a predictive factor of IVIG-resistant KD. However, heterogeneity among these studies was significant (Q (11)=66.841 P<0.001, I2=85.543). Meta-analysis demonstrated a significant effect size for CRP (random effects, 0.375; 95% CI, 0.086–0.663; z=2.546; P=0.011). Therefore, CRP did show an effect (Fig. 6).
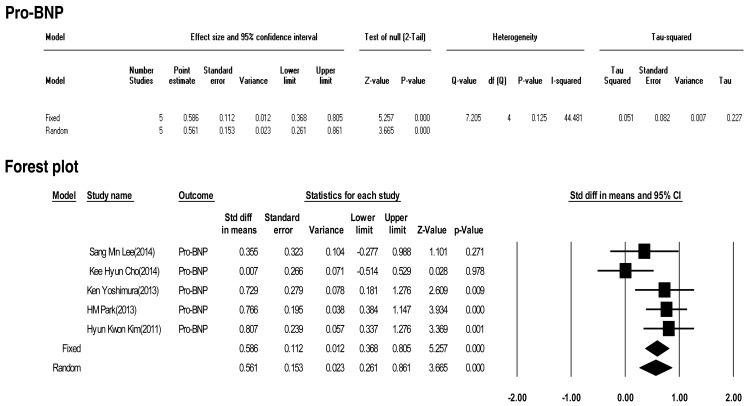
6. Effect size of Pro-BNP
Five included studies calculated the effect size of pro-BNP as a predictive factor of IVIG-resistant KD. Heterogeneity among these studies was low (Q (4)=7.205, P>0.001, I2=44.481). Meta-analysis demonstrated a significant effect size for pro-BNP (random effects, 0.561; 95% CI, 0.261–0.861; z=3.665; P<0.001). Therefore, pro-BNP did have an effect (Fig. 7).
7. Effect size of total bilirubin
Seven included studies calculated the effect size of total bilirubin as a predictive factor of IVIG-resistant KD. However, heterogeneity among these studies was significant (Q (7)=28.015, P<0.001, I2=75.014). Meta-analysis demonstrated a significant effect size for total bilirubin (random effects, 0.859; 95% CI, 0.582–1.136; z=6.081; P<0.001). Therefore, total bilirubin had the greatest effect (Fig. 8).
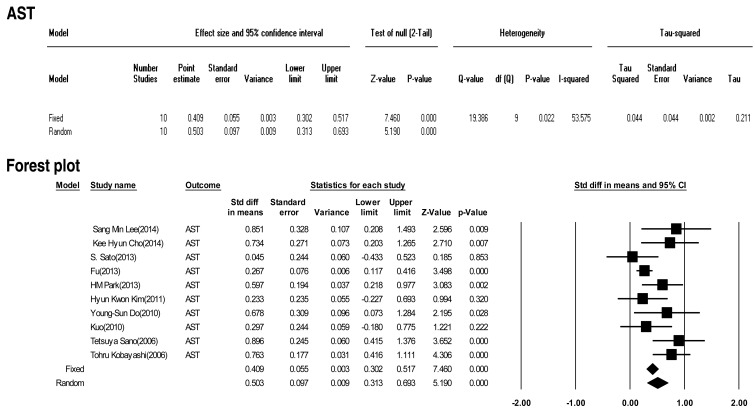
8. Effect size of AST
Ten included studies calculated the effect size of AST as a predictive factor of IVIG-resistant KD. Heterogeneity among these studies was significant (Q (9)=19.386 P<0.001, I2=53.575). Meta-analysis demonstrated a significant effect size for AST (random effects, 0.503; 95% CI, 0.313–0.693; z=5.190; P<0.001). Therefore, AST had an effect (Fig. 9).
9. Effect size of ALT
Ten included studies calculated the effect size of ALT as a predictive factor of IVIG-resistant KD. Heterogeneity among these studies was low (Q (9)=14.224, P>0.001, I2=36.728). Meta-analysis demonstrated a significant effect size for ALT (random effects, 0.436; 95% CI, 0.275–0.597; z=5.303; P<0.001). Therefore, ALT had an effect (Fig. 10).
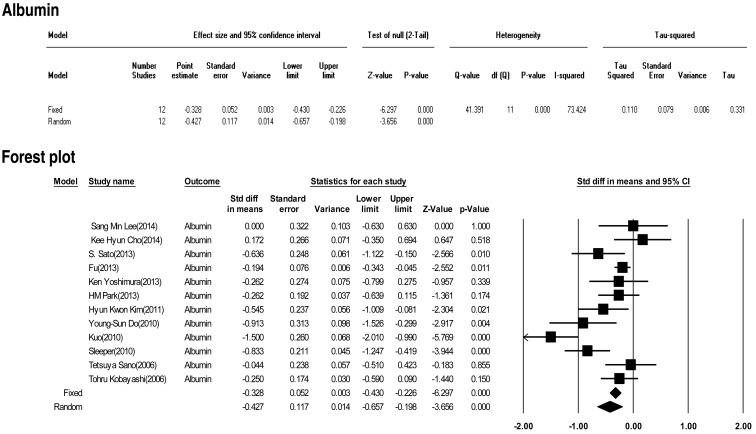
10. Effect size of albumin
Twelve included studies calculated the effect size of albumin as a predictive factor of IVIG-resistant KD. Heterogeneity among these studies was significant (Q (11)=41.391, P<0.001, I2=73.424). Meta-analysis demonstrated a significant effect size for albumin (random effects, –0.427; 95% CI, –0.657 to –0.198; z=–3.656; P<0.001). Therefore, albumin had an effect (Fig. 11).
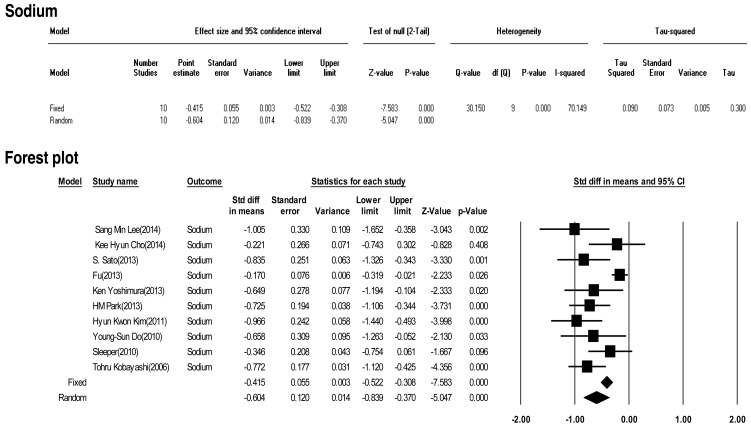
11. Effect size of sodium
Ten included studies calculated the effect size of sodium as a predictive factor of IVIG-resistant KD. Heterogeneity among these studies was significant (Q (9)=30.15, P<0.001, I2=70.149). Meta-analysis demonstrated a significant effect size for sodium (random effects, –0.604; 95% CI, –0.839 to –0.370; z=–5.047; P<0.001). Therefore, sodium had an effect (Fig. 12).
Discussion
Some patients with KD fail initial IVIG therapy for reasons that are not clear. Retrospective studies have identified potential factors that predict which patients will require further therapy for refractory disease. The presence of one or more of these risk factors for treatment failure should alert clinicians to an increased likelihood that the patient may not respond adequately to the initial IVIG therapy. The ability to predict a lack of response to IVIG before initiating therapy, would allow clinicians to identify these patients because they might benefit from more aggressive treatment.
Several previous studies have published data that could be used for predicting nonresponse to IVIG therapy and patients who are at high risk for coronary artery lesions (CALs)2,3,4,5,6,7,8,9,10,11,12,13). These data include duration of fever, male sex, serum CRP, ESR level, white blood cell count, PMN cell count, hemoglobin, platelet count, transaminase, total bilirubin and pro-BNP, albumin, and sodium levels. However, these studies did not have consistent results, and no single marker proved to be indicative of KD patients who were resistant to IVIG therapy.
In one such study, Kuo et al.10) reported a univariate analysis of 131 patients. This analysis showed that patients who had initial findings of high neutrophil count, abnormal liver function, low serum albumin level and pericardial effusion were at risk for IVIG treatment failure. Multivariate analysis using a logistic regression procedure showed that serum albumin level (≤2.9 g/dL) was an independent predictive factor of IVIG resistance in patients with KD (P=0.006; odds ratio, 40; 95% CI, 52.8–562). In another study, Sano et al.12) reported a univariate analysis of pre-IVIG data from 112 patients showed that the neutrophil count and serum levels of CRP, total bilirubin, AST, ALT, and lactate dehydrogenase were significantly higher in IVIG-nonresponder than in IVIG-responsive patients. A multivariate analysis selected CRP (P=0.009), total bilirubin (P=0.001), and AST (P=0.002) as independent predictors of nonresponsiveness to initial IVIG treatment. After defining predictive values, patients with at least 2 of 3 predictors (CRP≥7.0 mg, total bilirubin≥0.9 mg, or AST≥200 IU/L) were considered to be non-responsive to IVIG for acute KD. Kobayashi et al.13) reported risk predictors such as day of illness at initial treatment, age in months, percentage of white blood cells representing neutrophils, platelet count, and serum AST, sodium, and CRP. Tremoulet et al.14) mentioned high percentage band cell count, long illness day, high gamma-glutamyl transferase, and low age-adjusted hemoglobin as factors for predicting risk of IVIG-nonresponse. Park et al.7) reported that elevated ALT and total bilirubin levels were significant in the IVIG-resistant group. Yoshimura et al.6) reported that 19 of 80 patients developed CAL, despite IVIG administration. These patients had a significantly higher serum N-terminal (NT)-pro-BNP level than patients who did not develop CAL. The NT-pro-BNP cutoff value of 1,300 pg/mL yielded a sensitivity of 95% and a specificity of 85% for predicting CAL. However, 17 of the 80 patients were IVIG nonresponders who also had significantly higher serum NT-pro-BNP than the IVIG responders. The NT-pro-BNP cutoff value of 800 pg/mL yielded a sensitivity of 71% and a specificity of 62% for predicting IVIG nonresponders.
The previous studies had limitations, such as the number of IVIG-nonresponders being too small to represent a sample. In addition, no consensus on risk factors has been reached. Many studies of such risk factors were conducted in Japanese patients, and a scoring system for predicting IVIG-nonresponders using various parameters was proposed. However, when these risk-scoring systems were applied to subjects from other ethnic groups, specificity was high but sensitivity was low, so they had difficulty in screening out high-risk patients11). In this meta-analysis, we included studies from South Korea, China, Taiwan, and United States, in addition to Japan.
In this study, we calculated the "standardized mean difference" effect size for various predictive factors. According to one standard proposed by Cohen15), small effect size=0.3, medium effect size=0.5, and large effect size=0.8. Our meta-analysis demonstrated significant effect sizes for PMN (0.698), CRP (0.375), pro-BNP (0.561), total bilirubin (0.859), AST (0.503), ALT (0.436), albumin (-0.427), sodium (-0.604). Based on the results of this study, we found several predictors (PMN count, CRP, pro-BNP, total bilirubin, AST, ALT, albumin, sodium) for IVIG-resistant KD. In particular, total bilirubin, PMN, sodium, pro-BNP, and AST demonstrated greater than medium effects in descending numerical order.
Earlier and more effective primary therapy in patients who are predicted to be nonresponsive to IVIG might reduce their risk of coronary artery complications. Combining initial therapy with IVIG as usual plus another agent may be a feasible choice for patients who are predicted to have IVIG-resistant KD. At present, controversy remains about whether combination therapy is associated with a better outcome in these patients1).
It may be also important to determine the effectiveness of IVIG soon after therapy, especially in treatment-resistant cases, to assess the patient's need for additional therapy to prevent further dilatation of the coronary artery. Kim et al.8) suggested guidelines for retreating KD patients who received IVIG treatment; these authors recommend that, in early-stage disease, additional therapy should be administered for febrile patients who have high values of CRP, NT-pro-BNP, and/or neutrophil counts after IVIG therapy. However, no definitive algorithm exists to determine the effectiveness of IVIG therapy and retreatment. In addition, it is also uncertain which agents are effective alternative treatments after failure to defervesce with initial IVIG treatment1).
In conclusion, controversy remains as to which risk factors predict patient responding to IVIG and what additional treatments should be applied to reduce the development of CAL. After performing our meta-analysis of large-scale studies, we found several laboratory predictive factors for IVIG-resistant KD. Therefore, in the presence of several such factors, clinicians should be alert to an increased likelihood that the patient may not respond adequately to initial IVIG therapy.


 PDF Links
 PubReader
 ePub Link
 PubMed
 Download Citation


