


Introduction
Iron is one of the essential elements for early brain growth and function; it is involved in appropriate white matter myelination, neurotransmitter synthesis, synaptogenesis, and cellular function such as intracellular signaling pathways and neuronal energy metabolism, including synthesis of cytochromes and adenosine triphosphate formation [1,2].
The neonatal brain in human is relatively larger than other animals, has a higher metabolic rate, and develops continuously over the fetal period and early infancy [2,3]. Therefore, this micronutrient deficiency during this critical period may cause adverse consequences in neurodevelopmental outcome. Several studies have been performed to demonstrate the impact of early iron deficiency on neurodevelopmental outcomes, showing abnormal neurodevelopmental consequences even in nonanemic iron deficiency [4-6]. Unfortunately, postnatal iron supplement did not correct these neurodevelopmental abnormalities [5,6]. Therefore, it is necessary to monitor iron status in infants with high risk of iron deficiency during this critical period. However, recent studies have focused on the iron storage in preterm infants or low birth weight infants [7-9]. The iron status of small for gestational age (SGA) infants is poorly understood, and published results are inconsistent [10,11]. Therefore, the aim of this study is to evaluate the iron status of SGA infants compared with appropriate for gestational age (AGA) infants at birth.
Materials and methods
A retrospective record review was carried out for a total of 904 newborns who delivered and admitted to the neonatal intensive care unit at Kyungpook National University Children’s Hospital between March 2014 and April 2017. The study was approved by the institutional ethical committee (approval number: 2018-04-020) and the requirement for written informed consent was waived as this was a deidentified, data-only study. Infants diagnosed as large for gestational age (LGA) or with fetal hydrops were excluded. As a result, 41 infants with LGA and 3 infants with hydrops fetalis were excluded from the analysis. Of the remaining 860 infants, serum ferritin levels were available in 832 infants who were included in the study. SGA was defined as birth weight less than the 10th percentile for GA using [12]. AGA was defined as birth weight between 10th to 90th percentile for GA.
The maternal and neonatal clinical characteristics including gestational age, sex, birth weight, birth height, head circumference at birth, mode of delivery, 1-min and 5-min Apgar scores, and maternal conditions affecting fetus were obtained by reviewing the medical records. Ponderal index was calculated by the equation: birth weight (g)×100/(height(cm))3. Microcephaly was defined as head circumferences under 10th percentile for gestational age. Complete blood count and iron parameters were measured within 24 hours after birth.
The iron storage status was assessed based on serum ferritin and total body iron (TBI) store at birth. TBI was calculated indirectly using serum ferritin and hemoglobin, which presented in the previous paper [TBI=(body weight (kg)×hemoglobin (g/dL)×2.74)+ (21.99 log (serum ferritin)–29.04)+body weight (kg)×7 mg] [13]. The low serum ferritin was defined as less than 5th percentile and high serum ferritin as more than 95th percentile [13]. The maternal iron deficiency was defined as serum ferritin <10 μg/L. The reference values for serum ferritin levels for each GA were based on the previous study [13].
Analyses were performed using IBM SPSS Statistics ver. 24.0 (IBM Co., Armonk, NY, USA). Data for normally distributed continuous variables were expressed as means and standard deviations and compared using Students t test. For nonnormally distributed variables were expressed as median and interquartile ranges and compared using the Mann-Whitney U test. Trends according to gestational age groups were analyzed by the Jonckheere-Terpstra test. The differences between the groups were analyzed by Kruskal-Wallis test and subgroup analysis. Analysis of covariance (ANCOVA) was used to compare the differences in means of ferritin at birth was compared between groups after adjusting for GA using ANCOVA. A P value of 0.05 was considered statistically significant.
Results
A total of 115 SGA and 717 AGA infants were included in the study. Table 1 shows the clinical characteristics of both groups. The proportion of subjects with mother of pregnancy-induced hypertension (PIH)/hypertension (HTN) (P<0.05), oligohydramnios (P< 0.05), Ponderal index below 10th percentile (P<0.05), and microcephaly (P<0.05) was higher in the SGA group.
Infants in the SGA group showed higher hematocrit compared with the AGA group (Table 2). Maternal ferritin values were higher in the SGA group while the rate of initial ferritin values below 5th percentile was higher in the SGA group. Although there was no difference in serum ferritin levels between the SGA and AGA groups, there was statistically significant differences in serum ferritin levels and TBI after adjusting for GA.
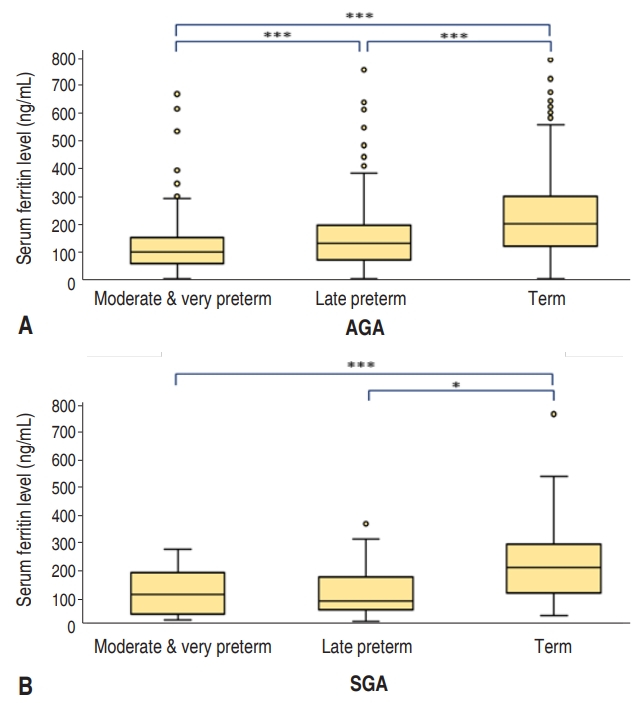
Serum ferritin levels showed a trend towards increasing with age in the both AGA and SGA groups (P<0.001). However, in the AGA groups, there was a statistically significant difference between each group while the levels in late preterm infants in the SGA group were not different from those in moderate and very preterm infants (P= 0.942), suggesting that iron accretion in the late preterm group is impaired (Fig. 1).
We analyzed the factors affecting serum ferritin level (Table 3) and TBI (Table 4) in each group. The pattern of influence of each factor on serum ferritin was different between the two groups. In the AGA groups, infants of mothers with conditions such as PIH/HTN or GDM/DM showed statistical differences in serum ferritin level, but this correlation was not found in the SGA group. Sex, Ponderal index under 10th percentile, and maternal oral iron supplementation did not make any difference in ferritin levels or TBI stores in both groups.
In the case of infants of mothers with GDM/DM, the AGA group showed lower ferritin levels, but there was no difference in TBI. In the infants of mothers diagnosed with PIH/HTN, the serum ferritin levels were lower in the AGA group but not in the SGA group. However, there were statistically significant differences in TBI according to the presence or absence of PIH/HTN in both the AGA and SGA groups.
Discussion
Iron accretion occurs mainly in the third trimester [7,14]. Therefore, premature infants may not receive enough iron at birth because they miss the opportunity to accrete iron during the last trimester. Likewise, intrauterine growth retardation could be disturbed by iron accretion due to placental insufficiency [8].
Although iron is the most abundant in red blood cells (RBCs), tissue iron is used first to maintain erythropoiesis in case of iron deficiency [15]. That means iron is prioritized to erythropoiesis in a state of iron deficiency even though this leads to a hierarchical loss of tissue iron; as a result, it is difficult to accurately determine the degree of tissue iron deficiency by measuring RBC parameters alone [1,15]. Therefore, various markers are used to evaluate the iron storage instead of RBC indices [15,16]. Among them, ferritin is the most commonly used marker to assess iron storage status during neonatal period [17,18]. However, ferritin is also an acute phase reactant that may increase during infection or inflammation and may not accurately reflect iron deficiency in this situation [19]. Therefore, TBI was indirectly calculated based on hemoglobin and serum ferritin as demonstrated in the previous studies [13].
This current study aimed to evaluate the differences in iron status between the AGA and SGA groups, and showed lower serum ferritin and TBI values in the SGA group. Saha et al. [10] reported that the term and late preterm SGA infants had iron stores comparable to AGA infants. On the other hand, Mukhopadhyay et al. [11] demonstrated lower cord ferritin levels in the term SGA infants. Although they did not investigate ferritin levels in the late preterm SGA groups, this study showed that iron accretion could be also impaired in late preterm SGA infants. There was no difference in serum ferritin levels at birth between the AGA and SGA groups. However, there are statistically significant differences in serum ferritin levels after adjusting to GA, suggesting the SGA group was exposed to the risk of iron deficiency in this study. In addition, the TBI was significantly lower in the SGA groups, suggesting its utility as another indicator of impaired iron storage in SGA infants.
Accretion of iron during pregnancy is affected by various factors; maternal HTN and diabetes are known to lower ferritin levels [20-22], and infection and inflammation are known to increase the ferritin levels [19]. In the case of PIH, iron accretion may be impaired due to placental insufficiency [21]. In maternal diabetes, iron is used for hematopoiesis caused by fetal hypoxia and the ferritin level can be lowered [22]. These factors provide some explanation for lower serum ferritin levels in the AGA group. However, as these conditions become worse, inflammation may develop, counteracting the decrease in the ferritin levels, which may explain why the difference does not occur in the SGA group [23,24]. Akkurt et al. [25] reported that maternal ferritin was higher in the SGA group, consistent with this study. They suggested that high maternal ferritin may lead to hemoconcentration which reduce uteroplacental blood flow, increase oxidative stress due to increased free iron, and be secondary to inflammatory responses from placental insufficiency. In fact, the factors such as rupture of membrane over 18 hours, chorioamnionitis, and oligohydramnios, which statistically significantly influenced on ferritin level in the AGA group, did not affect the ferritin levels in the SGA group. Their results suggest that the increase in ferritin caused by inflammation could offset the difference. Nevertheless, maternal PIH/HTN or cesarean section (c-sec) consistently affected the ferritin levels in both groups. This suggests that these conditions may be more susceptible to impaired iron accretion due to uteroplacental insufficiency than inflammation. The reason that infants born by c-sec had lower ferritin levels may be explained by the factors that determine the operation rather than the operation itself, but further studies would be needed.
Interestingly, serum ferritin level was lower in infants of mothers with DM; this effect was not in TBI. In the case of maternal PIH/HTN, serum ferritin and TBI were consistently lower in both groups. This suggests that iron is used in hematopoiesis for infants of maternal GDM, and while ferritin is low, but there is no difference in TBI. In contrast, maternal PIH/HTN has low ferritin and low TBI, suggesting that iron accretion itself is disturbed due to placental insufficiency. In the case of late preterm in the SGA group, there was no increase in the ferritin levels; this may be due to the fact that infants with severe PIH tend to be delivered to late preterm. With increased severity of PIH and placental insufficiency, infants are more likely to be delivered as late preterm rather than full-term. Thus, PIH is an important indicator of fetal iron deficiency in both AGA and SGA groups.
The limitations of this study are that the SGA group includes heterogeneous etiologies of SGA; additionally, selection bias may have occurred, because all enrolled infants were admitted to the neonatal intensive care unit. In addition, factors such as smoking and maternal obesity also may affect the postnatal iron status [26]. However, the number of smokers in this study population was too small to be analyzed. Further research is needed to better investigate iron deficiency beyond the neonatal period. However, this study demonstrates the neonatal iron status and the effect of various perinatal factors on iron parameters in the SGA group. In conclusion, SGA infants have reduced iron stores, and iron deficiency should be monitored in patients with maternal HTN who are born at late preterm.
 PDF Links
 PubReader
 ePub Link
 PubMed
 Download Citation


